Free Statistics

of Irreproducible Research!

Author's title

Author*The author of this computation has been verified*
R Software Modulerwasp_exponentialsmoothing.wasp
Title produced by softwareExponential Smoothing
Date of computationFri, 21 Dec 2012 06:34:02 -0500
Cite this page as followsStatistical Computations at FreeStatistics.org, Office for Research Development and Education, URL https://freestatistics.org/blog/index.php?v=date/2012/Dec/21/t13560896567evnhoo75n033zt.htm/, Retrieved Tue, 30 Apr 2024 20:10:11 +0000
Statistical Computations at FreeStatistics.org, Office for Research Development and Education, URL https://freestatistics.org/blog/index.php?pk=203499, Retrieved Tue, 30 Apr 2024 20:10:11 +0000
QR Codes:

Original text written by user:
IsPrivate?No (this computation is public)
User-defined keywords
Estimated Impact110
Family? (F = Feedback message, R = changed R code, M = changed R Module, P = changed Parameters, D = changed Data)
-     [Exponential Smoothing] [HPC Retail Sales] [2008-03-10 17:43:04] [74be16979710d4c4e7c6647856088456]
- RM D  [Exponential Smoothing] [...] [2012-11-24 22:27:08] [0883bf8f4217d775edf6393676d58a73]
-    D    [Exponential Smoothing] [Single] [2012-12-21 11:31:18] [0604709baf8ca89a71bc0fcadc3cdffd]
- R PD      [Exponential Smoothing] [double] [2012-12-21 11:32:59] [0604709baf8ca89a71bc0fcadc3cdffd]
-   P           [Exponential Smoothing] [triple] [2012-12-21 11:34:02] [b650a28572edc4a1d205c228043a3295] [Current]
Feedback Forum

Post a new message
Dataseries X:
1.4761
1.4721
1.487
1.5167
1.5812
1.554
1.5508
1.5764
1.5611
1.4735
1.4303
1.2757
1.2727
1.3917
1.2816
1.2644
1.3308
1.3275
1.4098
1.4134
1.4138
1.4272
1.4643
1.48
1.5023
1.4406
1.3966
1.357
1.3479
1.3315
1.2307
1.2271
1.3028
1.268
1.3648
1.3857
1.2998
1.3362
1.3692
1.3834
1.4207
1.486
1.4385
1.4453
1.426
1.445
1.3503
1.4001
1.3418
1.2939
1.3176
1.3443
1.3356
1.3214
1.2403
1.259
1.2284
1.2611
1.293
1.2993
1.2986


Summary of computational transaction
Raw Inputview raw input (R code)
Raw Outputview raw output of R engine
Computing time3 seconds
R Server'Gertrude Mary Cox' @ cox.wessa.net

\begin{tabular}{lllllllll}
\hline
Summary of computational transaction \tabularnewline
Raw Input & view raw input (R code)  \tabularnewline
Raw Output & view raw output of R engine  \tabularnewline
Computing time & 3 seconds \tabularnewline
R Server & 'Gertrude Mary Cox' @ cox.wessa.net \tabularnewline
\hline
\end{tabular}
%Source: https://freestatistics.org/blog/index.php?pk=203499&T=0

[TABLE]
[ROW][C]Summary of computational transaction[/C][/ROW]
[ROW][C]Raw Input[/C][C]view raw input (R code) [/C][/ROW]
[ROW][C]Raw Output[/C][C]view raw output of R engine [/C][/ROW]
[ROW][C]Computing time[/C][C]3 seconds[/C][/ROW]
[ROW][C]R Server[/C][C]'Gertrude Mary Cox' @ cox.wessa.net[/C][/ROW]
[/TABLE]
Source: https://freestatistics.org/blog/index.php?pk=203499&T=0

Globally Unique Identifier (entire table): ba.freestatistics.org/blog/index.php?pk=203499&T=0

As an alternative you can also use a QR Code:  

The GUIDs for individual cells are displayed in the table below:

Summary of computational transaction
Raw Inputview raw input (R code)
Raw Outputview raw output of R engine
Computing time3 seconds
R Server'Gertrude Mary Cox' @ cox.wessa.net


Estimated Parameters of Exponential Smoothing
ParameterValue
alpha0.690931889653249
beta0
gamma1

\begin{tabular}{lllllllll}
\hline
Estimated Parameters of Exponential Smoothing \tabularnewline
Parameter & Value \tabularnewline
alpha & 0.690931889653249 \tabularnewline
beta & 0 \tabularnewline
gamma & 1 \tabularnewline
\hline
\end{tabular}
%Source: https://freestatistics.org/blog/index.php?pk=203499&T=1

[TABLE]
[ROW][C]Estimated Parameters of Exponential Smoothing[/C][/ROW]
[ROW][C]Parameter[/C][C]Value[/C][/ROW]
[ROW][C]alpha[/C][C]0.690931889653249[/C][/ROW]
[ROW][C]beta[/C][C]0[/C][/ROW]
[ROW][C]gamma[/C][C]1[/C][/ROW]
[/TABLE]
Source: https://freestatistics.org/blog/index.php?pk=203499&T=1

Globally Unique Identifier (entire table): ba.freestatistics.org/blog/index.php?pk=203499&T=1

As an alternative you can also use a QR Code:  

The GUIDs for individual cells are displayed in the table below:

Estimated Parameters of Exponential Smoothing
ParameterValue
alpha0.690931889653249
beta0
gamma1


Interpolation Forecasts of Exponential Smoothing
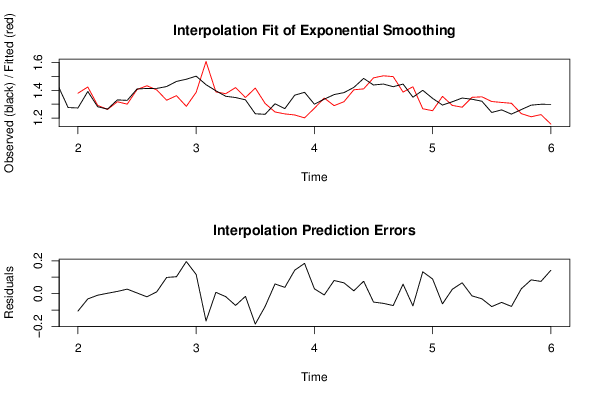
tObservedFittedResiduals
131.27271.3790280715812-0.106328071581196
141.39171.42402632536787-0.0323263253678738
151.28161.29131724550336-0.0097172455033625
161.26441.262266999912960.00213300008704098
171.33081.317450300234520.0133496997654787
181.32751.300241909393910.0272580906060869
191.40981.405993269318840.00380673068115822
201.41341.43284550348257-0.0194455034825682
211.41381.402815360890220.0109846391097754
221.42721.328672874221630.0985271257783733
231.46431.361291283291910.103008716708093
241.481.284531166451910.195468833548088
251.50231.385833743363990.116466256636013
261.44061.60763928321432-0.167039283214318
271.39661.388840470414590.00775952958541182
281.3571.37552801907309-0.0185280190730872
291.34791.41990268655812-0.0720026865581216
301.33151.3480202502236-0.016520250223605
311.23071.41627569089613-0.185575690896131
321.22711.30509104657803-0.0779910465780296
331.30281.244014907932560.0587850920674391
341.2681.2299558694820.0380441305179982
351.36481.222169765185140.142630234814862
361.38571.201361892315760.18433810768424
371.29981.270556718614780.0292432813852248
381.33621.34447460187952-0.00827460187952345
391.36921.289396109127510.0798038908724927
401.38341.317736761479420.06566323852058
411.42071.403754539234910.0169454607650901
421.4861.410477066166920.0755229338330816
431.43851.49007843233694-0.0515784323369382
441.44531.50472774980522-0.0594277498052178
451.4261.49875072758886-0.0727507275888624
461.4451.387399026913230.0576009730867744
471.35031.42544959843162-0.0751495984316177
481.40011.26706126730320.133038732696798
491.34181.252876854615320.088923145384681
501.29391.35643387780261-0.0625338778026145
511.31761.29108817432290.0265118256771046
521.34431.278237214664360.0660627853356415
531.33561.3494739405446-0.0138739405446018
541.32141.35300678920173-0.0316067892017349
551.24031.31930583433262-0.0790058343326212
561.2591.31257871139431-0.0535787113943116
571.22841.30652526877207-0.078125268772075
581.26111.231747680009010.0293523199909937
591.2931.209251387977130.083748612022869
601.29931.224995271758660.0743047282413438
611.29861.156594941178070.142005058821929

\begin{tabular}{lllllllll}
\hline
Interpolation Forecasts of Exponential Smoothing \tabularnewline
t & Observed & Fitted & Residuals \tabularnewline
13 & 1.2727 & 1.3790280715812 & -0.106328071581196 \tabularnewline
14 & 1.3917 & 1.42402632536787 & -0.0323263253678738 \tabularnewline
15 & 1.2816 & 1.29131724550336 & -0.0097172455033625 \tabularnewline
16 & 1.2644 & 1.26226699991296 & 0.00213300008704098 \tabularnewline
17 & 1.3308 & 1.31745030023452 & 0.0133496997654787 \tabularnewline
18 & 1.3275 & 1.30024190939391 & 0.0272580906060869 \tabularnewline
19 & 1.4098 & 1.40599326931884 & 0.00380673068115822 \tabularnewline
20 & 1.4134 & 1.43284550348257 & -0.0194455034825682 \tabularnewline
21 & 1.4138 & 1.40281536089022 & 0.0109846391097754 \tabularnewline
22 & 1.4272 & 1.32867287422163 & 0.0985271257783733 \tabularnewline
23 & 1.4643 & 1.36129128329191 & 0.103008716708093 \tabularnewline
24 & 1.48 & 1.28453116645191 & 0.195468833548088 \tabularnewline
25 & 1.5023 & 1.38583374336399 & 0.116466256636013 \tabularnewline
26 & 1.4406 & 1.60763928321432 & -0.167039283214318 \tabularnewline
27 & 1.3966 & 1.38884047041459 & 0.00775952958541182 \tabularnewline
28 & 1.357 & 1.37552801907309 & -0.0185280190730872 \tabularnewline
29 & 1.3479 & 1.41990268655812 & -0.0720026865581216 \tabularnewline
30 & 1.3315 & 1.3480202502236 & -0.016520250223605 \tabularnewline
31 & 1.2307 & 1.41627569089613 & -0.185575690896131 \tabularnewline
32 & 1.2271 & 1.30509104657803 & -0.0779910465780296 \tabularnewline
33 & 1.3028 & 1.24401490793256 & 0.0587850920674391 \tabularnewline
34 & 1.268 & 1.229955869482 & 0.0380441305179982 \tabularnewline
35 & 1.3648 & 1.22216976518514 & 0.142630234814862 \tabularnewline
36 & 1.3857 & 1.20136189231576 & 0.18433810768424 \tabularnewline
37 & 1.2998 & 1.27055671861478 & 0.0292432813852248 \tabularnewline
38 & 1.3362 & 1.34447460187952 & -0.00827460187952345 \tabularnewline
39 & 1.3692 & 1.28939610912751 & 0.0798038908724927 \tabularnewline
40 & 1.3834 & 1.31773676147942 & 0.06566323852058 \tabularnewline
41 & 1.4207 & 1.40375453923491 & 0.0169454607650901 \tabularnewline
42 & 1.486 & 1.41047706616692 & 0.0755229338330816 \tabularnewline
43 & 1.4385 & 1.49007843233694 & -0.0515784323369382 \tabularnewline
44 & 1.4453 & 1.50472774980522 & -0.0594277498052178 \tabularnewline
45 & 1.426 & 1.49875072758886 & -0.0727507275888624 \tabularnewline
46 & 1.445 & 1.38739902691323 & 0.0576009730867744 \tabularnewline
47 & 1.3503 & 1.42544959843162 & -0.0751495984316177 \tabularnewline
48 & 1.4001 & 1.2670612673032 & 0.133038732696798 \tabularnewline
49 & 1.3418 & 1.25287685461532 & 0.088923145384681 \tabularnewline
50 & 1.2939 & 1.35643387780261 & -0.0625338778026145 \tabularnewline
51 & 1.3176 & 1.2910881743229 & 0.0265118256771046 \tabularnewline
52 & 1.3443 & 1.27823721466436 & 0.0660627853356415 \tabularnewline
53 & 1.3356 & 1.3494739405446 & -0.0138739405446018 \tabularnewline
54 & 1.3214 & 1.35300678920173 & -0.0316067892017349 \tabularnewline
55 & 1.2403 & 1.31930583433262 & -0.0790058343326212 \tabularnewline
56 & 1.259 & 1.31257871139431 & -0.0535787113943116 \tabularnewline
57 & 1.2284 & 1.30652526877207 & -0.078125268772075 \tabularnewline
58 & 1.2611 & 1.23174768000901 & 0.0293523199909937 \tabularnewline
59 & 1.293 & 1.20925138797713 & 0.083748612022869 \tabularnewline
60 & 1.2993 & 1.22499527175866 & 0.0743047282413438 \tabularnewline
61 & 1.2986 & 1.15659494117807 & 0.142005058821929 \tabularnewline
\hline
\end{tabular}
%Source: https://freestatistics.org/blog/index.php?pk=203499&T=2

[TABLE]
[ROW][C]Interpolation Forecasts of Exponential Smoothing[/C][/ROW]
[ROW][C]t[/C][C]Observed[/C][C]Fitted[/C][C]Residuals[/C][/ROW]
[ROW][C]13[/C][C]1.2727[/C][C]1.3790280715812[/C][C]-0.106328071581196[/C][/ROW]
[ROW][C]14[/C][C]1.3917[/C][C]1.42402632536787[/C][C]-0.0323263253678738[/C][/ROW]
[ROW][C]15[/C][C]1.2816[/C][C]1.29131724550336[/C][C]-0.0097172455033625[/C][/ROW]
[ROW][C]16[/C][C]1.2644[/C][C]1.26226699991296[/C][C]0.00213300008704098[/C][/ROW]
[ROW][C]17[/C][C]1.3308[/C][C]1.31745030023452[/C][C]0.0133496997654787[/C][/ROW]
[ROW][C]18[/C][C]1.3275[/C][C]1.30024190939391[/C][C]0.0272580906060869[/C][/ROW]
[ROW][C]19[/C][C]1.4098[/C][C]1.40599326931884[/C][C]0.00380673068115822[/C][/ROW]
[ROW][C]20[/C][C]1.4134[/C][C]1.43284550348257[/C][C]-0.0194455034825682[/C][/ROW]
[ROW][C]21[/C][C]1.4138[/C][C]1.40281536089022[/C][C]0.0109846391097754[/C][/ROW]
[ROW][C]22[/C][C]1.4272[/C][C]1.32867287422163[/C][C]0.0985271257783733[/C][/ROW]
[ROW][C]23[/C][C]1.4643[/C][C]1.36129128329191[/C][C]0.103008716708093[/C][/ROW]
[ROW][C]24[/C][C]1.48[/C][C]1.28453116645191[/C][C]0.195468833548088[/C][/ROW]
[ROW][C]25[/C][C]1.5023[/C][C]1.38583374336399[/C][C]0.116466256636013[/C][/ROW]
[ROW][C]26[/C][C]1.4406[/C][C]1.60763928321432[/C][C]-0.167039283214318[/C][/ROW]
[ROW][C]27[/C][C]1.3966[/C][C]1.38884047041459[/C][C]0.00775952958541182[/C][/ROW]
[ROW][C]28[/C][C]1.357[/C][C]1.37552801907309[/C][C]-0.0185280190730872[/C][/ROW]
[ROW][C]29[/C][C]1.3479[/C][C]1.41990268655812[/C][C]-0.0720026865581216[/C][/ROW]
[ROW][C]30[/C][C]1.3315[/C][C]1.3480202502236[/C][C]-0.016520250223605[/C][/ROW]
[ROW][C]31[/C][C]1.2307[/C][C]1.41627569089613[/C][C]-0.185575690896131[/C][/ROW]
[ROW][C]32[/C][C]1.2271[/C][C]1.30509104657803[/C][C]-0.0779910465780296[/C][/ROW]
[ROW][C]33[/C][C]1.3028[/C][C]1.24401490793256[/C][C]0.0587850920674391[/C][/ROW]
[ROW][C]34[/C][C]1.268[/C][C]1.229955869482[/C][C]0.0380441305179982[/C][/ROW]
[ROW][C]35[/C][C]1.3648[/C][C]1.22216976518514[/C][C]0.142630234814862[/C][/ROW]
[ROW][C]36[/C][C]1.3857[/C][C]1.20136189231576[/C][C]0.18433810768424[/C][/ROW]
[ROW][C]37[/C][C]1.2998[/C][C]1.27055671861478[/C][C]0.0292432813852248[/C][/ROW]
[ROW][C]38[/C][C]1.3362[/C][C]1.34447460187952[/C][C]-0.00827460187952345[/C][/ROW]
[ROW][C]39[/C][C]1.3692[/C][C]1.28939610912751[/C][C]0.0798038908724927[/C][/ROW]
[ROW][C]40[/C][C]1.3834[/C][C]1.31773676147942[/C][C]0.06566323852058[/C][/ROW]
[ROW][C]41[/C][C]1.4207[/C][C]1.40375453923491[/C][C]0.0169454607650901[/C][/ROW]
[ROW][C]42[/C][C]1.486[/C][C]1.41047706616692[/C][C]0.0755229338330816[/C][/ROW]
[ROW][C]43[/C][C]1.4385[/C][C]1.49007843233694[/C][C]-0.0515784323369382[/C][/ROW]
[ROW][C]44[/C][C]1.4453[/C][C]1.50472774980522[/C][C]-0.0594277498052178[/C][/ROW]
[ROW][C]45[/C][C]1.426[/C][C]1.49875072758886[/C][C]-0.0727507275888624[/C][/ROW]
[ROW][C]46[/C][C]1.445[/C][C]1.38739902691323[/C][C]0.0576009730867744[/C][/ROW]
[ROW][C]47[/C][C]1.3503[/C][C]1.42544959843162[/C][C]-0.0751495984316177[/C][/ROW]
[ROW][C]48[/C][C]1.4001[/C][C]1.2670612673032[/C][C]0.133038732696798[/C][/ROW]
[ROW][C]49[/C][C]1.3418[/C][C]1.25287685461532[/C][C]0.088923145384681[/C][/ROW]
[ROW][C]50[/C][C]1.2939[/C][C]1.35643387780261[/C][C]-0.0625338778026145[/C][/ROW]
[ROW][C]51[/C][C]1.3176[/C][C]1.2910881743229[/C][C]0.0265118256771046[/C][/ROW]
[ROW][C]52[/C][C]1.3443[/C][C]1.27823721466436[/C][C]0.0660627853356415[/C][/ROW]
[ROW][C]53[/C][C]1.3356[/C][C]1.3494739405446[/C][C]-0.0138739405446018[/C][/ROW]
[ROW][C]54[/C][C]1.3214[/C][C]1.35300678920173[/C][C]-0.0316067892017349[/C][/ROW]
[ROW][C]55[/C][C]1.2403[/C][C]1.31930583433262[/C][C]-0.0790058343326212[/C][/ROW]
[ROW][C]56[/C][C]1.259[/C][C]1.31257871139431[/C][C]-0.0535787113943116[/C][/ROW]
[ROW][C]57[/C][C]1.2284[/C][C]1.30652526877207[/C][C]-0.078125268772075[/C][/ROW]
[ROW][C]58[/C][C]1.2611[/C][C]1.23174768000901[/C][C]0.0293523199909937[/C][/ROW]
[ROW][C]59[/C][C]1.293[/C][C]1.20925138797713[/C][C]0.083748612022869[/C][/ROW]
[ROW][C]60[/C][C]1.2993[/C][C]1.22499527175866[/C][C]0.0743047282413438[/C][/ROW]
[ROW][C]61[/C][C]1.2986[/C][C]1.15659494117807[/C][C]0.142005058821929[/C][/ROW]
[/TABLE]
Source: https://freestatistics.org/blog/index.php?pk=203499&T=2

Globally Unique Identifier (entire table): ba.freestatistics.org/blog/index.php?pk=203499&T=2

As an alternative you can also use a QR Code:  

The GUIDs for individual cells are displayed in the table below:

Interpolation Forecasts of Exponential Smoothing
tObservedFittedResiduals
131.27271.3790280715812-0.106328071581196
141.39171.42402632536787-0.0323263253678738
151.28161.29131724550336-0.0097172455033625
161.26441.262266999912960.00213300008704098
171.33081.317450300234520.0133496997654787
181.32751.300241909393910.0272580906060869
191.40981.405993269318840.00380673068115822
201.41341.43284550348257-0.0194455034825682
211.41381.402815360890220.0109846391097754
221.42721.328672874221630.0985271257783733
231.46431.361291283291910.103008716708093
241.481.284531166451910.195468833548088
251.50231.385833743363990.116466256636013
261.44061.60763928321432-0.167039283214318
271.39661.388840470414590.00775952958541182
281.3571.37552801907309-0.0185280190730872
291.34791.41990268655812-0.0720026865581216
301.33151.3480202502236-0.016520250223605
311.23071.41627569089613-0.185575690896131
321.22711.30509104657803-0.0779910465780296
331.30281.244014907932560.0587850920674391
341.2681.2299558694820.0380441305179982
351.36481.222169765185140.142630234814862
361.38571.201361892315760.18433810768424
371.29981.270556718614780.0292432813852248
381.33621.34447460187952-0.00827460187952345
391.36921.289396109127510.0798038908724927
401.38341.317736761479420.06566323852058
411.42071.403754539234910.0169454607650901
421.4861.410477066166920.0755229338330816
431.43851.49007843233694-0.0515784323369382
441.44531.50472774980522-0.0594277498052178
451.4261.49875072758886-0.0727507275888624
461.4451.387399026913230.0576009730867744
471.35031.42544959843162-0.0751495984316177
481.40011.26706126730320.133038732696798
491.34181.252876854615320.088923145384681
501.29391.35643387780261-0.0625338778026145
511.31761.29108817432290.0265118256771046
521.34431.278237214664360.0660627853356415
531.33561.3494739405446-0.0138739405446018
541.32141.35300678920173-0.0316067892017349
551.24031.31930583433262-0.0790058343326212
561.2591.31257871139431-0.0535787113943116
571.22841.30652526877207-0.078125268772075
581.26111.231747680009010.0293523199909937
591.2931.209251387977130.083748612022869
601.29931.224995271758660.0743047282413438
611.29861.156594941178070.142005058821929


Extrapolation Forecasts of Exponential Smoothing
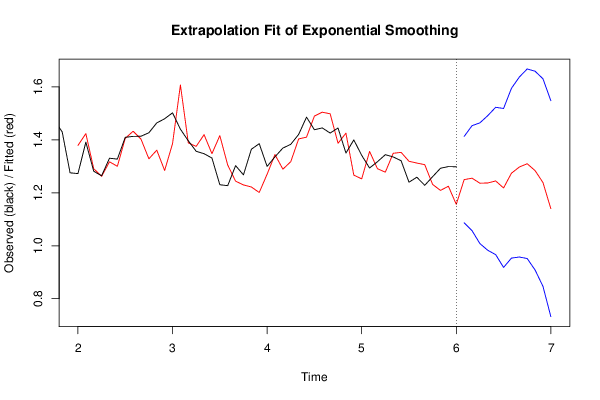
tForecast95% Lower Bound95% Upper Bound
621.250017415167731.086854488553021.41318034178245
631.255399549354491.057078594412961.45372050429603
641.236454664246781.008331316655261.46457801183831
651.23734061220420.9828817309211811.49179949348722
661.244978750793230.966665289366641.52329221221981
671.21846640120230.918187458619421.51874534378517
681.274185641511150.9534419682982081.5949293147241
691.297564881093510.957586110501031.63754365168599
701.309984427176430.951802036485571.66816681786728
711.284019840415630.9085152658117241.65952441501953
721.238980334121670.8469181629091121.63104250533422
731.140164510489510.7322162213114031.54811279966762

\begin{tabular}{lllllllll}
\hline
Extrapolation Forecasts of Exponential Smoothing \tabularnewline
t & Forecast & 95% Lower Bound & 95% Upper Bound \tabularnewline
62 & 1.25001741516773 & 1.08685448855302 & 1.41318034178245 \tabularnewline
63 & 1.25539954935449 & 1.05707859441296 & 1.45372050429603 \tabularnewline
64 & 1.23645466424678 & 1.00833131665526 & 1.46457801183831 \tabularnewline
65 & 1.2373406122042 & 0.982881730921181 & 1.49179949348722 \tabularnewline
66 & 1.24497875079323 & 0.96666528936664 & 1.52329221221981 \tabularnewline
67 & 1.2184664012023 & 0.91818745861942 & 1.51874534378517 \tabularnewline
68 & 1.27418564151115 & 0.953441968298208 & 1.5949293147241 \tabularnewline
69 & 1.29756488109351 & 0.95758611050103 & 1.63754365168599 \tabularnewline
70 & 1.30998442717643 & 0.95180203648557 & 1.66816681786728 \tabularnewline
71 & 1.28401984041563 & 0.908515265811724 & 1.65952441501953 \tabularnewline
72 & 1.23898033412167 & 0.846918162909112 & 1.63104250533422 \tabularnewline
73 & 1.14016451048951 & 0.732216221311403 & 1.54811279966762 \tabularnewline
\hline
\end{tabular}
%Source: https://freestatistics.org/blog/index.php?pk=203499&T=3

[TABLE]
[ROW][C]Extrapolation Forecasts of Exponential Smoothing[/C][/ROW]
[ROW][C]t[/C][C]Forecast[/C][C]95% Lower Bound[/C][C]95% Upper Bound[/C][/ROW]
[ROW][C]62[/C][C]1.25001741516773[/C][C]1.08685448855302[/C][C]1.41318034178245[/C][/ROW]
[ROW][C]63[/C][C]1.25539954935449[/C][C]1.05707859441296[/C][C]1.45372050429603[/C][/ROW]
[ROW][C]64[/C][C]1.23645466424678[/C][C]1.00833131665526[/C][C]1.46457801183831[/C][/ROW]
[ROW][C]65[/C][C]1.2373406122042[/C][C]0.982881730921181[/C][C]1.49179949348722[/C][/ROW]
[ROW][C]66[/C][C]1.24497875079323[/C][C]0.96666528936664[/C][C]1.52329221221981[/C][/ROW]
[ROW][C]67[/C][C]1.2184664012023[/C][C]0.91818745861942[/C][C]1.51874534378517[/C][/ROW]
[ROW][C]68[/C][C]1.27418564151115[/C][C]0.953441968298208[/C][C]1.5949293147241[/C][/ROW]
[ROW][C]69[/C][C]1.29756488109351[/C][C]0.95758611050103[/C][C]1.63754365168599[/C][/ROW]
[ROW][C]70[/C][C]1.30998442717643[/C][C]0.95180203648557[/C][C]1.66816681786728[/C][/ROW]
[ROW][C]71[/C][C]1.28401984041563[/C][C]0.908515265811724[/C][C]1.65952441501953[/C][/ROW]
[ROW][C]72[/C][C]1.23898033412167[/C][C]0.846918162909112[/C][C]1.63104250533422[/C][/ROW]
[ROW][C]73[/C][C]1.14016451048951[/C][C]0.732216221311403[/C][C]1.54811279966762[/C][/ROW]
[/TABLE]
Source: https://freestatistics.org/blog/index.php?pk=203499&T=3

Globally Unique Identifier (entire table): ba.freestatistics.org/blog/index.php?pk=203499&T=3

As an alternative you can also use a QR Code:  

The GUIDs for individual cells are displayed in the table below:

Extrapolation Forecasts of Exponential Smoothing
tForecast95% Lower Bound95% Upper Bound
621.250017415167731.086854488553021.41318034178245
631.255399549354491.057078594412961.45372050429603
641.236454664246781.008331316655261.46457801183831
651.23734061220420.9828817309211811.49179949348722
661.244978750793230.966665289366641.52329221221981
671.21846640120230.918187458619421.51874534378517
681.274185641511150.9534419682982081.5949293147241
691.297564881093510.957586110501031.63754365168599
701.309984427176430.951802036485571.66816681786728
711.284019840415630.9085152658117241.65952441501953
721.238980334121670.8469181629091121.63104250533422
731.140164510489510.7322162213114031.54811279966762


Parameters (Session):
par1 = 12 ; par2 = Triple ; par3 = additive ;
Parameters (R input):
par1 = 12 ; par2 = Triple ; par3 = additive ;
R code (references can be found in the software module):
par1 <- as.numeric(par1)
if (par2 == 'Single') K <- 1
if (par2 == 'Double') K <- 2
if (par2 == 'Triple') K <- par1
nx <- length(x)
nxmK <- nx - K
x <- ts(x, frequency = par1)
if (par2 == 'Single') fit <- HoltWinters(x, gamma=F, beta=F)
if (par2 == 'Double') fit <- HoltWinters(x, gamma=F)
if (par2 == 'Triple') fit <- HoltWinters(x, seasonal=par3)
fit
myresid <- x - fit$fitted[,'xhat']
bitmap(file='test1.png')
op <- par(mfrow=c(2,1))
plot(fit,ylab='Observed (black) / Fitted (red)',main='Interpolation Fit of Exponential Smoothing')
plot(myresid,ylab='Residuals',main='Interpolation Prediction Errors')
par(op)
dev.off()
bitmap(file='test2.png')
p <- predict(fit, par1, prediction.interval=TRUE)
np <- length(p[,1])
plot(fit,p,ylab='Observed (black) / Fitted (red)',main='Extrapolation Fit of Exponential Smoothing')
dev.off()
bitmap(file='test3.png')
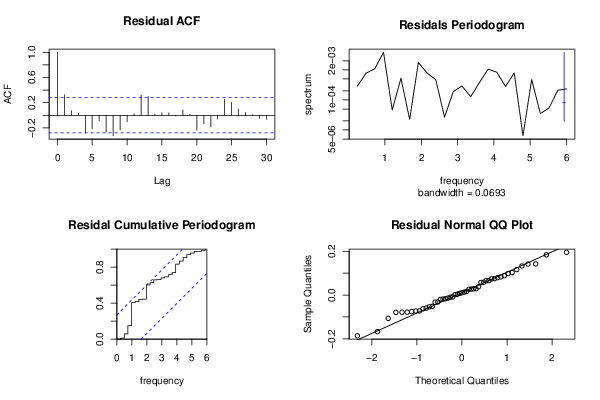
op <- par(mfrow = c(2,2))
acf(as.numeric(myresid),lag.max = nx/2,main='Residual ACF')
spectrum(myresid,main='Residals Periodogram')
cpgram(myresid,main='Residal Cumulative Periodogram')
qqnorm(myresid,main='Residual Normal QQ Plot')
qqline(myresid)
par(op)
dev.off()
load(file='createtable')
a<-table.start()
a<-table.row.start(a)
a<-table.element(a,'Estimated Parameters of Exponential Smoothing',2,TRUE)
a<-table.row.end(a)
a<-table.row.start(a)
a<-table.element(a,'Parameter',header=TRUE)
a<-table.element(a,'Value',header=TRUE)
a<-table.row.end(a)
a<-table.row.start(a)
a<-table.element(a,'alpha',header=TRUE)
a<-table.element(a,fit$alpha)
a<-table.row.end(a)
a<-table.row.start(a)
a<-table.element(a,'beta',header=TRUE)
a<-table.element(a,fit$beta)
a<-table.row.end(a)
a<-table.row.start(a)
a<-table.element(a,'gamma',header=TRUE)
a<-table.element(a,fit$gamma)
a<-table.row.end(a)
a<-table.end(a)
table.save(a,file='mytable.tab')
a<-table.start()
a<-table.row.start(a)
a<-table.element(a,'Interpolation Forecasts of Exponential Smoothing',4,TRUE)
a<-table.row.end(a)
a<-table.row.start(a)
a<-table.element(a,'t',header=TRUE)
a<-table.element(a,'Observed',header=TRUE)
a<-table.element(a,'Fitted',header=TRUE)
a<-table.element(a,'Residuals',header=TRUE)
a<-table.row.end(a)
for (i in 1:nxmK) {
a<-table.row.start(a)
a<-table.element(a,i+K,header=TRUE)
a<-table.element(a,x[i+K])
a<-table.element(a,fit$fitted[i,'xhat'])
a<-table.element(a,myresid[i])
a<-table.row.end(a)
}
a<-table.end(a)
table.save(a,file='mytable1.tab')
a<-table.start()
a<-table.row.start(a)
a<-table.element(a,'Extrapolation Forecasts of Exponential Smoothing',4,TRUE)
a<-table.row.end(a)
a<-table.row.start(a)
a<-table.element(a,'t',header=TRUE)
a<-table.element(a,'Forecast',header=TRUE)
a<-table.element(a,'95% Lower Bound',header=TRUE)
a<-table.element(a,'95% Upper Bound',header=TRUE)
a<-table.row.end(a)
for (i in 1:np) {
a<-table.row.start(a)
a<-table.element(a,nx+i,header=TRUE)
a<-table.element(a,p[i,'fit'])
a<-table.element(a,p[i,'lwr'])
a<-table.element(a,p[i,'upr'])
a<-table.row.end(a)
}
a<-table.end(a)
table.save(a,file='mytable2.tab')