Free Statistics
of Irreproducible Research!
Description of Statistical Computation | |||||||||||||||||||||||||||||||||||||||||||||
|---|---|---|---|---|---|---|---|---|---|---|---|---|---|---|---|---|---|---|---|---|---|---|---|---|---|---|---|---|---|---|---|---|---|---|---|---|---|---|---|---|---|---|---|---|---|
| Author's title | |||||||||||||||||||||||||||||||||||||||||||||
| Author | *The author of this computation has been verified* | ||||||||||||||||||||||||||||||||||||||||||||
| R Software Module | rwasp_bidensity.wasp | ||||||||||||||||||||||||||||||||||||||||||||
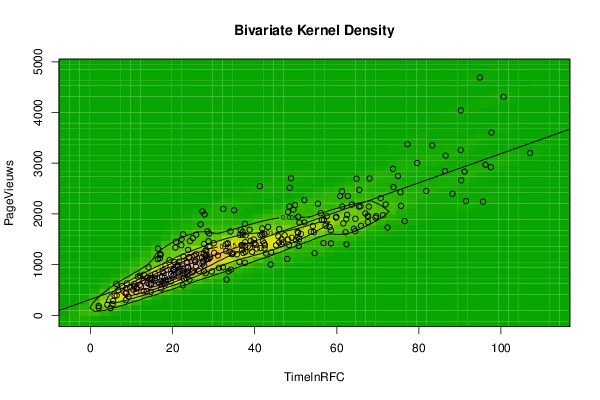
| Title produced by software | Bivariate Kernel Density Estimation | ||||||||||||||||||||||||||||||||||||||||||||
| Date of computation | Tue, 18 Dec 2012 06:51:59 -0500 | ||||||||||||||||||||||||||||||||||||||||||||
| Cite this page as follows | Statistical Computations at FreeStatistics.org, Office for Research Development and Education, URL https://freestatistics.org/blog/index.php?v=date/2012/Dec/18/t1355831530zuf2dyur9r2ijbo.htm/, Retrieved Thu, 03 Jul 2025 00:28:19 +0000 | ||||||||||||||||||||||||||||||||||||||||||||
| Statistical Computations at FreeStatistics.org, Office for Research Development and Education, URL https://freestatistics.org/blog/index.php?pk=201393, Retrieved Thu, 03 Jul 2025 00:28:19 +0000 | |||||||||||||||||||||||||||||||||||||||||||||
| QR Codes: | |||||||||||||||||||||||||||||||||||||||||||||
|
| |||||||||||||||||||||||||||||||||||||||||||||
| Original text written by user: | |||||||||||||||||||||||||||||||||||||||||||||
| IsPrivate? | No (this computation is public) | ||||||||||||||||||||||||||||||||||||||||||||
| User-defined keywords | |||||||||||||||||||||||||||||||||||||||||||||
| Estimated Impact | 205 | ||||||||||||||||||||||||||||||||||||||||||||
Tree of Dependent Computations | |||||||||||||||||||||||||||||||||||||||||||||
| Family? (F = Feedback message, R = changed R code, M = changed R Module, P = changed Parameters, D = changed Data) | |||||||||||||||||||||||||||||||||||||||||||||
| - [Bivariate Kernel Density Estimation] [] [2012-12-18 11:51:59] [8320012c80513ed9c03312c2688c5a59] [Current] | |||||||||||||||||||||||||||||||||||||||||||||
| Feedback Forum | |||||||||||||||||||||||||||||||||||||||||||||
Post a new message | |||||||||||||||||||||||||||||||||||||||||||||
Dataset | |||||||||||||||||||||||||||||||||||||||||||||
| Dataseries X: | |||||||||||||||||||||||||||||||||||||||||||||
58.58527778 33.60611111 49.03 49.81138889 34.21805556 14.65166667 107.0927778 9.213888889 28.23472222 41.40583333 45.95722222 65.8925 48.14611111 36.98083333 71.90916667 50.02305556 90.22194444 64.15666667 65.77361111 37.63138889 56.36805556 59.76305556 95.63805556 42.75972222 36.92861111 48.53444444 48.44861111 62.65222222 62.12 34.67138889 61.58277778 58.54638889 47.29611111 72.37805556 23.57027778 81.78444444 28.05861111 59.90027778 90.3075 1.993333333 46.53944444 29.55777778 26.82222222 73.82472222 74.90305556 41.42 48.84 42.46416667 31.01805556 32.33555556 100.6391667 21.88888889 50.87972222 77.2125 41.84138889 46.89138889 6.718888889 91.46305556 18.06361111 28.0825 60.81833333 67.79222222 94.88055556 28.77694444 64.81333333 71.23944444 57.26694444 86.52027778 65.5 49.4275 57.54888889 54.59805556 48.38444444 39.79055556 52.09972222 52.13361111 33.06 50.60888889 20.435 54.16083333 46.52444444 39.93222222 76.53916667 67.55527778 50.83305556 37.68027778 42.30527778 33.39472222 96.24583333 40.49722222 53.70527778 22.48694444 34.10388889 36.27361111 31.28083333 79.57444444 66.96277778 41.235 56.86472222 50.5775 38.98444444 61.25444444 67.51666667 45.2125 50.72583333 64.48277778 73.69944444 23.77055556 86.34416667 62.51666667 64.5325 40.26833333 12.02416667 43.265 45.7525 56.09444444 65.40388889 61.33361111 27.62944444 25.73916667 37.03555556 17.04472222 34.98055556 27.98611111 62.37472222 22.86555556 28.33611111 28.20083333 67.64194444 6.371666667 11.54611111 42.35388889 17.1825 27.75638889 36.80194444 88.165 5.848333333 58.23361111 6.291111111 8.726111111 12.97166667 36.58277778 25.48194444 67.98583333 51.25277778 22.18416667 35.67305556 27.1775 10.615 41.9725 75.68277778 47.915 30.01194444 91.14083333 69.60527778 97.51861111 43.89305556 27.46277778 23.73305556 63.67833333 97.67194444 23.39083333 33.45694444 90.16611111 36.40805556 56.74194444 45.98416667 39.36722222 32.23555556 69.4575 83.27083333 54.39944444 48.12777778 70.69111111 28.99694444 37.80111111 55.41 25.69416667 62.31388889 37.71694444 20.66888889 22.56666667 4.08 50.45361111 75.51555556 1.999722222 12.96111111 4.874166667 37.04666667 26.45194444 42.38916667 27.26277778 22.11638889 16.44277778 38.87277778 32.94777778 20.24444444 18.1875 27.67861111 19.99027778 21.46444444 13.69138889 37.53638889 30.12388889 24.92944444 12.30444444 21.56888889 50.42444444 37.2275 34.46222222 25.73055556 33.84666667 14.69861111 22.74222222 16.38361111 14.86527778 16.89222222 15.65972222 18.19166667 22.48583333 21.195 28.89194444 27.25111111 18.88583333 8.608055556 37.62722222 20.41777778 17.53416667 17.015 20.80944444 8.826111111 22.62138889 24.21833333 13.91388889 18.2625 15.73694444 43.99972222 12.90416667 20.45111111 10.66527778 25.5275 38.75722222 14.49 14.32416667 19.5975 23.57111111 28.48277778 24.07722222 23.80805556 9.628333333 41.82777778 27.66972222 5.374722222 27.60361111 23.95277778 8.565833333 8.807222222 24.94611111 17.24666667 11.15305556 7.676111111 21.38611111 10.40555556 15.04361111 13.85055556 23.42694444 17.82638889 16.495 33.14111111 21.30611111 28.72916667 19.54 12.05833333 29.12166667 17.28194444 19.25111111 14.75472222 5.49 24.07777778 23.3625 21.65138889 24.75361111 25.27916667 11.18 17.82972222 14.12694444 15.72583333 17.44222222 20.14861111 | |||||||||||||||||||||||||||||||||||||||||||||
| Dataseries Y: | |||||||||||||||||||||||||||||||||||||||||||||
1418 869 1530 2172 901 463 3201 371 1192 1583 1439 1764 1495 1373 2187 1491 4041 1706 2152 1036 1882 1929 2242 1220 1289 2515 2147 2352 1638 1222 1812 1677 1579 1731 807 2452 829 1940 2662 186 1499 865 1793 2527 2747 1324 2702 1383 1179 2099 4308 918 1831 3373 1713 1438 496 2253 744 1161 2352 2144 4691 1112 2694 1973 1769 3148 2474 2084 1954 1226 1389 1496 2269 1833 1268 1943 893 1762 1403 1425 1857 1840 1502 1441 1420 1416 2970 1317 1644 870 1654 1054 937 3004 2008 2547 1885 1626 1468 2445 1964 1381 1369 1659 2888 1290 2845 1982 1904 1391 602 1743 1559 2014 2143 2146 874 1590 1590 1210 2072 1281 1401 834 1105 1272 1944 391 761 1605 530 1988 1386 2395 387 1742 620 449 800 1684 1050 2699 1606 1502 1204 1138 568 1459 2158 1111 1421 2833 1955 2922 1002 1060 956 2186 3604 1035 1417 3261 1587 1424 1701 1249 946 1926 3352 1641 2035 2312 1369 1577 2201 961 1900 1254 1335 1597 207 1645 2429 151 474 141 1639 872 1318 1018 1383 1314 1335 1403 910 616 1407 771 766 473 1376 1232 1521 572 1059 1544 1230 1206 1205 1255 613 721 1109 740 1126 728 689 592 995 1613 2048 705 301 1803 799 861 1186 1451 628 1161 1463 742 979 675 1241 676 1049 620 1081 1688 736 617 812 1051 1656 705 945 554 1597 982 222 1212 1143 435 532 882 608 459 578 826 509 717 637 857 830 652 707 954 1461 672 778 1141 680 1090 616 285 1145 733 888 849 1182 528 642 947 819 757 894 | |||||||||||||||||||||||||||||||||||||||||||||
Tables (Output of Computation) | |||||||||||||||||||||||||||||||||||||||||||||
| |||||||||||||||||||||||||||||||||||||||||||||
Figures (Output of Computation) | |||||||||||||||||||||||||||||||||||||||||||||
Input Parameters & R Code | |||||||||||||||||||||||||||||||||||||||||||||
| Parameters (Session): | |||||||||||||||||||||||||||||||||||||||||||||
| par1 = 50 ; par2 = 50 ; par3 = 0 ; par4 = 0 ; par5 = 0 ; par6 = Y ; par7 = Y ; par8 = terrain.colors ; | |||||||||||||||||||||||||||||||||||||||||||||
| Parameters (R input): | |||||||||||||||||||||||||||||||||||||||||||||
| par1 = 50 ; par2 = 50 ; par3 = 0 ; par4 = 0 ; par5 = 0 ; par6 = Y ; par7 = Y ; par8 = terrain.colors ; | |||||||||||||||||||||||||||||||||||||||||||||
| R code (references can be found in the software module): | |||||||||||||||||||||||||||||||||||||||||||||
par1 <- as(par1,'numeric') | |||||||||||||||||||||||||||||||||||||||||||||