Free Statistics

of Irreproducible Research!

Author's title

Author*Unverified author*
R Software Module--
Title produced by softwareARIMA Backward Selection
Date of computationFri, 23 Dec 2011 07:01:24 -0500
Cite this page as followsStatistical Computations at FreeStatistics.org, Office for Research Development and Education, URL https://freestatistics.org/blog/index.php?v=date/2011/Dec/23/t1324641771sb31k04rzscmr2k.htm/, Retrieved Mon, 29 Apr 2024 18:37:37 +0000
Statistical Computations at FreeStatistics.org, Office for Research Development and Education, URL https://freestatistics.org/blog/index.php?pk=160324, Retrieved Mon, 29 Apr 2024 18:37:37 +0000
QR Codes:

Original text written by user:
IsPrivate?No (this computation is public)
User-defined keywords
Estimated Impact108
Family? (F = Feedback message, R = changed R code, M = changed R Module, P = changed Parameters, D = changed Data)
-     [ARIMA Forecasting] [] [2010-12-21 11:37:39] [a9671b130b33f9fcb98554992ce4582f]
- RMP   [ARIMA Backward Selection] [] [2010-12-21 11:51:15] [a9671b130b33f9fcb98554992ce4582f]
- R PD    [ARIMA Backward Selection] [] [2011-12-23 11:58:46] [a9671b130b33f9fcb98554992ce4582f]
-  M          [ARIMA Backward Selection] [] [2011-12-23 12:01:24] [d41d8cd98f00b204e9800998ecf8427e] [Current]
Feedback Forum

Post a new message
Dataseries X:
41
39
50
40
43
38
44
35
39
35
29
49
50
59
63
32
39
47
53
60
57
52
70
90
74
62
55
84
94
70
108
139
120
97
126
149
158
124
140
109
114
77
120
133
110
92
97
78
99
107
112
90
98
125
155
190
236
189
174
178
136
161
171
149
184
155
276
224
213
279
268
287
238
213
257
293
212
246
353
339
308
247
257
322
298
273
312
249
286
279
309
401
309
328
353
354
327
324
285
243
241
287
355
460
364
487
452
391
500
451
375
372
302
316
398
394
431
431


Summary of computational transaction
Raw Inputview raw input (R code)
Raw Outputview raw output of R engine
Computing time3 seconds
R Server'Gertrude Mary Cox' @ cox.wessa.net

\begin{tabular}{lllllllll}
\hline
Summary of computational transaction \tabularnewline
Raw Input & view raw input (R code)  \tabularnewline
Raw Output & view raw output of R engine  \tabularnewline
Computing time & 3 seconds \tabularnewline
R Server & 'Gertrude Mary Cox' @ cox.wessa.net \tabularnewline
\hline
\end{tabular}
%Source: https://freestatistics.org/blog/index.php?pk=160324&T=0

[TABLE]
[ROW][C]Summary of computational transaction[/C][/ROW]
[ROW][C]Raw Input[/C][C]view raw input (R code) [/C][/ROW]
[ROW][C]Raw Output[/C][C]view raw output of R engine [/C][/ROW]
[ROW][C]Computing time[/C][C]3 seconds[/C][/ROW]
[ROW][C]R Server[/C][C]'Gertrude Mary Cox' @ cox.wessa.net[/C][/ROW]
[/TABLE]
Source: https://freestatistics.org/blog/index.php?pk=160324&T=0

Globally Unique Identifier (entire table): ba.freestatistics.org/blog/index.php?pk=160324&T=0

As an alternative you can also use a QR Code:  

The GUIDs for individual cells are displayed in the table below:

Summary of computational transaction
Raw Inputview raw input (R code)
Raw Outputview raw output of R engine
Computing time3 seconds
R Server'Gertrude Mary Cox' @ cox.wessa.net


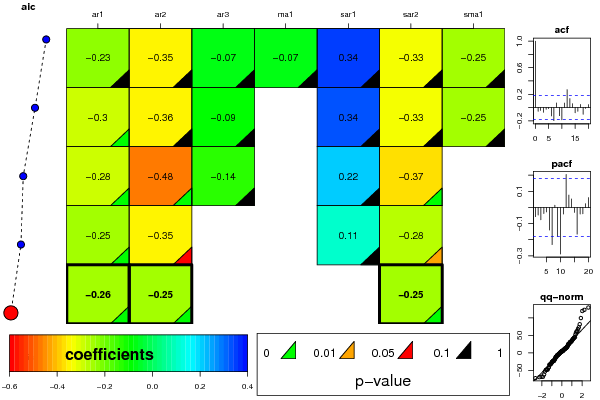
ARIMA Parameter Estimation and Backward Selection
Iterationar1ar2ar3ma1sar1sar2sma1
Estimates ( 1 )-0.2313-0.347-0.0736-0.06660.3441-0.328-0.2477
(p-val)(0.8084 )(0.3854 )(0.8326 )(0.9446 )(0.3326 )(0.1073 )(0.6986 )
Estimates ( 2 )-0.2972-0.355-0.094600.3388-0.3273-0.2541
(p-val)(0.0035 )(0.3244 )(0.5408 )(NA )(0.3138 )(0.1093 )(0.6782 )
Estimates ( 3 )-0.2831-0.4777-0.136600.216-0.37360
(p-val)(0.0025 )(0.001 )(0.1811 )(NA )(0.1247 )(0.001 )(NA )
Estimates ( 4 )-0.2464-0.345000.1068-0.27960
(p-val)(0.0092 )(0.0922 )(NA )(NA )(0.6128 )(0.0222 )(NA )
Estimates ( 5 )-0.2597-0.2494000-0.24770
(p-val)(0.0049 )(0.007 )(NA )(NA )(NA )(0.0095 )(NA )
Estimates ( 6 )NANANANANANANA
(p-val)(NA )(NA )(NA )(NA )(NA )(NA )(NA )
Estimates ( 7 )NANANANANANANA
(p-val)(NA )(NA )(NA )(NA )(NA )(NA )(NA )
Estimates ( 8 )NANANANANANANA
(p-val)(NA )(NA )(NA )(NA )(NA )(NA )(NA )
Estimates ( 9 )NANANANANANANA
(p-val)(NA )(NA )(NA )(NA )(NA )(NA )(NA )
Estimates ( 10 )NANANANANANANA
(p-val)(NA )(NA )(NA )(NA )(NA )(NA )(NA )
Estimates ( 11 )NANANANANANANA
(p-val)(NA )(NA )(NA )(NA )(NA )(NA )(NA )
Estimates ( 12 )NANANANANANANA
(p-val)(NA )(NA )(NA )(NA )(NA )(NA )(NA )
Estimates ( 13 )NANANANANANANA
(p-val)(NA )(NA )(NA )(NA )(NA )(NA )(NA )

\begin{tabular}{lllllllll}
\hline
ARIMA Parameter Estimation and Backward Selection \tabularnewline
Iteration & ar1 & ar2 & ar3 & ma1 & sar1 & sar2 & sma1 \tabularnewline
Estimates ( 1 ) & -0.2313 & -0.347 & -0.0736 & -0.0666 & 0.3441 & -0.328 & -0.2477 \tabularnewline
(p-val) & (0.8084 ) & (0.3854 ) & (0.8326 ) & (0.9446 ) & (0.3326 ) & (0.1073 ) & (0.6986 ) \tabularnewline
Estimates ( 2 ) & -0.2972 & -0.355 & -0.0946 & 0 & 0.3388 & -0.3273 & -0.2541 \tabularnewline
(p-val) & (0.0035 ) & (0.3244 ) & (0.5408 ) & (NA ) & (0.3138 ) & (0.1093 ) & (0.6782 ) \tabularnewline
Estimates ( 3 ) & -0.2831 & -0.4777 & -0.1366 & 0 & 0.216 & -0.3736 & 0 \tabularnewline
(p-val) & (0.0025 ) & (0.001 ) & (0.1811 ) & (NA ) & (0.1247 ) & (0.001 ) & (NA ) \tabularnewline
Estimates ( 4 ) & -0.2464 & -0.345 & 0 & 0 & 0.1068 & -0.2796 & 0 \tabularnewline
(p-val) & (0.0092 ) & (0.0922 ) & (NA ) & (NA ) & (0.6128 ) & (0.0222 ) & (NA ) \tabularnewline
Estimates ( 5 ) & -0.2597 & -0.2494 & 0 & 0 & 0 & -0.2477 & 0 \tabularnewline
(p-val) & (0.0049 ) & (0.007 ) & (NA ) & (NA ) & (NA ) & (0.0095 ) & (NA ) \tabularnewline
Estimates ( 6 ) & NA & NA & NA & NA & NA & NA & NA \tabularnewline
(p-val) & (NA ) & (NA ) & (NA ) & (NA ) & (NA ) & (NA ) & (NA ) \tabularnewline
Estimates ( 7 ) & NA & NA & NA & NA & NA & NA & NA \tabularnewline
(p-val) & (NA ) & (NA ) & (NA ) & (NA ) & (NA ) & (NA ) & (NA ) \tabularnewline
Estimates ( 8 ) & NA & NA & NA & NA & NA & NA & NA \tabularnewline
(p-val) & (NA ) & (NA ) & (NA ) & (NA ) & (NA ) & (NA ) & (NA ) \tabularnewline
Estimates ( 9 ) & NA & NA & NA & NA & NA & NA & NA \tabularnewline
(p-val) & (NA ) & (NA ) & (NA ) & (NA ) & (NA ) & (NA ) & (NA ) \tabularnewline
Estimates ( 10 ) & NA & NA & NA & NA & NA & NA & NA \tabularnewline
(p-val) & (NA ) & (NA ) & (NA ) & (NA ) & (NA ) & (NA ) & (NA ) \tabularnewline
Estimates ( 11 ) & NA & NA & NA & NA & NA & NA & NA \tabularnewline
(p-val) & (NA ) & (NA ) & (NA ) & (NA ) & (NA ) & (NA ) & (NA ) \tabularnewline
Estimates ( 12 ) & NA & NA & NA & NA & NA & NA & NA \tabularnewline
(p-val) & (NA ) & (NA ) & (NA ) & (NA ) & (NA ) & (NA ) & (NA ) \tabularnewline
Estimates ( 13 ) & NA & NA & NA & NA & NA & NA & NA \tabularnewline
(p-val) & (NA ) & (NA ) & (NA ) & (NA ) & (NA ) & (NA ) & (NA ) \tabularnewline
\hline
\end{tabular}
%Source: https://freestatistics.org/blog/index.php?pk=160324&T=1

[TABLE]
[ROW][C]ARIMA Parameter Estimation and Backward Selection[/C][/ROW]
[ROW][C]Iteration[/C][C]ar1[/C][C]ar2[/C][C]ar3[/C][C]ma1[/C][C]sar1[/C][C]sar2[/C][C]sma1[/C][/ROW]
[ROW][C]Estimates ( 1 )[/C][C]-0.2313[/C][C]-0.347[/C][C]-0.0736[/C][C]-0.0666[/C][C]0.3441[/C][C]-0.328[/C][C]-0.2477[/C][/ROW]
[ROW][C](p-val)[/C][C](0.8084 )[/C][C](0.3854 )[/C][C](0.8326 )[/C][C](0.9446 )[/C][C](0.3326 )[/C][C](0.1073 )[/C][C](0.6986 )[/C][/ROW]
[ROW][C]Estimates ( 2 )[/C][C]-0.2972[/C][C]-0.355[/C][C]-0.0946[/C][C]0[/C][C]0.3388[/C][C]-0.3273[/C][C]-0.2541[/C][/ROW]
[ROW][C](p-val)[/C][C](0.0035 )[/C][C](0.3244 )[/C][C](0.5408 )[/C][C](NA )[/C][C](0.3138 )[/C][C](0.1093 )[/C][C](0.6782 )[/C][/ROW]
[ROW][C]Estimates ( 3 )[/C][C]-0.2831[/C][C]-0.4777[/C][C]-0.1366[/C][C]0[/C][C]0.216[/C][C]-0.3736[/C][C]0[/C][/ROW]
[ROW][C](p-val)[/C][C](0.0025 )[/C][C](0.001 )[/C][C](0.1811 )[/C][C](NA )[/C][C](0.1247 )[/C][C](0.001 )[/C][C](NA )[/C][/ROW]
[ROW][C]Estimates ( 4 )[/C][C]-0.2464[/C][C]-0.345[/C][C]0[/C][C]0[/C][C]0.1068[/C][C]-0.2796[/C][C]0[/C][/ROW]
[ROW][C](p-val)[/C][C](0.0092 )[/C][C](0.0922 )[/C][C](NA )[/C][C](NA )[/C][C](0.6128 )[/C][C](0.0222 )[/C][C](NA )[/C][/ROW]
[ROW][C]Estimates ( 5 )[/C][C]-0.2597[/C][C]-0.2494[/C][C]0[/C][C]0[/C][C]0[/C][C]-0.2477[/C][C]0[/C][/ROW]
[ROW][C](p-val)[/C][C](0.0049 )[/C][C](0.007 )[/C][C](NA )[/C][C](NA )[/C][C](NA )[/C][C](0.0095 )[/C][C](NA )[/C][/ROW]
[ROW][C]Estimates ( 6 )[/C][C]NA[/C][C]NA[/C][C]NA[/C][C]NA[/C][C]NA[/C][C]NA[/C][C]NA[/C][/ROW]
[ROW][C](p-val)[/C][C](NA )[/C][C](NA )[/C][C](NA )[/C][C](NA )[/C][C](NA )[/C][C](NA )[/C][C](NA )[/C][/ROW]
[ROW][C]Estimates ( 7 )[/C][C]NA[/C][C]NA[/C][C]NA[/C][C]NA[/C][C]NA[/C][C]NA[/C][C]NA[/C][/ROW]
[ROW][C](p-val)[/C][C](NA )[/C][C](NA )[/C][C](NA )[/C][C](NA )[/C][C](NA )[/C][C](NA )[/C][C](NA )[/C][/ROW]
[ROW][C]Estimates ( 8 )[/C][C]NA[/C][C]NA[/C][C]NA[/C][C]NA[/C][C]NA[/C][C]NA[/C][C]NA[/C][/ROW]
[ROW][C](p-val)[/C][C](NA )[/C][C](NA )[/C][C](NA )[/C][C](NA )[/C][C](NA )[/C][C](NA )[/C][C](NA )[/C][/ROW]
[ROW][C]Estimates ( 9 )[/C][C]NA[/C][C]NA[/C][C]NA[/C][C]NA[/C][C]NA[/C][C]NA[/C][C]NA[/C][/ROW]
[ROW][C](p-val)[/C][C](NA )[/C][C](NA )[/C][C](NA )[/C][C](NA )[/C][C](NA )[/C][C](NA )[/C][C](NA )[/C][/ROW]
[ROW][C]Estimates ( 10 )[/C][C]NA[/C][C]NA[/C][C]NA[/C][C]NA[/C][C]NA[/C][C]NA[/C][C]NA[/C][/ROW]
[ROW][C](p-val)[/C][C](NA )[/C][C](NA )[/C][C](NA )[/C][C](NA )[/C][C](NA )[/C][C](NA )[/C][C](NA )[/C][/ROW]
[ROW][C]Estimates ( 11 )[/C][C]NA[/C][C]NA[/C][C]NA[/C][C]NA[/C][C]NA[/C][C]NA[/C][C]NA[/C][/ROW]
[ROW][C](p-val)[/C][C](NA )[/C][C](NA )[/C][C](NA )[/C][C](NA )[/C][C](NA )[/C][C](NA )[/C][C](NA )[/C][/ROW]
[ROW][C]Estimates ( 12 )[/C][C]NA[/C][C]NA[/C][C]NA[/C][C]NA[/C][C]NA[/C][C]NA[/C][C]NA[/C][/ROW]
[ROW][C](p-val)[/C][C](NA )[/C][C](NA )[/C][C](NA )[/C][C](NA )[/C][C](NA )[/C][C](NA )[/C][C](NA )[/C][/ROW]
[ROW][C]Estimates ( 13 )[/C][C]NA[/C][C]NA[/C][C]NA[/C][C]NA[/C][C]NA[/C][C]NA[/C][C]NA[/C][/ROW]
[ROW][C](p-val)[/C][C](NA )[/C][C](NA )[/C][C](NA )[/C][C](NA )[/C][C](NA )[/C][C](NA )[/C][C](NA )[/C][/ROW]
[/TABLE]
Source: https://freestatistics.org/blog/index.php?pk=160324&T=1

Globally Unique Identifier (entire table): ba.freestatistics.org/blog/index.php?pk=160324&T=1

As an alternative you can also use a QR Code:  

The GUIDs for individual cells are displayed in the table below:

ARIMA Parameter Estimation and Backward Selection
Iterationar1ar2ar3ma1sar1sar2sma1
Estimates ( 1 )-0.2313-0.347-0.0736-0.06660.3441-0.328-0.2477
(p-val)(0.8084 )(0.3854 )(0.8326 )(0.9446 )(0.3326 )(0.1073 )(0.6986 )
Estimates ( 2 )-0.2972-0.355-0.094600.3388-0.3273-0.2541
(p-val)(0.0035 )(0.3244 )(0.5408 )(NA )(0.3138 )(0.1093 )(0.6782 )
Estimates ( 3 )-0.2831-0.4777-0.136600.216-0.37360
(p-val)(0.0025 )(0.001 )(0.1811 )(NA )(0.1247 )(0.001 )(NA )
Estimates ( 4 )-0.2464-0.345000.1068-0.27960
(p-val)(0.0092 )(0.0922 )(NA )(NA )(0.6128 )(0.0222 )(NA )
Estimates ( 5 )-0.2597-0.2494000-0.24770
(p-val)(0.0049 )(0.007 )(NA )(NA )(NA )(0.0095 )(NA )
Estimates ( 6 )NANANANANANANA
(p-val)(NA )(NA )(NA )(NA )(NA )(NA )(NA )
Estimates ( 7 )NANANANANANANA
(p-val)(NA )(NA )(NA )(NA )(NA )(NA )(NA )
Estimates ( 8 )NANANANANANANA
(p-val)(NA )(NA )(NA )(NA )(NA )(NA )(NA )
Estimates ( 9 )NANANANANANANA
(p-val)(NA )(NA )(NA )(NA )(NA )(NA )(NA )
Estimates ( 10 )NANANANANANANA
(p-val)(NA )(NA )(NA )(NA )(NA )(NA )(NA )
Estimates ( 11 )NANANANANANANA
(p-val)(NA )(NA )(NA )(NA )(NA )(NA )(NA )
Estimates ( 12 )NANANANANANANA
(p-val)(NA )(NA )(NA )(NA )(NA )(NA )(NA )
Estimates ( 13 )NANANANANANANA
(p-val)(NA )(NA )(NA )(NA )(NA )(NA )(NA )


Estimated ARIMA Residuals
Value
0.0409999759903108
-1.84803909027358
10.004087092026
-7.2174082490112
2.5753703272948
-7.24127517228103
7.99228882642593
-10.6547021576231
4.44423556915699
-7.28852119829039
-4.39417463961616
15.2095297836171
5.53325561657705
12.605608571878
4.58328829156507
-23.840419261773
1.12008374089731
6.41674469638944
12.1419805934742
3.81833867155485
-0.106602248902619
-4.79556263439359
18.5521806300939
26.2070359909073
-6.31937185547873
-12.3957295913273
-10.5590069269629
30.4501113399938
15.0231558696898
-16.5284859009414
29.636783932811
39.7815660106246
2.07320943334151
-23.6347339554178
26.527136652466
32.9932300392109
23.370485411516
-30.9673802992079
12.784832864115
-30.0328787196699
8.63582365005445
-48.9900382880006
38.300870706442
4.94388471112511
-7.95674533912919
-33.3292836659205
3.1154547121857
-18.9029296844461
17.4439469305302
3.81556363118118
10.2292077765985
-25.4191124870065
7.83187258137289
25.1536783978063
42.9281114104004
44.3894132290889
61.9696961832745
-23.1332960788709
-6.62625591290987
1.06424707512276
-26.8792608136651
11.1351918257335
3.60607267753848
-17.0713765119988
19.936762717552
-22.3197078690384
122.870633789513
-32.2578672617095
13.7259723064021
40.9656538428375
34.7617900412196
25.2183889820323
-43.2552203417203
-22.0085542575177
26.4811106849718
52.3956151974227
-72.6369119066732
13.8508575527121
99.3632485936539
31.9536239485868
-22.7893491184055
-68.6415881110787
8.4565746117545
60.9984553800858
-2.16506581662816
-33.9844635404995
20.6467960903082
-48.132408035143
31.0438471695902
-15.3716639963288
44.1784141688086
81.7310244914343
-53.5961624975491
12.2347861773811
15.711511642503
37.8325657262366
-34.3992015343962
-2.9215894882049
-47.6960104444577
-47.81536234723
-25.6350907780624
34.0346175683187
67.6828165794863
119.594274781832
-62.2798714721286
129.552594642497
-10.8458825164176
-3.17959463455117
72.8840479367327
-2.38073245157315
-69.7827273384837
-41.6208248602366
-68.6751803542207
-12.2334868904207
57.5403087213905
10.6894451885646
30.6509905490517
4.29280102032888

\begin{tabular}{lllllllll}
\hline
Estimated ARIMA Residuals \tabularnewline
Value \tabularnewline
0.0409999759903108 \tabularnewline
-1.84803909027358 \tabularnewline
10.004087092026 \tabularnewline
-7.2174082490112 \tabularnewline
2.5753703272948 \tabularnewline
-7.24127517228103 \tabularnewline
7.99228882642593 \tabularnewline
-10.6547021576231 \tabularnewline
4.44423556915699 \tabularnewline
-7.28852119829039 \tabularnewline
-4.39417463961616 \tabularnewline
15.2095297836171 \tabularnewline
5.53325561657705 \tabularnewline
12.605608571878 \tabularnewline
4.58328829156507 \tabularnewline
-23.840419261773 \tabularnewline
1.12008374089731 \tabularnewline
6.41674469638944 \tabularnewline
12.1419805934742 \tabularnewline
3.81833867155485 \tabularnewline
-0.106602248902619 \tabularnewline
-4.79556263439359 \tabularnewline
18.5521806300939 \tabularnewline
26.2070359909073 \tabularnewline
-6.31937185547873 \tabularnewline
-12.3957295913273 \tabularnewline
-10.5590069269629 \tabularnewline
30.4501113399938 \tabularnewline
15.0231558696898 \tabularnewline
-16.5284859009414 \tabularnewline
29.636783932811 \tabularnewline
39.7815660106246 \tabularnewline
2.07320943334151 \tabularnewline
-23.6347339554178 \tabularnewline
26.527136652466 \tabularnewline
32.9932300392109 \tabularnewline
23.370485411516 \tabularnewline
-30.9673802992079 \tabularnewline
12.784832864115 \tabularnewline
-30.0328787196699 \tabularnewline
8.63582365005445 \tabularnewline
-48.9900382880006 \tabularnewline
38.300870706442 \tabularnewline
4.94388471112511 \tabularnewline
-7.95674533912919 \tabularnewline
-33.3292836659205 \tabularnewline
3.1154547121857 \tabularnewline
-18.9029296844461 \tabularnewline
17.4439469305302 \tabularnewline
3.81556363118118 \tabularnewline
10.2292077765985 \tabularnewline
-25.4191124870065 \tabularnewline
7.83187258137289 \tabularnewline
25.1536783978063 \tabularnewline
42.9281114104004 \tabularnewline
44.3894132290889 \tabularnewline
61.9696961832745 \tabularnewline
-23.1332960788709 \tabularnewline
-6.62625591290987 \tabularnewline
1.06424707512276 \tabularnewline
-26.8792608136651 \tabularnewline
11.1351918257335 \tabularnewline
3.60607267753848 \tabularnewline
-17.0713765119988 \tabularnewline
19.936762717552 \tabularnewline
-22.3197078690384 \tabularnewline
122.870633789513 \tabularnewline
-32.2578672617095 \tabularnewline
13.7259723064021 \tabularnewline
40.9656538428375 \tabularnewline
34.7617900412196 \tabularnewline
25.2183889820323 \tabularnewline
-43.2552203417203 \tabularnewline
-22.0085542575177 \tabularnewline
26.4811106849718 \tabularnewline
52.3956151974227 \tabularnewline
-72.6369119066732 \tabularnewline
13.8508575527121 \tabularnewline
99.3632485936539 \tabularnewline
31.9536239485868 \tabularnewline
-22.7893491184055 \tabularnewline
-68.6415881110787 \tabularnewline
8.4565746117545 \tabularnewline
60.9984553800858 \tabularnewline
-2.16506581662816 \tabularnewline
-33.9844635404995 \tabularnewline
20.6467960903082 \tabularnewline
-48.132408035143 \tabularnewline
31.0438471695902 \tabularnewline
-15.3716639963288 \tabularnewline
44.1784141688086 \tabularnewline
81.7310244914343 \tabularnewline
-53.5961624975491 \tabularnewline
12.2347861773811 \tabularnewline
15.711511642503 \tabularnewline
37.8325657262366 \tabularnewline
-34.3992015343962 \tabularnewline
-2.9215894882049 \tabularnewline
-47.6960104444577 \tabularnewline
-47.81536234723 \tabularnewline
-25.6350907780624 \tabularnewline
34.0346175683187 \tabularnewline
67.6828165794863 \tabularnewline
119.594274781832 \tabularnewline
-62.2798714721286 \tabularnewline
129.552594642497 \tabularnewline
-10.8458825164176 \tabularnewline
-3.17959463455117 \tabularnewline
72.8840479367327 \tabularnewline
-2.38073245157315 \tabularnewline
-69.7827273384837 \tabularnewline
-41.6208248602366 \tabularnewline
-68.6751803542207 \tabularnewline
-12.2334868904207 \tabularnewline
57.5403087213905 \tabularnewline
10.6894451885646 \tabularnewline
30.6509905490517 \tabularnewline
4.29280102032888 \tabularnewline
\hline
\end{tabular}
%Source: https://freestatistics.org/blog/index.php?pk=160324&T=2

[TABLE]
[ROW][C]Estimated ARIMA Residuals[/C][/ROW]
[ROW][C]Value[/C][/ROW]
[ROW][C]0.0409999759903108[/C][/ROW]
[ROW][C]-1.84803909027358[/C][/ROW]
[ROW][C]10.004087092026[/C][/ROW]
[ROW][C]-7.2174082490112[/C][/ROW]
[ROW][C]2.5753703272948[/C][/ROW]
[ROW][C]-7.24127517228103[/C][/ROW]
[ROW][C]7.99228882642593[/C][/ROW]
[ROW][C]-10.6547021576231[/C][/ROW]
[ROW][C]4.44423556915699[/C][/ROW]
[ROW][C]-7.28852119829039[/C][/ROW]
[ROW][C]-4.39417463961616[/C][/ROW]
[ROW][C]15.2095297836171[/C][/ROW]
[ROW][C]5.53325561657705[/C][/ROW]
[ROW][C]12.605608571878[/C][/ROW]
[ROW][C]4.58328829156507[/C][/ROW]
[ROW][C]-23.840419261773[/C][/ROW]
[ROW][C]1.12008374089731[/C][/ROW]
[ROW][C]6.41674469638944[/C][/ROW]
[ROW][C]12.1419805934742[/C][/ROW]
[ROW][C]3.81833867155485[/C][/ROW]
[ROW][C]-0.106602248902619[/C][/ROW]
[ROW][C]-4.79556263439359[/C][/ROW]
[ROW][C]18.5521806300939[/C][/ROW]
[ROW][C]26.2070359909073[/C][/ROW]
[ROW][C]-6.31937185547873[/C][/ROW]
[ROW][C]-12.3957295913273[/C][/ROW]
[ROW][C]-10.5590069269629[/C][/ROW]
[ROW][C]30.4501113399938[/C][/ROW]
[ROW][C]15.0231558696898[/C][/ROW]
[ROW][C]-16.5284859009414[/C][/ROW]
[ROW][C]29.636783932811[/C][/ROW]
[ROW][C]39.7815660106246[/C][/ROW]
[ROW][C]2.07320943334151[/C][/ROW]
[ROW][C]-23.6347339554178[/C][/ROW]
[ROW][C]26.527136652466[/C][/ROW]
[ROW][C]32.9932300392109[/C][/ROW]
[ROW][C]23.370485411516[/C][/ROW]
[ROW][C]-30.9673802992079[/C][/ROW]
[ROW][C]12.784832864115[/C][/ROW]
[ROW][C]-30.0328787196699[/C][/ROW]
[ROW][C]8.63582365005445[/C][/ROW]
[ROW][C]-48.9900382880006[/C][/ROW]
[ROW][C]38.300870706442[/C][/ROW]
[ROW][C]4.94388471112511[/C][/ROW]
[ROW][C]-7.95674533912919[/C][/ROW]
[ROW][C]-33.3292836659205[/C][/ROW]
[ROW][C]3.1154547121857[/C][/ROW]
[ROW][C]-18.9029296844461[/C][/ROW]
[ROW][C]17.4439469305302[/C][/ROW]
[ROW][C]3.81556363118118[/C][/ROW]
[ROW][C]10.2292077765985[/C][/ROW]
[ROW][C]-25.4191124870065[/C][/ROW]
[ROW][C]7.83187258137289[/C][/ROW]
[ROW][C]25.1536783978063[/C][/ROW]
[ROW][C]42.9281114104004[/C][/ROW]
[ROW][C]44.3894132290889[/C][/ROW]
[ROW][C]61.9696961832745[/C][/ROW]
[ROW][C]-23.1332960788709[/C][/ROW]
[ROW][C]-6.62625591290987[/C][/ROW]
[ROW][C]1.06424707512276[/C][/ROW]
[ROW][C]-26.8792608136651[/C][/ROW]
[ROW][C]11.1351918257335[/C][/ROW]
[ROW][C]3.60607267753848[/C][/ROW]
[ROW][C]-17.0713765119988[/C][/ROW]
[ROW][C]19.936762717552[/C][/ROW]
[ROW][C]-22.3197078690384[/C][/ROW]
[ROW][C]122.870633789513[/C][/ROW]
[ROW][C]-32.2578672617095[/C][/ROW]
[ROW][C]13.7259723064021[/C][/ROW]
[ROW][C]40.9656538428375[/C][/ROW]
[ROW][C]34.7617900412196[/C][/ROW]
[ROW][C]25.2183889820323[/C][/ROW]
[ROW][C]-43.2552203417203[/C][/ROW]
[ROW][C]-22.0085542575177[/C][/ROW]
[ROW][C]26.4811106849718[/C][/ROW]
[ROW][C]52.3956151974227[/C][/ROW]
[ROW][C]-72.6369119066732[/C][/ROW]
[ROW][C]13.8508575527121[/C][/ROW]
[ROW][C]99.3632485936539[/C][/ROW]
[ROW][C]31.9536239485868[/C][/ROW]
[ROW][C]-22.7893491184055[/C][/ROW]
[ROW][C]-68.6415881110787[/C][/ROW]
[ROW][C]8.4565746117545[/C][/ROW]
[ROW][C]60.9984553800858[/C][/ROW]
[ROW][C]-2.16506581662816[/C][/ROW]
[ROW][C]-33.9844635404995[/C][/ROW]
[ROW][C]20.6467960903082[/C][/ROW]
[ROW][C]-48.132408035143[/C][/ROW]
[ROW][C]31.0438471695902[/C][/ROW]
[ROW][C]-15.3716639963288[/C][/ROW]
[ROW][C]44.1784141688086[/C][/ROW]
[ROW][C]81.7310244914343[/C][/ROW]
[ROW][C]-53.5961624975491[/C][/ROW]
[ROW][C]12.2347861773811[/C][/ROW]
[ROW][C]15.711511642503[/C][/ROW]
[ROW][C]37.8325657262366[/C][/ROW]
[ROW][C]-34.3992015343962[/C][/ROW]
[ROW][C]-2.9215894882049[/C][/ROW]
[ROW][C]-47.6960104444577[/C][/ROW]
[ROW][C]-47.81536234723[/C][/ROW]
[ROW][C]-25.6350907780624[/C][/ROW]
[ROW][C]34.0346175683187[/C][/ROW]
[ROW][C]67.6828165794863[/C][/ROW]
[ROW][C]119.594274781832[/C][/ROW]
[ROW][C]-62.2798714721286[/C][/ROW]
[ROW][C]129.552594642497[/C][/ROW]
[ROW][C]-10.8458825164176[/C][/ROW]
[ROW][C]-3.17959463455117[/C][/ROW]
[ROW][C]72.8840479367327[/C][/ROW]
[ROW][C]-2.38073245157315[/C][/ROW]
[ROW][C]-69.7827273384837[/C][/ROW]
[ROW][C]-41.6208248602366[/C][/ROW]
[ROW][C]-68.6751803542207[/C][/ROW]
[ROW][C]-12.2334868904207[/C][/ROW]
[ROW][C]57.5403087213905[/C][/ROW]
[ROW][C]10.6894451885646[/C][/ROW]
[ROW][C]30.6509905490517[/C][/ROW]
[ROW][C]4.29280102032888[/C][/ROW]
[/TABLE]
Source: https://freestatistics.org/blog/index.php?pk=160324&T=2

Globally Unique Identifier (entire table): ba.freestatistics.org/blog/index.php?pk=160324&T=2

As an alternative you can also use a QR Code:  

The GUIDs for individual cells are displayed in the table below:

Estimated ARIMA Residuals
Value
0.0409999759903108
-1.84803909027358
10.004087092026
-7.2174082490112
2.5753703272948
-7.24127517228103
7.99228882642593
-10.6547021576231
4.44423556915699
-7.28852119829039
-4.39417463961616
15.2095297836171
5.53325561657705
12.605608571878
4.58328829156507
-23.840419261773
1.12008374089731
6.41674469638944
12.1419805934742
3.81833867155485
-0.106602248902619
-4.79556263439359
18.5521806300939
26.2070359909073
-6.31937185547873
-12.3957295913273
-10.5590069269629
30.4501113399938
15.0231558696898
-16.5284859009414
29.636783932811
39.7815660106246
2.07320943334151
-23.6347339554178
26.527136652466
32.9932300392109
23.370485411516
-30.9673802992079
12.784832864115
-30.0328787196699
8.63582365005445
-48.9900382880006
38.300870706442
4.94388471112511
-7.95674533912919
-33.3292836659205
3.1154547121857
-18.9029296844461
17.4439469305302
3.81556363118118
10.2292077765985
-25.4191124870065
7.83187258137289
25.1536783978063
42.9281114104004
44.3894132290889
61.9696961832745
-23.1332960788709
-6.62625591290987
1.06424707512276
-26.8792608136651
11.1351918257335
3.60607267753848
-17.0713765119988
19.936762717552
-22.3197078690384
122.870633789513
-32.2578672617095
13.7259723064021
40.9656538428375
34.7617900412196
25.2183889820323
-43.2552203417203
-22.0085542575177
26.4811106849718
52.3956151974227
-72.6369119066732
13.8508575527121
99.3632485936539
31.9536239485868
-22.7893491184055
-68.6415881110787
8.4565746117545
60.9984553800858
-2.16506581662816
-33.9844635404995
20.6467960903082
-48.132408035143
31.0438471695902
-15.3716639963288
44.1784141688086
81.7310244914343
-53.5961624975491
12.2347861773811
15.711511642503
37.8325657262366
-34.3992015343962
-2.9215894882049
-47.6960104444577
-47.81536234723
-25.6350907780624
34.0346175683187
67.6828165794863
119.594274781832
-62.2798714721286
129.552594642497
-10.8458825164176
-3.17959463455117
72.8840479367327
-2.38073245157315
-69.7827273384837
-41.6208248602366
-68.6751803542207
-12.2334868904207
57.5403087213905
10.6894451885646
30.6509905490517
4.29280102032888


Parameters (Session):
par1 = FALSE ; par2 = 1 ; par3 = 1 ; par4 = 0 ; par5 = 2 ; par6 = 3 ; par7 = 1 ; par8 = 2 ; par9 = 1 ;
Parameters (R input):
par1 = FALSE ; par2 = 1 ; par3 = 1 ; par4 = 0 ; par5 = 2 ; par6 = 3 ; par7 = 1 ; par8 = 2 ; par9 = 1 ; par10 = ; par11 = ; par12 = ; par13 = ; par14 = ; par15 = ; par16 = ; par17 = ; par18 = ; par19 = ; par20 = ;
R code (references can be found in the software module):
library(lattice)
if (par1 == 'TRUE') par1 <- TRUE
if (par1 == 'FALSE') par1 <- FALSE
par2 <- as.numeric(par2) #Box-Cox lambda transformation parameter
par3 <- as.numeric(par3) #degree of non-seasonal differencing
par4 <- as.numeric(par4) #degree of seasonal differencing
par5 <- as.numeric(par5) #seasonal period
par6 <- as.numeric(par6) #degree (p) of the non-seasonal AR(p) polynomial
par7 <- as.numeric(par7) #degree (q) of the non-seasonal MA(q) polynomial
par8 <- as.numeric(par8) #degree (P) of the seasonal AR(P) polynomial
par9 <- as.numeric(par9) #degree (Q) of the seasonal MA(Q) polynomial
armaGR <- function(arima.out, names, n){
try1 <- arima.out$coef
try2 <- sqrt(diag(arima.out$var.coef))
try.data.frame <- data.frame(matrix(NA,ncol=4,nrow=length(names)))
dimnames(try.data.frame) <- list(names,c('coef','std','tstat','pv'))
try.data.frame[,1] <- try1
for(i in 1:length(try2)) try.data.frame[which(rownames(try.data.frame)==names(try2)[i]),2] <- try2[i]
try.data.frame[,3] <- try.data.frame[,1] / try.data.frame[,2]
try.data.frame[,4] <- round((1-pt(abs(try.data.frame[,3]),df=n-(length(try2)+1)))*2,5)
vector <- rep(NA,length(names))
vector[is.na(try.data.frame[,4])] <- 0
maxi <- which.max(try.data.frame[,4])
continue <- max(try.data.frame[,4],na.rm=TRUE) > .05
vector[maxi] <- 0
list(summary=try.data.frame,next.vector=vector,continue=continue)
}
arimaSelect <- function(series, order=c(13,0,0), seasonal=list(order=c(2,0,0),period=12), include.mean=F){
nrc <- order[1]+order[3]+seasonal$order[1]+seasonal$order[3]
coeff <- matrix(NA, nrow=nrc*2, ncol=nrc)
pval <- matrix(NA, nrow=nrc*2, ncol=nrc)
mylist <- rep(list(NULL), nrc)
names <- NULL
if(order[1] > 0) names <- paste('ar',1:order[1],sep='')
if(order[3] > 0) names <- c( names , paste('ma',1:order[3],sep='') )
if(seasonal$order[1] > 0) names <- c(names, paste('sar',1:seasonal$order[1],sep=''))
if(seasonal$order[3] > 0) names <- c(names, paste('sma',1:seasonal$order[3],sep=''))
arima.out <- arima(series, order=order, seasonal=seasonal, include.mean=include.mean, method='ML')
mylist[[1]] <- arima.out
last.arma <- armaGR(arima.out, names, length(series))
mystop <- FALSE
i <- 1
coeff[i,] <- last.arma[[1]][,1]
pval [i,] <- last.arma[[1]][,4]
i <- 2
aic <- arima.out$aic
while(!mystop){
mylist[[i]] <- arima.out
arima.out <- arima(series, order=order, seasonal=seasonal, include.mean=include.mean, method='ML', fixed=last.arma$next.vector)
aic <- c(aic, arima.out$aic)
last.arma <- armaGR(arima.out, names, length(series))
mystop <- !last.arma$continue
coeff[i,] <- last.arma[[1]][,1]
pval [i,] <- last.arma[[1]][,4]
i <- i+1
}
list(coeff, pval, mylist, aic=aic)
}
arimaSelectplot <- function(arimaSelect.out,noms,choix){
noms <- names(arimaSelect.out[[3]][[1]]$coef)
coeff <- arimaSelect.out[[1]]
k <- min(which(is.na(coeff[,1])))-1
coeff <- coeff[1:k,]
pval <- arimaSelect.out[[2]][1:k,]
aic <- arimaSelect.out$aic[1:k]
coeff[coeff==0] <- NA
n <- ncol(coeff)
if(missing(choix)) choix <- k
layout(matrix(c(1,1,1,2,
3,3,3,2,
3,3,3,4,
5,6,7,7),nr=4),
widths=c(10,35,45,15),
heights=c(30,30,15,15))
couleurs <- rainbow(75)[1:50]#(50)
ticks <- pretty(coeff)
par(mar=c(1,1,3,1))
plot(aic,k:1-.5,type='o',pch=21,bg='blue',cex=2,axes=F,lty=2,xpd=NA)
points(aic[choix],k-choix+.5,pch=21,cex=4,bg=2,xpd=NA)
title('aic',line=2)
par(mar=c(3,0,0,0))
plot(0,axes=F,xlab='',ylab='',xlim=range(ticks),ylim=c(.1,1))
rect(xleft = min(ticks) + (0:49)/50*(max(ticks)-min(ticks)),
xright = min(ticks) + (1:50)/50*(max(ticks)-min(ticks)),
ytop = rep(1,50),
ybottom= rep(0,50),col=couleurs,border=NA)
axis(1,ticks)
rect(xleft=min(ticks),xright=max(ticks),ytop=1,ybottom=0)
text(mean(coeff,na.rm=T),.5,'coefficients',cex=2,font=2)
par(mar=c(1,1,3,1))
image(1:n,1:k,t(coeff[k:1,]),axes=F,col=couleurs,zlim=range(ticks))
for(i in 1:n) for(j in 1:k) if(!is.na(coeff[j,i])) {
if(pval[j,i]<.01) symb = 'green'
else if( (pval[j,i]<.05) & (pval[j,i]>=.01)) symb = 'orange'
else if( (pval[j,i]<.1) & (pval[j,i]>=.05)) symb = 'red'
else symb = 'black'
polygon(c(i+.5 ,i+.2 ,i+.5 ,i+.5),
c(k-j+0.5,k-j+0.5,k-j+0.8,k-j+0.5),
col=symb)
if(j==choix) {
rect(xleft=i-.5,
xright=i+.5,
ybottom=k-j+1.5,
ytop=k-j+.5,
lwd=4)
text(i,
k-j+1,
round(coeff[j,i],2),
cex=1.2,
font=2)
}
else{
rect(xleft=i-.5,xright=i+.5,ybottom=k-j+1.5,ytop=k-j+.5)
text(i,k-j+1,round(coeff[j,i],2),cex=1.2,font=1)
}
}
axis(3,1:n,noms)
par(mar=c(0.5,0,0,0.5))
plot(0,axes=F,xlab='',ylab='',type='n',xlim=c(0,8),ylim=c(-.2,.8))
cols <- c('green','orange','red','black')
niv <- c('0','0.01','0.05','0.1')
for(i in 0:3){
polygon(c(1+2*i ,1+2*i ,1+2*i-.5 ,1+2*i),
c(.4 ,.7 , .4 , .4),
col=cols[i+1])
text(2*i,0.5,niv[i+1],cex=1.5)
}
text(8,.5,1,cex=1.5)
text(4,0,'p-value',cex=2)
box()
residus <- arimaSelect.out[[3]][[choix]]$res
par(mar=c(1,2,4,1))
acf(residus,main='')
title('acf',line=.5)
par(mar=c(1,2,4,1))
pacf(residus,main='')
title('pacf',line=.5)
par(mar=c(2,2,4,1))
qqnorm(residus,main='')
title('qq-norm',line=.5)
qqline(residus)
residus
}
if (par2 == 0) x <- log(x)
if (par2 != 0) x <- x^par2
(selection <- arimaSelect(x, order=c(par6,par3,par7), seasonal=list(order=c(par8,par4,par9), period=par5)))
bitmap(file='test1.png')
resid <- arimaSelectplot(selection)
dev.off()
resid
bitmap(file='test2.png')
acf(resid,length(resid)/2, main='Residual Autocorrelation Function')
dev.off()
bitmap(file='test3.png')
pacf(resid,length(resid)/2, main='Residual Partial Autocorrelation Function')
dev.off()
bitmap(file='test4.png')
cpgram(resid, main='Residual Cumulative Periodogram')
dev.off()
bitmap(file='test5.png')
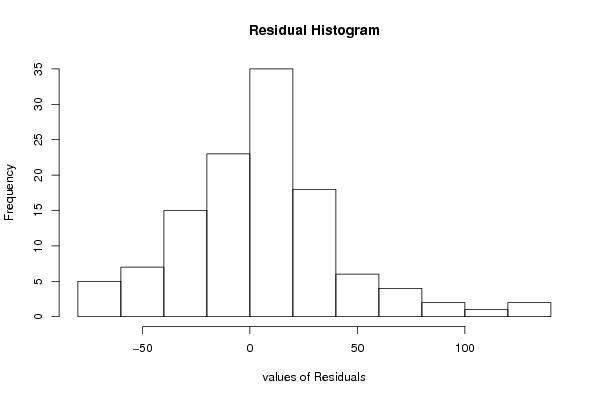
hist(resid, main='Residual Histogram', xlab='values of Residuals')
dev.off()
bitmap(file='test6.png')
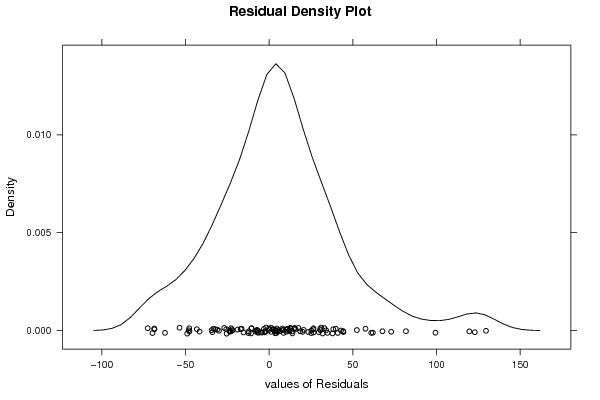
densityplot(~resid,col='black',main='Residual Density Plot', xlab='values of Residuals')
dev.off()
bitmap(file='test7.png')
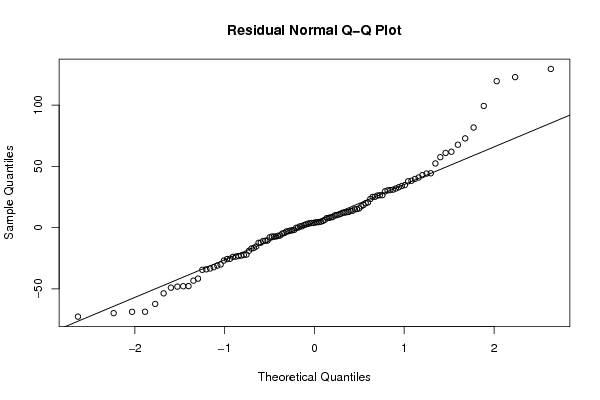
qqnorm(resid, main='Residual Normal Q-Q Plot')
qqline(resid)
dev.off()
ncols <- length(selection[[1]][1,])
nrows <- length(selection[[2]][,1])-1
load(file='createtable')
a<-table.start()
a<-table.row.start(a)
a<-table.element(a,'ARIMA Parameter Estimation and Backward Selection', ncols+1,TRUE)
a<-table.row.end(a)
a<-table.row.start(a)
a<-table.element(a,'Iteration', header=TRUE)
for (i in 1:ncols) {
a<-table.element(a,names(selection[[3]][[1]]$coef)[i],header=TRUE)
}
a<-table.row.end(a)
for (j in 1:nrows) {
a<-table.row.start(a)
mydum <- 'Estimates ('
mydum <- paste(mydum,j)
mydum <- paste(mydum,')')
a<-table.element(a,mydum, header=TRUE)
for (i in 1:ncols) {
a<-table.element(a,round(selection[[1]][j,i],4))
}
a<-table.row.end(a)
a<-table.row.start(a)
a<-table.element(a,'(p-val)', header=TRUE)
for (i in 1:ncols) {
mydum <- '('
mydum <- paste(mydum,round(selection[[2]][j,i],4),sep='')
mydum <- paste(mydum,')')
a<-table.element(a,mydum)
}
a<-table.row.end(a)
}
a<-table.end(a)
table.save(a,file='mytable.tab')
a<-table.start()
a<-table.row.start(a)
a<-table.element(a,'Estimated ARIMA Residuals', 1,TRUE)
a<-table.row.end(a)
a<-table.row.start(a)
a<-table.element(a,'Value', 1,TRUE)
a<-table.row.end(a)
for (i in (par4*par5+par3):length(resid)) {
a<-table.row.start(a)
a<-table.element(a,resid[i])
a<-table.row.end(a)
}
a<-table.end(a)
table.save(a,file='mytable1.tab')