Free Statistics

of Irreproducible Research!

Author's title

Author*The author of this computation has been verified*
R Software Modulerwasp_arimaforecasting.wasp
Title produced by softwareARIMA Forecasting
Date of computationTue, 21 Dec 2010 11:37:39 +0000
Cite this page as followsStatistical Computations at FreeStatistics.org, Office for Research Development and Education, URL https://freestatistics.org/blog/index.php?v=date/2010/Dec/21/t1292931502o95bu4gonfdxohg.htm/, Retrieved Thu, 16 May 2024 14:06:27 +0000
Statistical Computations at FreeStatistics.org, Office for Research Development and Education, URL https://freestatistics.org/blog/index.php?pk=113303, Retrieved Thu, 16 May 2024 14:06:27 +0000
QR Codes:

Original text written by user:
IsPrivate?No (this computation is public)
User-defined keywords
Estimated Impact121
Family? (F = Feedback message, R = changed R code, M = changed R Module, P = changed Parameters, D = changed Data)
-       [ARIMA Forecasting] [] [2010-12-21 11:37:39] [583fc5a74bfa894f261a865501f20e1c] [Current]
- RMP     [ARIMA Backward Selection] [] [2010-12-21 11:51:15] [a9671b130b33f9fcb98554992ce4582f]
- RMP       [ARIMA Forecasting] [] [2010-12-21 12:09:15] [a9671b130b33f9fcb98554992ce4582f]
- R PD      [ARIMA Backward Selection] [] [2011-12-23 05:46:01] [74be16979710d4c4e7c6647856088456]
-   P         [ARIMA Backward Selection] [] [2011-12-23 12:48:04] [74be16979710d4c4e7c6647856088456]
- R PD      [ARIMA Backward Selection] [] [2011-12-23 11:58:46] [a9671b130b33f9fcb98554992ce4582f]
-  M          [ARIMA Backward Selection] [] [2011-12-23 12:01:24] [74be16979710d4c4e7c6647856088456]
Feedback Forum

Post a new message
Dataseries X:
5124
4742
5434
5684
6332
6334
5636
5940
6195
6022
4535
4320
4872
4662
4663
5491
6018
6393
5610
5777
6094
6478
5216
5201
4784
4205
4681
4896
5752
6452
5995
5601
6119
6569
5798
5492
5018
4773
5502
5908
5902
6125
5419
5559
5962
6023
5346
5379
4859
5156
5010
5508
6426
6043
5499
5191
5790
5949
5219
4729


Summary of computational transaction
Raw Inputview raw input (R code)
Raw Outputview raw output of R engine
Computing time14 seconds
R Server'Gwilym Jenkins' @ 72.249.127.135

\begin{tabular}{lllllllll}
\hline
Summary of computational transaction \tabularnewline
Raw Input & view raw input (R code)  \tabularnewline
Raw Output & view raw output of R engine  \tabularnewline
Computing time & 14 seconds \tabularnewline
R Server & 'Gwilym Jenkins' @ 72.249.127.135 \tabularnewline
\hline
\end{tabular}
%Source: https://freestatistics.org/blog/index.php?pk=113303&T=0

[TABLE]
[ROW][C]Summary of computational transaction[/C][/ROW]
[ROW][C]Raw Input[/C][C]view raw input (R code) [/C][/ROW]
[ROW][C]Raw Output[/C][C]view raw output of R engine [/C][/ROW]
[ROW][C]Computing time[/C][C]14 seconds[/C][/ROW]
[ROW][C]R Server[/C][C]'Gwilym Jenkins' @ 72.249.127.135[/C][/ROW]
[/TABLE]
Source: https://freestatistics.org/blog/index.php?pk=113303&T=0

Globally Unique Identifier (entire table): ba.freestatistics.org/blog/index.php?pk=113303&T=0

As an alternative you can also use a QR Code:  

The GUIDs for individual cells are displayed in the table below:

Summary of computational transaction
Raw Inputview raw input (R code)
Raw Outputview raw output of R engine
Computing time14 seconds
R Server'Gwilym Jenkins' @ 72.249.127.135


Univariate ARIMA Extrapolation Forecast
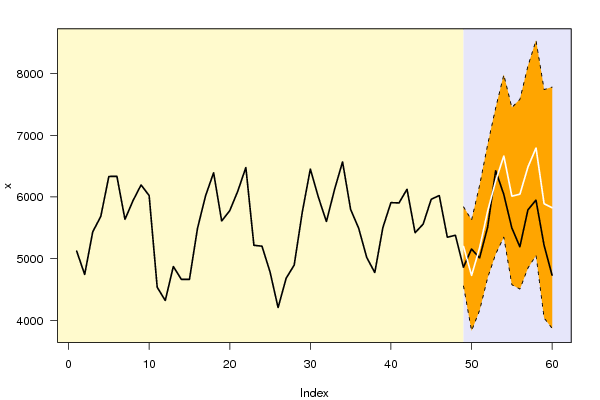
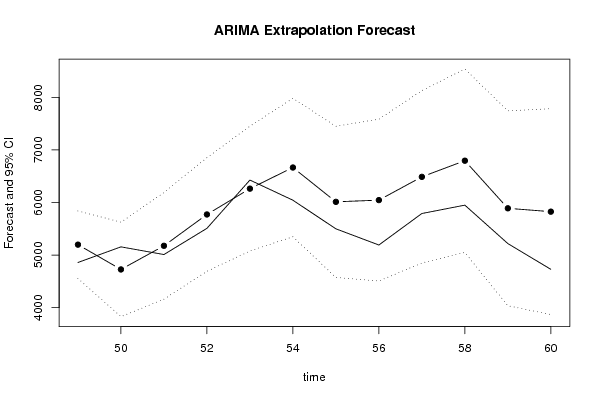
timeY[t]F[t]95% LB95% UBp-value(H0: Y[t] = F[t])P(F[t]>Y[t-1])P(F[t]>Y[t-s])P(F[t]>Y[48])
365492-------
375018-------
384773-------
395502-------
405908-------
415902-------
426125-------
435419-------
445559-------
455962-------
466023-------
475346-------
485379-------
4948595197.99884555.98165840.01590.15040.29030.70870.2903
5051564726.67383829.1175624.23050.17420.38630.45970.0772
5150105176.0774161.58366190.57040.37420.51550.26450.3475
5255085771.91764691.43696852.39820.31610.91650.40250.762
5364266262.7695076.60287448.93520.39370.89380.72450.9279
5460436664.41075348.1017980.72030.17740.63870.78910.9722
5554996012.02594574.98697449.06490.2420.48320.79070.806
5651916044.6334506.27887582.98710.13840.75650.7320.8018
5757906487.30184849.01128125.59250.20210.93950.73510.9076
5859496794.0575049.93388538.18020.17110.87040.80690.9441
5952195888.72084036.57347740.86830.23920.47460.71710.7052
6047295824.84893868.06187781.6360.13620.7280.67240.6724

\begin{tabular}{lllllllll}
\hline
Univariate ARIMA Extrapolation Forecast \tabularnewline
time & Y[t] & F[t] & 95% LB & 95% UB & p-value(H0: Y[t] = F[t]) & P(F[t]>Y[t-1]) & P(F[t]>Y[t-s]) & P(F[t]>Y[48]) \tabularnewline
36 & 5492 & - & - & - & - & - & - & - \tabularnewline
37 & 5018 & - & - & - & - & - & - & - \tabularnewline
38 & 4773 & - & - & - & - & - & - & - \tabularnewline
39 & 5502 & - & - & - & - & - & - & - \tabularnewline
40 & 5908 & - & - & - & - & - & - & - \tabularnewline
41 & 5902 & - & - & - & - & - & - & - \tabularnewline
42 & 6125 & - & - & - & - & - & - & - \tabularnewline
43 & 5419 & - & - & - & - & - & - & - \tabularnewline
44 & 5559 & - & - & - & - & - & - & - \tabularnewline
45 & 5962 & - & - & - & - & - & - & - \tabularnewline
46 & 6023 & - & - & - & - & - & - & - \tabularnewline
47 & 5346 & - & - & - & - & - & - & - \tabularnewline
48 & 5379 & - & - & - & - & - & - & - \tabularnewline
49 & 4859 & 5197.9988 & 4555.9816 & 5840.0159 & 0.1504 & 0.2903 & 0.7087 & 0.2903 \tabularnewline
50 & 5156 & 4726.6738 & 3829.117 & 5624.2305 & 0.1742 & 0.3863 & 0.4597 & 0.0772 \tabularnewline
51 & 5010 & 5176.077 & 4161.5836 & 6190.5704 & 0.3742 & 0.5155 & 0.2645 & 0.3475 \tabularnewline
52 & 5508 & 5771.9176 & 4691.4369 & 6852.3982 & 0.3161 & 0.9165 & 0.4025 & 0.762 \tabularnewline
53 & 6426 & 6262.769 & 5076.6028 & 7448.9352 & 0.3937 & 0.8938 & 0.7245 & 0.9279 \tabularnewline
54 & 6043 & 6664.4107 & 5348.101 & 7980.7203 & 0.1774 & 0.6387 & 0.7891 & 0.9722 \tabularnewline
55 & 5499 & 6012.0259 & 4574.9869 & 7449.0649 & 0.242 & 0.4832 & 0.7907 & 0.806 \tabularnewline
56 & 5191 & 6044.633 & 4506.2788 & 7582.9871 & 0.1384 & 0.7565 & 0.732 & 0.8018 \tabularnewline
57 & 5790 & 6487.3018 & 4849.0112 & 8125.5925 & 0.2021 & 0.9395 & 0.7351 & 0.9076 \tabularnewline
58 & 5949 & 6794.057 & 5049.9338 & 8538.1802 & 0.1711 & 0.8704 & 0.8069 & 0.9441 \tabularnewline
59 & 5219 & 5888.7208 & 4036.5734 & 7740.8683 & 0.2392 & 0.4746 & 0.7171 & 0.7052 \tabularnewline
60 & 4729 & 5824.8489 & 3868.0618 & 7781.636 & 0.1362 & 0.728 & 0.6724 & 0.6724 \tabularnewline
\hline
\end{tabular}
%Source: https://freestatistics.org/blog/index.php?pk=113303&T=1

[TABLE]
[ROW][C]Univariate ARIMA Extrapolation Forecast[/C][/ROW]
[ROW][C]time[/C][C]Y[t][/C][C]F[t][/C][C]95% LB[/C][C]95% UB[/C][C]p-value(H0: Y[t] = F[t])[/C][C]P(F[t]>Y[t-1])[/C][C]P(F[t]>Y[t-s])[/C][C]P(F[t]>Y[48])[/C][/ROW]
[ROW][C]36[/C][C]5492[/C][C]-[/C][C]-[/C][C]-[/C][C]-[/C][C]-[/C][C]-[/C][C]-[/C][/ROW]
[ROW][C]37[/C][C]5018[/C][C]-[/C][C]-[/C][C]-[/C][C]-[/C][C]-[/C][C]-[/C][C]-[/C][/ROW]
[ROW][C]38[/C][C]4773[/C][C]-[/C][C]-[/C][C]-[/C][C]-[/C][C]-[/C][C]-[/C][C]-[/C][/ROW]
[ROW][C]39[/C][C]5502[/C][C]-[/C][C]-[/C][C]-[/C][C]-[/C][C]-[/C][C]-[/C][C]-[/C][/ROW]
[ROW][C]40[/C][C]5908[/C][C]-[/C][C]-[/C][C]-[/C][C]-[/C][C]-[/C][C]-[/C][C]-[/C][/ROW]
[ROW][C]41[/C][C]5902[/C][C]-[/C][C]-[/C][C]-[/C][C]-[/C][C]-[/C][C]-[/C][C]-[/C][/ROW]
[ROW][C]42[/C][C]6125[/C][C]-[/C][C]-[/C][C]-[/C][C]-[/C][C]-[/C][C]-[/C][C]-[/C][/ROW]
[ROW][C]43[/C][C]5419[/C][C]-[/C][C]-[/C][C]-[/C][C]-[/C][C]-[/C][C]-[/C][C]-[/C][/ROW]
[ROW][C]44[/C][C]5559[/C][C]-[/C][C]-[/C][C]-[/C][C]-[/C][C]-[/C][C]-[/C][C]-[/C][/ROW]
[ROW][C]45[/C][C]5962[/C][C]-[/C][C]-[/C][C]-[/C][C]-[/C][C]-[/C][C]-[/C][C]-[/C][/ROW]
[ROW][C]46[/C][C]6023[/C][C]-[/C][C]-[/C][C]-[/C][C]-[/C][C]-[/C][C]-[/C][C]-[/C][/ROW]
[ROW][C]47[/C][C]5346[/C][C]-[/C][C]-[/C][C]-[/C][C]-[/C][C]-[/C][C]-[/C][C]-[/C][/ROW]
[ROW][C]48[/C][C]5379[/C][C]-[/C][C]-[/C][C]-[/C][C]-[/C][C]-[/C][C]-[/C][C]-[/C][/ROW]
[ROW][C]49[/C][C]4859[/C][C]5197.9988[/C][C]4555.9816[/C][C]5840.0159[/C][C]0.1504[/C][C]0.2903[/C][C]0.7087[/C][C]0.2903[/C][/ROW]
[ROW][C]50[/C][C]5156[/C][C]4726.6738[/C][C]3829.117[/C][C]5624.2305[/C][C]0.1742[/C][C]0.3863[/C][C]0.4597[/C][C]0.0772[/C][/ROW]
[ROW][C]51[/C][C]5010[/C][C]5176.077[/C][C]4161.5836[/C][C]6190.5704[/C][C]0.3742[/C][C]0.5155[/C][C]0.2645[/C][C]0.3475[/C][/ROW]
[ROW][C]52[/C][C]5508[/C][C]5771.9176[/C][C]4691.4369[/C][C]6852.3982[/C][C]0.3161[/C][C]0.9165[/C][C]0.4025[/C][C]0.762[/C][/ROW]
[ROW][C]53[/C][C]6426[/C][C]6262.769[/C][C]5076.6028[/C][C]7448.9352[/C][C]0.3937[/C][C]0.8938[/C][C]0.7245[/C][C]0.9279[/C][/ROW]
[ROW][C]54[/C][C]6043[/C][C]6664.4107[/C][C]5348.101[/C][C]7980.7203[/C][C]0.1774[/C][C]0.6387[/C][C]0.7891[/C][C]0.9722[/C][/ROW]
[ROW][C]55[/C][C]5499[/C][C]6012.0259[/C][C]4574.9869[/C][C]7449.0649[/C][C]0.242[/C][C]0.4832[/C][C]0.7907[/C][C]0.806[/C][/ROW]
[ROW][C]56[/C][C]5191[/C][C]6044.633[/C][C]4506.2788[/C][C]7582.9871[/C][C]0.1384[/C][C]0.7565[/C][C]0.732[/C][C]0.8018[/C][/ROW]
[ROW][C]57[/C][C]5790[/C][C]6487.3018[/C][C]4849.0112[/C][C]8125.5925[/C][C]0.2021[/C][C]0.9395[/C][C]0.7351[/C][C]0.9076[/C][/ROW]
[ROW][C]58[/C][C]5949[/C][C]6794.057[/C][C]5049.9338[/C][C]8538.1802[/C][C]0.1711[/C][C]0.8704[/C][C]0.8069[/C][C]0.9441[/C][/ROW]
[ROW][C]59[/C][C]5219[/C][C]5888.7208[/C][C]4036.5734[/C][C]7740.8683[/C][C]0.2392[/C][C]0.4746[/C][C]0.7171[/C][C]0.7052[/C][/ROW]
[ROW][C]60[/C][C]4729[/C][C]5824.8489[/C][C]3868.0618[/C][C]7781.636[/C][C]0.1362[/C][C]0.728[/C][C]0.6724[/C][C]0.6724[/C][/ROW]
[/TABLE]
Source: https://freestatistics.org/blog/index.php?pk=113303&T=1

Globally Unique Identifier (entire table): ba.freestatistics.org/blog/index.php?pk=113303&T=1

As an alternative you can also use a QR Code:  

The GUIDs for individual cells are displayed in the table below:

Univariate ARIMA Extrapolation Forecast
timeY[t]F[t]95% LB95% UBp-value(H0: Y[t] = F[t])P(F[t]>Y[t-1])P(F[t]>Y[t-s])P(F[t]>Y[48])
365492-------
375018-------
384773-------
395502-------
405908-------
415902-------
426125-------
435419-------
445559-------
455962-------
466023-------
475346-------
485379-------
4948595197.99884555.98165840.01590.15040.29030.70870.2903
5051564726.67383829.1175624.23050.17420.38630.45970.0772
5150105176.0774161.58366190.57040.37420.51550.26450.3475
5255085771.91764691.43696852.39820.31610.91650.40250.762
5364266262.7695076.60287448.93520.39370.89380.72450.9279
5460436664.41075348.1017980.72030.17740.63870.78910.9722
5554996012.02594574.98697449.06490.2420.48320.79070.806
5651916044.6334506.27887582.98710.13840.75650.7320.8018
5757906487.30184849.01128125.59250.20210.93950.73510.9076
5859496794.0575049.93388538.18020.17110.87040.80690.9441
5952195888.72084036.57347740.86830.23920.47460.71710.7052
6047295824.84893868.06187781.6360.13620.7280.67240.6724


Univariate ARIMA Extrapolation Forecast Performance
time% S.E.PEMAPESq.EMSERMSE
490.063-0.06520114920.170100
500.09690.09080.078184321.0094149620.5898386.8082
510.1-0.03210.062727581.5569108940.9122330.062
520.0955-0.04570.058569652.489899118.8066314.8314
530.09660.02610.05226644.36684623.9185290.9019
540.1008-0.09320.0589386151.2118134878.4674367.258
550.122-0.08530.0626263195.5507153209.4793391.4198
560.1298-0.14120.0725728689.2614225144.452474.4939
570.1288-0.10750.0764486229.8349254153.939504.1368
580.131-0.12440.0812714121.2764300150.6728547.8601
590.1605-0.11370.0841448525.9903313639.338560.0351
600.1714-0.18810.09281200884.8073387576.4604622.5564

\begin{tabular}{lllllllll}
\hline
Univariate ARIMA Extrapolation Forecast Performance \tabularnewline
time & % S.E. & PE & MAPE & Sq.E & MSE & RMSE \tabularnewline
49 & 0.063 & -0.0652 & 0 & 114920.1701 & 0 & 0 \tabularnewline
50 & 0.0969 & 0.0908 & 0.078 & 184321.0094 & 149620.5898 & 386.8082 \tabularnewline
51 & 0.1 & -0.0321 & 0.0627 & 27581.5569 & 108940.9122 & 330.062 \tabularnewline
52 & 0.0955 & -0.0457 & 0.0585 & 69652.4898 & 99118.8066 & 314.8314 \tabularnewline
53 & 0.0966 & 0.0261 & 0.052 & 26644.366 & 84623.9185 & 290.9019 \tabularnewline
54 & 0.1008 & -0.0932 & 0.0589 & 386151.2118 & 134878.4674 & 367.258 \tabularnewline
55 & 0.122 & -0.0853 & 0.0626 & 263195.5507 & 153209.4793 & 391.4198 \tabularnewline
56 & 0.1298 & -0.1412 & 0.0725 & 728689.2614 & 225144.452 & 474.4939 \tabularnewline
57 & 0.1288 & -0.1075 & 0.0764 & 486229.8349 & 254153.939 & 504.1368 \tabularnewline
58 & 0.131 & -0.1244 & 0.0812 & 714121.2764 & 300150.6728 & 547.8601 \tabularnewline
59 & 0.1605 & -0.1137 & 0.0841 & 448525.9903 & 313639.338 & 560.0351 \tabularnewline
60 & 0.1714 & -0.1881 & 0.0928 & 1200884.8073 & 387576.4604 & 622.5564 \tabularnewline
\hline
\end{tabular}
%Source: https://freestatistics.org/blog/index.php?pk=113303&T=2

[TABLE]
[ROW][C]Univariate ARIMA Extrapolation Forecast Performance[/C][/ROW]
[ROW][C]time[/C][C]% S.E.[/C][C]PE[/C][C]MAPE[/C][C]Sq.E[/C][C]MSE[/C][C]RMSE[/C][/ROW]
[ROW][C]49[/C][C]0.063[/C][C]-0.0652[/C][C]0[/C][C]114920.1701[/C][C]0[/C][C]0[/C][/ROW]
[ROW][C]50[/C][C]0.0969[/C][C]0.0908[/C][C]0.078[/C][C]184321.0094[/C][C]149620.5898[/C][C]386.8082[/C][/ROW]
[ROW][C]51[/C][C]0.1[/C][C]-0.0321[/C][C]0.0627[/C][C]27581.5569[/C][C]108940.9122[/C][C]330.062[/C][/ROW]
[ROW][C]52[/C][C]0.0955[/C][C]-0.0457[/C][C]0.0585[/C][C]69652.4898[/C][C]99118.8066[/C][C]314.8314[/C][/ROW]
[ROW][C]53[/C][C]0.0966[/C][C]0.0261[/C][C]0.052[/C][C]26644.366[/C][C]84623.9185[/C][C]290.9019[/C][/ROW]
[ROW][C]54[/C][C]0.1008[/C][C]-0.0932[/C][C]0.0589[/C][C]386151.2118[/C][C]134878.4674[/C][C]367.258[/C][/ROW]
[ROW][C]55[/C][C]0.122[/C][C]-0.0853[/C][C]0.0626[/C][C]263195.5507[/C][C]153209.4793[/C][C]391.4198[/C][/ROW]
[ROW][C]56[/C][C]0.1298[/C][C]-0.1412[/C][C]0.0725[/C][C]728689.2614[/C][C]225144.452[/C][C]474.4939[/C][/ROW]
[ROW][C]57[/C][C]0.1288[/C][C]-0.1075[/C][C]0.0764[/C][C]486229.8349[/C][C]254153.939[/C][C]504.1368[/C][/ROW]
[ROW][C]58[/C][C]0.131[/C][C]-0.1244[/C][C]0.0812[/C][C]714121.2764[/C][C]300150.6728[/C][C]547.8601[/C][/ROW]
[ROW][C]59[/C][C]0.1605[/C][C]-0.1137[/C][C]0.0841[/C][C]448525.9903[/C][C]313639.338[/C][C]560.0351[/C][/ROW]
[ROW][C]60[/C][C]0.1714[/C][C]-0.1881[/C][C]0.0928[/C][C]1200884.8073[/C][C]387576.4604[/C][C]622.5564[/C][/ROW]
[/TABLE]
Source: https://freestatistics.org/blog/index.php?pk=113303&T=2

Globally Unique Identifier (entire table): ba.freestatistics.org/blog/index.php?pk=113303&T=2

As an alternative you can also use a QR Code:  

The GUIDs for individual cells are displayed in the table below:

Univariate ARIMA Extrapolation Forecast Performance
time% S.E.PEMAPESq.EMSERMSE
490.063-0.06520114920.170100
500.09690.09080.078184321.0094149620.5898386.8082
510.1-0.03210.062727581.5569108940.9122330.062
520.0955-0.04570.058569652.489899118.8066314.8314
530.09660.02610.05226644.36684623.9185290.9019
540.1008-0.09320.0589386151.2118134878.4674367.258
550.122-0.08530.0626263195.5507153209.4793391.4198
560.1298-0.14120.0725728689.2614225144.452474.4939
570.1288-0.10750.0764486229.8349254153.939504.1368
580.131-0.12440.0812714121.2764300150.6728547.8601
590.1605-0.11370.0841448525.9903313639.338560.0351
600.1714-0.18810.09281200884.8073387576.4604622.5564


Parameters (Session):
par1 = 12 ; par2 = 1 ; par3 = 2 ; par4 = 1 ; par5 = 12 ; par6 = 3 ; par7 = 2 ; par8 = 2 ; par9 = 1 ; par10 = FALSE ;
Parameters (R input):
par1 = 12 ; par2 = 1 ; par3 = 2 ; par4 = 1 ; par5 = 12 ; par6 = 3 ; par7 = 2 ; par8 = 2 ; par9 = 1 ; par10 = FALSE ;
R code (references can be found in the software module):
par1 <- as.numeric(par1) #cut off periods
par2 <- as.numeric(par2) #lambda
par3 <- as.numeric(par3) #degree of non-seasonal differencing
par4 <- as.numeric(par4) #degree of seasonal differencing
par5 <- as.numeric(par5) #seasonal period
par6 <- as.numeric(par6) #p
par7 <- as.numeric(par7) #q
par8 <- as.numeric(par8) #P
par9 <- as.numeric(par9) #Q
if (par10 == 'TRUE') par10 <- TRUE
if (par10 == 'FALSE') par10 <- FALSE
if (par2 == 0) x <- log(x)
if (par2 != 0) x <- x^par2
lx <- length(x)
first <- lx - 2*par1
nx <- lx - par1
nx1 <- nx + 1
fx <- lx - nx
if (fx < 1) {
fx <- par5
nx1 <- lx + fx - 1
first <- lx - 2*fx
}
first <- 1
if (fx < 3) fx <- round(lx/10,0)
(arima.out <- arima(x[1:nx], order=c(par6,par3,par7), seasonal=list(order=c(par8,par4,par9), period=par5), include.mean=par10, method='ML'))
(forecast <- predict(arima.out,par1))
(lb <- forecast$pred - 1.96 * forecast$se)
(ub <- forecast$pred + 1.96 * forecast$se)
if (par2 == 0) {
x <- exp(x)
forecast$pred <- exp(forecast$pred)
lb <- exp(lb)
ub <- exp(ub)
}
if (par2 != 0) {
x <- x^(1/par2)
forecast$pred <- forecast$pred^(1/par2)
lb <- lb^(1/par2)
ub <- ub^(1/par2)
}
if (par2 < 0) {
olb <- lb
lb <- ub
ub <- olb
}
(actandfor <- c(x[1:nx], forecast$pred))
(perc.se <- (ub-forecast$pred)/1.96/forecast$pred)
bitmap(file='test1.png')
opar <- par(mar=c(4,4,2,2),las=1)
ylim <- c( min(x[first:nx],lb), max(x[first:nx],ub))
plot(x,ylim=ylim,type='n',xlim=c(first,lx))
usr <- par('usr')
rect(usr[1],usr[3],nx+1,usr[4],border=NA,col='lemonchiffon')
rect(nx1,usr[3],usr[2],usr[4],border=NA,col='lavender')
abline(h= (-3:3)*2 , col ='gray', lty =3)
polygon( c(nx1:lx,lx:nx1), c(lb,rev(ub)), col = 'orange', lty=2,border=NA)
lines(nx1:lx, lb , lty=2)
lines(nx1:lx, ub , lty=2)
lines(x, lwd=2)
lines(nx1:lx, forecast$pred , lwd=2 , col ='white')
box()
par(opar)
dev.off()
prob.dec <- array(NA, dim=fx)
prob.sdec <- array(NA, dim=fx)
prob.ldec <- array(NA, dim=fx)
prob.pval <- array(NA, dim=fx)
perf.pe <- array(0, dim=fx)
perf.mape <- array(0, dim=fx)
perf.mape1 <- array(0, dim=fx)
perf.se <- array(0, dim=fx)
perf.mse <- array(0, dim=fx)
perf.mse1 <- array(0, dim=fx)
perf.rmse <- array(0, dim=fx)
for (i in 1:fx) {
locSD <- (ub[i] - forecast$pred[i]) / 1.96
perf.pe[i] = (x[nx+i] - forecast$pred[i]) / forecast$pred[i]
perf.se[i] = (x[nx+i] - forecast$pred[i])^2
prob.dec[i] = pnorm((x[nx+i-1] - forecast$pred[i]) / locSD)
prob.sdec[i] = pnorm((x[nx+i-par5] - forecast$pred[i]) / locSD)
prob.ldec[i] = pnorm((x[nx] - forecast$pred[i]) / locSD)
prob.pval[i] = pnorm(abs(x[nx+i] - forecast$pred[i]) / locSD)
}
perf.mape[1] = abs(perf.pe[1])
perf.mse[1] = abs(perf.se[1])
for (i in 2:fx) {
perf.mape[i] = perf.mape[i-1] + abs(perf.pe[i])
perf.mape1[i] = perf.mape[i] / i
perf.mse[i] = perf.mse[i-1] + perf.se[i]
perf.mse1[i] = perf.mse[i] / i
}
perf.rmse = sqrt(perf.mse1)
bitmap(file='test2.png')
plot(forecast$pred, pch=19, type='b',main='ARIMA Extrapolation Forecast', ylab='Forecast and 95% CI', xlab='time',ylim=c(min(lb),max(ub)))
dum <- forecast$pred
dum[1:par1] <- x[(nx+1):lx]
lines(dum, lty=1)
lines(ub,lty=3)
lines(lb,lty=3)
dev.off()
load(file='createtable')
a<-table.start()
a<-table.row.start(a)
a<-table.element(a,'Univariate ARIMA Extrapolation Forecast',9,TRUE)
a<-table.row.end(a)
a<-table.row.start(a)
a<-table.element(a,'time',1,header=TRUE)
a<-table.element(a,'Y[t]',1,header=TRUE)
a<-table.element(a,'F[t]',1,header=TRUE)
a<-table.element(a,'95% LB',1,header=TRUE)
a<-table.element(a,'95% UB',1,header=TRUE)
a<-table.element(a,'p-value
(H0: Y[t] = F[t])',1,header=TRUE)
a<-table.element(a,'P(F[t]>Y[t-1])',1,header=TRUE)
a<-table.element(a,'P(F[t]>Y[t-s])',1,header=TRUE)
mylab <- paste('P(F[t]>Y[',nx,sep='')
mylab <- paste(mylab,'])',sep='')
a<-table.element(a,mylab,1,header=TRUE)
a<-table.row.end(a)
for (i in (nx-par5):nx) {
a<-table.row.start(a)
a<-table.element(a,i,header=TRUE)
a<-table.element(a,x[i])
a<-table.element(a,'-')
a<-table.row.end(a)
}
for (i in 1:fx) {
a<-table.row.start(a)
a<-table.element(a,nx+i,header=TRUE)
a<-table.element(a,round(x[nx+i],4))
a<-table.element(a,round(forecast$pred[i],4))
a<-table.element(a,round(lb[i],4))
a<-table.element(a,round(ub[i],4))
a<-table.element(a,round((1-prob.pval[i]),4))
a<-table.element(a,round((1-prob.dec[i]),4))
a<-table.element(a,round((1-prob.sdec[i]),4))
a<-table.element(a,round((1-prob.ldec[i]),4))
a<-table.row.end(a)
}
a<-table.end(a)
table.save(a,file='mytable.tab')
a<-table.start()
a<-table.row.start(a)
a<-table.element(a,'Univariate ARIMA Extrapolation Forecast Performance',7,TRUE)
a<-table.row.end(a)
a<-table.row.start(a)
a<-table.element(a,'time',1,header=TRUE)
a<-table.element(a,'% S.E.',1,header=TRUE)
a<-table.element(a,'PE',1,header=TRUE)
a<-table.element(a,'MAPE',1,header=TRUE)
a<-table.element(a,'Sq.E',1,header=TRUE)
a<-table.element(a,'MSE',1,header=TRUE)
a<-table.element(a,'RMSE',1,header=TRUE)
a<-table.row.end(a)
for (i in 1:fx) {
a<-table.row.start(a)
a<-table.element(a,nx+i,header=TRUE)
a<-table.element(a,round(perc.se[i],4))
a<-table.element(a,round(perf.pe[i],4))
a<-table.element(a,round(perf.mape1[i],4))
a<-table.element(a,round(perf.se[i],4))
a<-table.element(a,round(perf.mse1[i],4))
a<-table.element(a,round(perf.rmse[i],4))
a<-table.row.end(a)
}
a<-table.end(a)
table.save(a,file='mytable1.tab')