Free Statistics

of Irreproducible Research!

Author's title

Author*The author of this computation has been verified*
R Software Modulerwasp_arimabackwardselection.wasp
Title produced by softwareARIMA Backward Selection
Date of computationThu, 22 Dec 2011 06:17:52 -0500
Cite this page as followsStatistical Computations at FreeStatistics.org, Office for Research Development and Education, URL https://freestatistics.org/blog/index.php?v=date/2011/Dec/22/t1324552832er63cgawpt9xy8l.htm/, Retrieved Fri, 03 May 2024 09:34:11 +0000
Statistical Computations at FreeStatistics.org, Office for Research Development and Education, URL https://freestatistics.org/blog/index.php?pk=159323, Retrieved Fri, 03 May 2024 09:34:11 +0000
QR Codes:

Original text written by user:
IsPrivate?No (this computation is public)
User-defined keywords
Estimated Impact169
Family? (F = Feedback message, R = changed R code, M = changed R Module, P = changed Parameters, D = changed Data)
-     [Univariate Explorative Data Analysis] [Monthly US soldie...] [2010-11-02 12:07:39] [b98453cac15ba1066b407e146608df68]
- RMP   [Variance Reduction Matrix] [Soldiers] [2010-11-29 09:51:25] [b98453cac15ba1066b407e146608df68]
- RM      [Standard Deviation-Mean Plot] [Soldiers] [2010-11-29 11:02:42] [b98453cac15ba1066b407e146608df68]
- RMP       [ARIMA Backward Selection] [Soldiers] [2010-11-29 17:56:11] [b98453cac15ba1066b407e146608df68]
- R PD        [ARIMA Backward Selection] [WS IX-aantal over...] [2011-12-06 20:15:53] [74be16979710d4c4e7c6647856088456]
-    D          [ARIMA Backward Selection] [Paper arima foutm...] [2011-12-20 16:15:18] [7c680a04865e75aa8ab422cdbfd97ac3]
-   P               [ARIMA Backward Selection] [Paper arima corre...] [2011-12-22 11:17:52] [3e388c05c22237d436c48535c44f60bb] [Current]
Feedback Forum

Post a new message
Dataseries X:
18992
0
21552
1868501
7185612
10348382
6942386
4306121
2833176
1515513
1242981
699343
89497
128
10585
1070323
7167741
13193530
7885720
6785683
3106846
1706331
1286534
499079
24637
16
27309
873433
8435418
11290088
6840395
3803252
4388988
2680940
1174135
328388
22943
5657
28156
770831
8378147
13274946
7297840
2848227
2892179
1762224
1009375
188388
3393
0
13807
2619905
13297704
6240087
5108460
4553381
3148546
2433387
1748108
723454
58525
792
42585
1634386
10360570
6798599
4847748
4971202
343863
2200366
1549422
90144
63288
338
44863
1678135
9293357
9361258
6766402
4331272
3518962
2425786
1701795
552452
16104
0
90198
1731332
7954135
11561342
6834733
4255652
4243070
3415216
1841237
655456


Summary of computational transaction
Raw Inputview raw input (R code)
Raw Outputview raw output of R engine
Computing time6 seconds
R Server'Gertrude Mary Cox' @ cox.wessa.net

\begin{tabular}{lllllllll}
\hline
Summary of computational transaction \tabularnewline
Raw Input & view raw input (R code)  \tabularnewline
Raw Output & view raw output of R engine  \tabularnewline
Computing time & 6 seconds \tabularnewline
R Server & 'Gertrude Mary Cox' @ cox.wessa.net \tabularnewline
\hline
\end{tabular}
%Source: https://freestatistics.org/blog/index.php?pk=159323&T=0

[TABLE]
[ROW][C]Summary of computational transaction[/C][/ROW]
[ROW][C]Raw Input[/C][C]view raw input (R code) [/C][/ROW]
[ROW][C]Raw Output[/C][C]view raw output of R engine [/C][/ROW]
[ROW][C]Computing time[/C][C]6 seconds[/C][/ROW]
[ROW][C]R Server[/C][C]'Gertrude Mary Cox' @ cox.wessa.net[/C][/ROW]
[/TABLE]
Source: https://freestatistics.org/blog/index.php?pk=159323&T=0

Globally Unique Identifier (entire table): ba.freestatistics.org/blog/index.php?pk=159323&T=0

As an alternative you can also use a QR Code:  

The GUIDs for individual cells are displayed in the table below:

Summary of computational transaction
Raw Inputview raw input (R code)
Raw Outputview raw output of R engine
Computing time6 seconds
R Server'Gertrude Mary Cox' @ cox.wessa.net


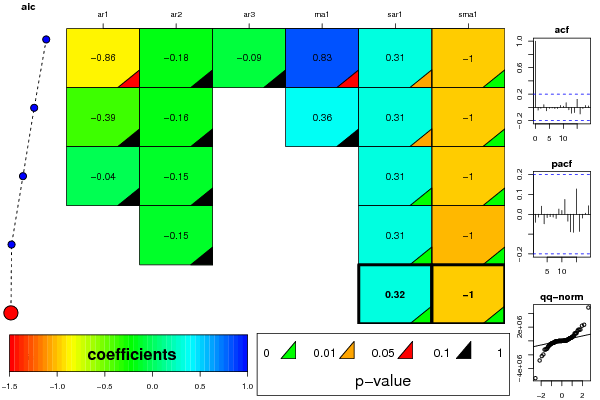
ARIMA Parameter Estimation and Backward Selection
Iterationar1ar2ar3ma1sar1sma1
Estimates ( 1 )-0.8631-0.1842-0.09140.82810.3144-1
(p-val)(0.0891 )(0.2009 )(0.5551 )(0.0959 )(0.0124 )(0 )
Estimates ( 2 )-0.3923-0.160300.35780.3075-0.9999
(p-val)(0.5508 )(0.1395 )(NA )(0.5918 )(0.0115 )(0 )
Estimates ( 3 )-0.0438-0.1496000.3127-0.9998
(p-val)(0.6847 )(0.164 )(NA )(NA )(0.0099 )(0 )
Estimates ( 4 )0-0.1479000.3148-1
(p-val)(NA )(0.1688 )(NA )(NA )(0.0093 )(0 )
Estimates ( 5 )00000.3191-0.9999
(p-val)(NA )(NA )(NA )(NA )(0.0082 )(0 )
Estimates ( 6 )NANANANANANA
(p-val)(NA )(NA )(NA )(NA )(NA )(NA )
Estimates ( 7 )NANANANANANA
(p-val)(NA )(NA )(NA )(NA )(NA )(NA )
Estimates ( 8 )NANANANANANA
(p-val)(NA )(NA )(NA )(NA )(NA )(NA )
Estimates ( 9 )NANANANANANA
(p-val)(NA )(NA )(NA )(NA )(NA )(NA )
Estimates ( 10 )NANANANANANA
(p-val)(NA )(NA )(NA )(NA )(NA )(NA )
Estimates ( 11 )NANANANANANA
(p-val)(NA )(NA )(NA )(NA )(NA )(NA )

\begin{tabular}{lllllllll}
\hline
ARIMA Parameter Estimation and Backward Selection \tabularnewline
Iteration & ar1 & ar2 & ar3 & ma1 & sar1 & sma1 \tabularnewline
Estimates ( 1 ) & -0.8631 & -0.1842 & -0.0914 & 0.8281 & 0.3144 & -1 \tabularnewline
(p-val) & (0.0891 ) & (0.2009 ) & (0.5551 ) & (0.0959 ) & (0.0124 ) & (0 ) \tabularnewline
Estimates ( 2 ) & -0.3923 & -0.1603 & 0 & 0.3578 & 0.3075 & -0.9999 \tabularnewline
(p-val) & (0.5508 ) & (0.1395 ) & (NA ) & (0.5918 ) & (0.0115 ) & (0 ) \tabularnewline
Estimates ( 3 ) & -0.0438 & -0.1496 & 0 & 0 & 0.3127 & -0.9998 \tabularnewline
(p-val) & (0.6847 ) & (0.164 ) & (NA ) & (NA ) & (0.0099 ) & (0 ) \tabularnewline
Estimates ( 4 ) & 0 & -0.1479 & 0 & 0 & 0.3148 & -1 \tabularnewline
(p-val) & (NA ) & (0.1688 ) & (NA ) & (NA ) & (0.0093 ) & (0 ) \tabularnewline
Estimates ( 5 ) & 0 & 0 & 0 & 0 & 0.3191 & -0.9999 \tabularnewline
(p-val) & (NA ) & (NA ) & (NA ) & (NA ) & (0.0082 ) & (0 ) \tabularnewline
Estimates ( 6 ) & NA & NA & NA & NA & NA & NA \tabularnewline
(p-val) & (NA ) & (NA ) & (NA ) & (NA ) & (NA ) & (NA ) \tabularnewline
Estimates ( 7 ) & NA & NA & NA & NA & NA & NA \tabularnewline
(p-val) & (NA ) & (NA ) & (NA ) & (NA ) & (NA ) & (NA ) \tabularnewline
Estimates ( 8 ) & NA & NA & NA & NA & NA & NA \tabularnewline
(p-val) & (NA ) & (NA ) & (NA ) & (NA ) & (NA ) & (NA ) \tabularnewline
Estimates ( 9 ) & NA & NA & NA & NA & NA & NA \tabularnewline
(p-val) & (NA ) & (NA ) & (NA ) & (NA ) & (NA ) & (NA ) \tabularnewline
Estimates ( 10 ) & NA & NA & NA & NA & NA & NA \tabularnewline
(p-val) & (NA ) & (NA ) & (NA ) & (NA ) & (NA ) & (NA ) \tabularnewline
Estimates ( 11 ) & NA & NA & NA & NA & NA & NA \tabularnewline
(p-val) & (NA ) & (NA ) & (NA ) & (NA ) & (NA ) & (NA ) \tabularnewline
\hline
\end{tabular}
%Source: https://freestatistics.org/blog/index.php?pk=159323&T=1

[TABLE]
[ROW][C]ARIMA Parameter Estimation and Backward Selection[/C][/ROW]
[ROW][C]Iteration[/C][C]ar1[/C][C]ar2[/C][C]ar3[/C][C]ma1[/C][C]sar1[/C][C]sma1[/C][/ROW]
[ROW][C]Estimates ( 1 )[/C][C]-0.8631[/C][C]-0.1842[/C][C]-0.0914[/C][C]0.8281[/C][C]0.3144[/C][C]-1[/C][/ROW]
[ROW][C](p-val)[/C][C](0.0891 )[/C][C](0.2009 )[/C][C](0.5551 )[/C][C](0.0959 )[/C][C](0.0124 )[/C][C](0 )[/C][/ROW]
[ROW][C]Estimates ( 2 )[/C][C]-0.3923[/C][C]-0.1603[/C][C]0[/C][C]0.3578[/C][C]0.3075[/C][C]-0.9999[/C][/ROW]
[ROW][C](p-val)[/C][C](0.5508 )[/C][C](0.1395 )[/C][C](NA )[/C][C](0.5918 )[/C][C](0.0115 )[/C][C](0 )[/C][/ROW]
[ROW][C]Estimates ( 3 )[/C][C]-0.0438[/C][C]-0.1496[/C][C]0[/C][C]0[/C][C]0.3127[/C][C]-0.9998[/C][/ROW]
[ROW][C](p-val)[/C][C](0.6847 )[/C][C](0.164 )[/C][C](NA )[/C][C](NA )[/C][C](0.0099 )[/C][C](0 )[/C][/ROW]
[ROW][C]Estimates ( 4 )[/C][C]0[/C][C]-0.1479[/C][C]0[/C][C]0[/C][C]0.3148[/C][C]-1[/C][/ROW]
[ROW][C](p-val)[/C][C](NA )[/C][C](0.1688 )[/C][C](NA )[/C][C](NA )[/C][C](0.0093 )[/C][C](0 )[/C][/ROW]
[ROW][C]Estimates ( 5 )[/C][C]0[/C][C]0[/C][C]0[/C][C]0[/C][C]0.3191[/C][C]-0.9999[/C][/ROW]
[ROW][C](p-val)[/C][C](NA )[/C][C](NA )[/C][C](NA )[/C][C](NA )[/C][C](0.0082 )[/C][C](0 )[/C][/ROW]
[ROW][C]Estimates ( 6 )[/C][C]NA[/C][C]NA[/C][C]NA[/C][C]NA[/C][C]NA[/C][C]NA[/C][/ROW]
[ROW][C](p-val)[/C][C](NA )[/C][C](NA )[/C][C](NA )[/C][C](NA )[/C][C](NA )[/C][C](NA )[/C][/ROW]
[ROW][C]Estimates ( 7 )[/C][C]NA[/C][C]NA[/C][C]NA[/C][C]NA[/C][C]NA[/C][C]NA[/C][/ROW]
[ROW][C](p-val)[/C][C](NA )[/C][C](NA )[/C][C](NA )[/C][C](NA )[/C][C](NA )[/C][C](NA )[/C][/ROW]
[ROW][C]Estimates ( 8 )[/C][C]NA[/C][C]NA[/C][C]NA[/C][C]NA[/C][C]NA[/C][C]NA[/C][/ROW]
[ROW][C](p-val)[/C][C](NA )[/C][C](NA )[/C][C](NA )[/C][C](NA )[/C][C](NA )[/C][C](NA )[/C][/ROW]
[ROW][C]Estimates ( 9 )[/C][C]NA[/C][C]NA[/C][C]NA[/C][C]NA[/C][C]NA[/C][C]NA[/C][/ROW]
[ROW][C](p-val)[/C][C](NA )[/C][C](NA )[/C][C](NA )[/C][C](NA )[/C][C](NA )[/C][C](NA )[/C][/ROW]
[ROW][C]Estimates ( 10 )[/C][C]NA[/C][C]NA[/C][C]NA[/C][C]NA[/C][C]NA[/C][C]NA[/C][/ROW]
[ROW][C](p-val)[/C][C](NA )[/C][C](NA )[/C][C](NA )[/C][C](NA )[/C][C](NA )[/C][C](NA )[/C][/ROW]
[ROW][C]Estimates ( 11 )[/C][C]NA[/C][C]NA[/C][C]NA[/C][C]NA[/C][C]NA[/C][C]NA[/C][/ROW]
[ROW][C](p-val)[/C][C](NA )[/C][C](NA )[/C][C](NA )[/C][C](NA )[/C][C](NA )[/C][C](NA )[/C][/ROW]
[/TABLE]
Source: https://freestatistics.org/blog/index.php?pk=159323&T=1

Globally Unique Identifier (entire table): ba.freestatistics.org/blog/index.php?pk=159323&T=1

As an alternative you can also use a QR Code:  

The GUIDs for individual cells are displayed in the table below:

ARIMA Parameter Estimation and Backward Selection
Iterationar1ar2ar3ma1sar1sma1
Estimates ( 1 )-0.8631-0.1842-0.09140.82810.3144-1
(p-val)(0.0891 )(0.2009 )(0.5551 )(0.0959 )(0.0124 )(0 )
Estimates ( 2 )-0.3923-0.160300.35780.3075-0.9999
(p-val)(0.5508 )(0.1395 )(NA )(0.5918 )(0.0115 )(0 )
Estimates ( 3 )-0.0438-0.1496000.3127-0.9998
(p-val)(0.6847 )(0.164 )(NA )(NA )(0.0099 )(0 )
Estimates ( 4 )0-0.1479000.3148-1
(p-val)(NA )(0.1688 )(NA )(NA )(0.0093 )(0 )
Estimates ( 5 )00000.3191-0.9999
(p-val)(NA )(NA )(NA )(NA )(0.0082 )(0 )
Estimates ( 6 )NANANANANANA
(p-val)(NA )(NA )(NA )(NA )(NA )(NA )
Estimates ( 7 )NANANANANANA
(p-val)(NA )(NA )(NA )(NA )(NA )(NA )
Estimates ( 8 )NANANANANANA
(p-val)(NA )(NA )(NA )(NA )(NA )(NA )
Estimates ( 9 )NANANANANANA
(p-val)(NA )(NA )(NA )(NA )(NA )(NA )
Estimates ( 10 )NANANANANANA
(p-val)(NA )(NA )(NA )(NA )(NA )(NA )
Estimates ( 11 )NANANANANANA
(p-val)(NA )(NA )(NA )(NA )(NA )(NA )


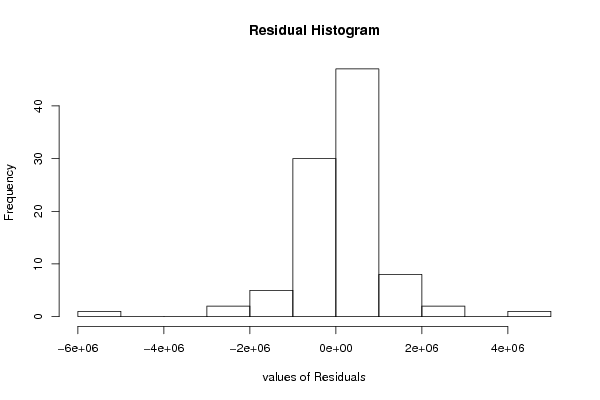
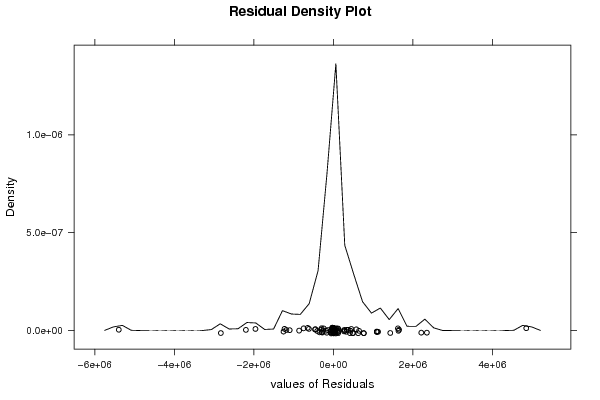
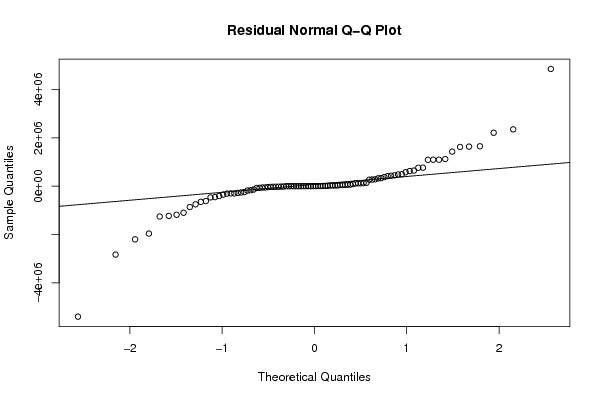
Estimated ARIMA Residuals
Value
699.342713971417
56535.9474482707
102.711119245887
-437.774920394908
-647134.827709492
-15793.0302609407
2211078.67095535
762638.506287353
2351618.55054608
335447.01020016
452089.575302419
65300.2639453898
-139723.669080422
-30572.4688256385
-22652.937383906
5993.13546779995
-405934.466263837
1090405.18052603
-861488.37982981
-462190.795956643
-1959279.80166182
1095491.99795163
625261.056640679
89801.4998877103
-73999.5820580345
-22607.1743842799
-24541.7499900654
3145.83285957115
-348211.519180807
432096.490370396
1637420.09867308
285713.46494024
-1182596.58862977
-748545.89261853
-614342.040956679
-297024.330857652
-295741.979401422
-52031.7052144861
-36903.8394628976
-13328.2329363933
1430730.71164091
4850753.86980479
-5396528.17664417
-1228817.43952697
-166665.455536137
-260526.402237217
646050.566749679
577455.109552425
416954.661835116
118554.940598316
49087.093661771
27941.0370369703
-243142.303794975
-54267.2766570832
-2199974.74680762
-1253528.50680655
128855.905917724
-2829742.3298329
117535.968140384
-306866.452762589
-450918.397244376
30807.4292672515
-67668.1137353576
16077.4081487817
120552.179325221
-181220.995491295
378002.866011062
766649.439423028
-279667.503488597
1623244.27243556
274216.357481254
496522.745684367
270054.686502036
10571.6685448512
31929.4959692707
49416.7556167589
143300.943168086
-1098758.03595845
1651400.84894136
30718.0877210465
66443.0808558891
1095607.25594889
1124501.20616418
485219.143100054
325783.133459779

\begin{tabular}{lllllllll}
\hline
Estimated ARIMA Residuals \tabularnewline
Value \tabularnewline
699.342713971417 \tabularnewline
56535.9474482707 \tabularnewline
102.711119245887 \tabularnewline
-437.774920394908 \tabularnewline
-647134.827709492 \tabularnewline
-15793.0302609407 \tabularnewline
2211078.67095535 \tabularnewline
762638.506287353 \tabularnewline
2351618.55054608 \tabularnewline
335447.01020016 \tabularnewline
452089.575302419 \tabularnewline
65300.2639453898 \tabularnewline
-139723.669080422 \tabularnewline
-30572.4688256385 \tabularnewline
-22652.937383906 \tabularnewline
5993.13546779995 \tabularnewline
-405934.466263837 \tabularnewline
1090405.18052603 \tabularnewline
-861488.37982981 \tabularnewline
-462190.795956643 \tabularnewline
-1959279.80166182 \tabularnewline
1095491.99795163 \tabularnewline
625261.056640679 \tabularnewline
89801.4998877103 \tabularnewline
-73999.5820580345 \tabularnewline
-22607.1743842799 \tabularnewline
-24541.7499900654 \tabularnewline
3145.83285957115 \tabularnewline
-348211.519180807 \tabularnewline
432096.490370396 \tabularnewline
1637420.09867308 \tabularnewline
285713.46494024 \tabularnewline
-1182596.58862977 \tabularnewline
-748545.89261853 \tabularnewline
-614342.040956679 \tabularnewline
-297024.330857652 \tabularnewline
-295741.979401422 \tabularnewline
-52031.7052144861 \tabularnewline
-36903.8394628976 \tabularnewline
-13328.2329363933 \tabularnewline
1430730.71164091 \tabularnewline
4850753.86980479 \tabularnewline
-5396528.17664417 \tabularnewline
-1228817.43952697 \tabularnewline
-166665.455536137 \tabularnewline
-260526.402237217 \tabularnewline
646050.566749679 \tabularnewline
577455.109552425 \tabularnewline
416954.661835116 \tabularnewline
118554.940598316 \tabularnewline
49087.093661771 \tabularnewline
27941.0370369703 \tabularnewline
-243142.303794975 \tabularnewline
-54267.2766570832 \tabularnewline
-2199974.74680762 \tabularnewline
-1253528.50680655 \tabularnewline
128855.905917724 \tabularnewline
-2829742.3298329 \tabularnewline
117535.968140384 \tabularnewline
-306866.452762589 \tabularnewline
-450918.397244376 \tabularnewline
30807.4292672515 \tabularnewline
-67668.1137353576 \tabularnewline
16077.4081487817 \tabularnewline
120552.179325221 \tabularnewline
-181220.995491295 \tabularnewline
378002.866011062 \tabularnewline
766649.439423028 \tabularnewline
-279667.503488597 \tabularnewline
1623244.27243556 \tabularnewline
274216.357481254 \tabularnewline
496522.745684367 \tabularnewline
270054.686502036 \tabularnewline
10571.6685448512 \tabularnewline
31929.4959692707 \tabularnewline
49416.7556167589 \tabularnewline
143300.943168086 \tabularnewline
-1098758.03595845 \tabularnewline
1651400.84894136 \tabularnewline
30718.0877210465 \tabularnewline
66443.0808558891 \tabularnewline
1095607.25594889 \tabularnewline
1124501.20616418 \tabularnewline
485219.143100054 \tabularnewline
325783.133459779 \tabularnewline
\hline
\end{tabular}
%Source: https://freestatistics.org/blog/index.php?pk=159323&T=2

[TABLE]
[ROW][C]Estimated ARIMA Residuals[/C][/ROW]
[ROW][C]Value[/C][/ROW]
[ROW][C]699.342713971417[/C][/ROW]
[ROW][C]56535.9474482707[/C][/ROW]
[ROW][C]102.711119245887[/C][/ROW]
[ROW][C]-437.774920394908[/C][/ROW]
[ROW][C]-647134.827709492[/C][/ROW]
[ROW][C]-15793.0302609407[/C][/ROW]
[ROW][C]2211078.67095535[/C][/ROW]
[ROW][C]762638.506287353[/C][/ROW]
[ROW][C]2351618.55054608[/C][/ROW]
[ROW][C]335447.01020016[/C][/ROW]
[ROW][C]452089.575302419[/C][/ROW]
[ROW][C]65300.2639453898[/C][/ROW]
[ROW][C]-139723.669080422[/C][/ROW]
[ROW][C]-30572.4688256385[/C][/ROW]
[ROW][C]-22652.937383906[/C][/ROW]
[ROW][C]5993.13546779995[/C][/ROW]
[ROW][C]-405934.466263837[/C][/ROW]
[ROW][C]1090405.18052603[/C][/ROW]
[ROW][C]-861488.37982981[/C][/ROW]
[ROW][C]-462190.795956643[/C][/ROW]
[ROW][C]-1959279.80166182[/C][/ROW]
[ROW][C]1095491.99795163[/C][/ROW]
[ROW][C]625261.056640679[/C][/ROW]
[ROW][C]89801.4998877103[/C][/ROW]
[ROW][C]-73999.5820580345[/C][/ROW]
[ROW][C]-22607.1743842799[/C][/ROW]
[ROW][C]-24541.7499900654[/C][/ROW]
[ROW][C]3145.83285957115[/C][/ROW]
[ROW][C]-348211.519180807[/C][/ROW]
[ROW][C]432096.490370396[/C][/ROW]
[ROW][C]1637420.09867308[/C][/ROW]
[ROW][C]285713.46494024[/C][/ROW]
[ROW][C]-1182596.58862977[/C][/ROW]
[ROW][C]-748545.89261853[/C][/ROW]
[ROW][C]-614342.040956679[/C][/ROW]
[ROW][C]-297024.330857652[/C][/ROW]
[ROW][C]-295741.979401422[/C][/ROW]
[ROW][C]-52031.7052144861[/C][/ROW]
[ROW][C]-36903.8394628976[/C][/ROW]
[ROW][C]-13328.2329363933[/C][/ROW]
[ROW][C]1430730.71164091[/C][/ROW]
[ROW][C]4850753.86980479[/C][/ROW]
[ROW][C]-5396528.17664417[/C][/ROW]
[ROW][C]-1228817.43952697[/C][/ROW]
[ROW][C]-166665.455536137[/C][/ROW]
[ROW][C]-260526.402237217[/C][/ROW]
[ROW][C]646050.566749679[/C][/ROW]
[ROW][C]577455.109552425[/C][/ROW]
[ROW][C]416954.661835116[/C][/ROW]
[ROW][C]118554.940598316[/C][/ROW]
[ROW][C]49087.093661771[/C][/ROW]
[ROW][C]27941.0370369703[/C][/ROW]
[ROW][C]-243142.303794975[/C][/ROW]
[ROW][C]-54267.2766570832[/C][/ROW]
[ROW][C]-2199974.74680762[/C][/ROW]
[ROW][C]-1253528.50680655[/C][/ROW]
[ROW][C]128855.905917724[/C][/ROW]
[ROW][C]-2829742.3298329[/C][/ROW]
[ROW][C]117535.968140384[/C][/ROW]
[ROW][C]-306866.452762589[/C][/ROW]
[ROW][C]-450918.397244376[/C][/ROW]
[ROW][C]30807.4292672515[/C][/ROW]
[ROW][C]-67668.1137353576[/C][/ROW]
[ROW][C]16077.4081487817[/C][/ROW]
[ROW][C]120552.179325221[/C][/ROW]
[ROW][C]-181220.995491295[/C][/ROW]
[ROW][C]378002.866011062[/C][/ROW]
[ROW][C]766649.439423028[/C][/ROW]
[ROW][C]-279667.503488597[/C][/ROW]
[ROW][C]1623244.27243556[/C][/ROW]
[ROW][C]274216.357481254[/C][/ROW]
[ROW][C]496522.745684367[/C][/ROW]
[ROW][C]270054.686502036[/C][/ROW]
[ROW][C]10571.6685448512[/C][/ROW]
[ROW][C]31929.4959692707[/C][/ROW]
[ROW][C]49416.7556167589[/C][/ROW]
[ROW][C]143300.943168086[/C][/ROW]
[ROW][C]-1098758.03595845[/C][/ROW]
[ROW][C]1651400.84894136[/C][/ROW]
[ROW][C]30718.0877210465[/C][/ROW]
[ROW][C]66443.0808558891[/C][/ROW]
[ROW][C]1095607.25594889[/C][/ROW]
[ROW][C]1124501.20616418[/C][/ROW]
[ROW][C]485219.143100054[/C][/ROW]
[ROW][C]325783.133459779[/C][/ROW]
[/TABLE]
Source: https://freestatistics.org/blog/index.php?pk=159323&T=2

Globally Unique Identifier (entire table): ba.freestatistics.org/blog/index.php?pk=159323&T=2

As an alternative you can also use a QR Code:  

The GUIDs for individual cells are displayed in the table below:

Estimated ARIMA Residuals
Value
699.342713971417
56535.9474482707
102.711119245887
-437.774920394908
-647134.827709492
-15793.0302609407
2211078.67095535
762638.506287353
2351618.55054608
335447.01020016
452089.575302419
65300.2639453898
-139723.669080422
-30572.4688256385
-22652.937383906
5993.13546779995
-405934.466263837
1090405.18052603
-861488.37982981
-462190.795956643
-1959279.80166182
1095491.99795163
625261.056640679
89801.4998877103
-73999.5820580345
-22607.1743842799
-24541.7499900654
3145.83285957115
-348211.519180807
432096.490370396
1637420.09867308
285713.46494024
-1182596.58862977
-748545.89261853
-614342.040956679
-297024.330857652
-295741.979401422
-52031.7052144861
-36903.8394628976
-13328.2329363933
1430730.71164091
4850753.86980479
-5396528.17664417
-1228817.43952697
-166665.455536137
-260526.402237217
646050.566749679
577455.109552425
416954.661835116
118554.940598316
49087.093661771
27941.0370369703
-243142.303794975
-54267.2766570832
-2199974.74680762
-1253528.50680655
128855.905917724
-2829742.3298329
117535.968140384
-306866.452762589
-450918.397244376
30807.4292672515
-67668.1137353576
16077.4081487817
120552.179325221
-181220.995491295
378002.866011062
766649.439423028
-279667.503488597
1623244.27243556
274216.357481254
496522.745684367
270054.686502036
10571.6685448512
31929.4959692707
49416.7556167589
143300.943168086
-1098758.03595845
1651400.84894136
30718.0877210465
66443.0808558891
1095607.25594889
1124501.20616418
485219.143100054
325783.133459779


Parameters (Session):
par1 = FALSE ; par2 = 1 ; par3 = 0 ; par4 = 1 ; par5 = 12 ; par6 = 3 ; par7 = 1 ; par8 = 1 ; par9 = 1 ;
Parameters (R input):
par1 = FALSE ; par2 = 1 ; par3 = 0 ; par4 = 1 ; par5 = 12 ; par6 = 3 ; par7 = 1 ; par8 = 1 ; par9 = 1 ;
R code (references can be found in the software module):
library(lattice)
if (par1 == 'TRUE') par1 <- TRUE
if (par1 == 'FALSE') par1 <- FALSE
par2 <- as.numeric(par2) #Box-Cox lambda transformation parameter
par3 <- as.numeric(par3) #degree of non-seasonal differencing
par4 <- as.numeric(par4) #degree of seasonal differencing
par5 <- as.numeric(par5) #seasonal period
par6 <- as.numeric(par6) #degree (p) of the non-seasonal AR(p) polynomial
par7 <- as.numeric(par7) #degree (q) of the non-seasonal MA(q) polynomial
par8 <- as.numeric(par8) #degree (P) of the seasonal AR(P) polynomial
par9 <- as.numeric(par9) #degree (Q) of the seasonal MA(Q) polynomial
armaGR <- function(arima.out, names, n){
try1 <- arima.out$coef
try2 <- sqrt(diag(arima.out$var.coef))
try.data.frame <- data.frame(matrix(NA,ncol=4,nrow=length(names)))
dimnames(try.data.frame) <- list(names,c('coef','std','tstat','pv'))
try.data.frame[,1] <- try1
for(i in 1:length(try2)) try.data.frame[which(rownames(try.data.frame)==names(try2)[i]),2] <- try2[i]
try.data.frame[,3] <- try.data.frame[,1] / try.data.frame[,2]
try.data.frame[,4] <- round((1-pt(abs(try.data.frame[,3]),df=n-(length(try2)+1)))*2,5)
vector <- rep(NA,length(names))
vector[is.na(try.data.frame[,4])] <- 0
maxi <- which.max(try.data.frame[,4])
continue <- max(try.data.frame[,4],na.rm=TRUE) > .05
vector[maxi] <- 0
list(summary=try.data.frame,next.vector=vector,continue=continue)
}
arimaSelect <- function(series, order=c(13,0,0), seasonal=list(order=c(2,0,0),period=12), include.mean=F){
nrc <- order[1]+order[3]+seasonal$order[1]+seasonal$order[3]
coeff <- matrix(NA, nrow=nrc*2, ncol=nrc)
pval <- matrix(NA, nrow=nrc*2, ncol=nrc)
mylist <- rep(list(NULL), nrc)
names <- NULL
if(order[1] > 0) names <- paste('ar',1:order[1],sep='')
if(order[3] > 0) names <- c( names , paste('ma',1:order[3],sep='') )
if(seasonal$order[1] > 0) names <- c(names, paste('sar',1:seasonal$order[1],sep=''))
if(seasonal$order[3] > 0) names <- c(names, paste('sma',1:seasonal$order[3],sep=''))
arima.out <- arima(series, order=order, seasonal=seasonal, include.mean=include.mean, method='ML')
mylist[[1]] <- arima.out
last.arma <- armaGR(arima.out, names, length(series))
mystop <- FALSE
i <- 1
coeff[i,] <- last.arma[[1]][,1]
pval [i,] <- last.arma[[1]][,4]
i <- 2
aic <- arima.out$aic
while(!mystop){
mylist[[i]] <- arima.out
arima.out <- arima(series, order=order, seasonal=seasonal, include.mean=include.mean, method='ML', fixed=last.arma$next.vector)
aic <- c(aic, arima.out$aic)
last.arma <- armaGR(arima.out, names, length(series))
mystop <- !last.arma$continue
coeff[i,] <- last.arma[[1]][,1]
pval [i,] <- last.arma[[1]][,4]
i <- i+1
}
list(coeff, pval, mylist, aic=aic)
}
arimaSelectplot <- function(arimaSelect.out,noms,choix){
noms <- names(arimaSelect.out[[3]][[1]]$coef)
coeff <- arimaSelect.out[[1]]
k <- min(which(is.na(coeff[,1])))-1
coeff <- coeff[1:k,]
pval <- arimaSelect.out[[2]][1:k,]
aic <- arimaSelect.out$aic[1:k]
coeff[coeff==0] <- NA
n <- ncol(coeff)
if(missing(choix)) choix <- k
layout(matrix(c(1,1,1,2,
3,3,3,2,
3,3,3,4,
5,6,7,7),nr=4),
widths=c(10,35,45,15),
heights=c(30,30,15,15))
couleurs <- rainbow(75)[1:50]#(50)
ticks <- pretty(coeff)
par(mar=c(1,1,3,1))
plot(aic,k:1-.5,type='o',pch=21,bg='blue',cex=2,axes=F,lty=2,xpd=NA)
points(aic[choix],k-choix+.5,pch=21,cex=4,bg=2,xpd=NA)
title('aic',line=2)
par(mar=c(3,0,0,0))
plot(0,axes=F,xlab='',ylab='',xlim=range(ticks),ylim=c(.1,1))
rect(xleft = min(ticks) + (0:49)/50*(max(ticks)-min(ticks)),
xright = min(ticks) + (1:50)/50*(max(ticks)-min(ticks)),
ytop = rep(1,50),
ybottom= rep(0,50),col=couleurs,border=NA)
axis(1,ticks)
rect(xleft=min(ticks),xright=max(ticks),ytop=1,ybottom=0)
text(mean(coeff,na.rm=T),.5,'coefficients',cex=2,font=2)
par(mar=c(1,1,3,1))
image(1:n,1:k,t(coeff[k:1,]),axes=F,col=couleurs,zlim=range(ticks))
for(i in 1:n) for(j in 1:k) if(!is.na(coeff[j,i])) {
if(pval[j,i]<.01) symb = 'green'
else if( (pval[j,i]<.05) & (pval[j,i]>=.01)) symb = 'orange'
else if( (pval[j,i]<.1) & (pval[j,i]>=.05)) symb = 'red'
else symb = 'black'
polygon(c(i+.5 ,i+.2 ,i+.5 ,i+.5),
c(k-j+0.5,k-j+0.5,k-j+0.8,k-j+0.5),
col=symb)
if(j==choix) {
rect(xleft=i-.5,
xright=i+.5,
ybottom=k-j+1.5,
ytop=k-j+.5,
lwd=4)
text(i,
k-j+1,
round(coeff[j,i],2),
cex=1.2,
font=2)
}
else{
rect(xleft=i-.5,xright=i+.5,ybottom=k-j+1.5,ytop=k-j+.5)
text(i,k-j+1,round(coeff[j,i],2),cex=1.2,font=1)
}
}
axis(3,1:n,noms)
par(mar=c(0.5,0,0,0.5))
plot(0,axes=F,xlab='',ylab='',type='n',xlim=c(0,8),ylim=c(-.2,.8))
cols <- c('green','orange','red','black')
niv <- c('0','0.01','0.05','0.1')
for(i in 0:3){
polygon(c(1+2*i ,1+2*i ,1+2*i-.5 ,1+2*i),
c(.4 ,.7 , .4 , .4),
col=cols[i+1])
text(2*i,0.5,niv[i+1],cex=1.5)
}
text(8,.5,1,cex=1.5)
text(4,0,'p-value',cex=2)
box()
residus <- arimaSelect.out[[3]][[choix]]$res
par(mar=c(1,2,4,1))
acf(residus,main='')
title('acf',line=.5)
par(mar=c(1,2,4,1))
pacf(residus,main='')
title('pacf',line=.5)
par(mar=c(2,2,4,1))
qqnorm(residus,main='')
title('qq-norm',line=.5)
qqline(residus)
residus
}
if (par2 == 0) x <- log(x)
if (par2 != 0) x <- x^par2
(selection <- arimaSelect(x, order=c(par6,par3,par7), seasonal=list(order=c(par8,par4,par9), period=par5)))
bitmap(file='test1.png')
resid <- arimaSelectplot(selection)
dev.off()
resid
bitmap(file='test2.png')
acf(resid,length(resid)/2, main='Residual Autocorrelation Function')
dev.off()
bitmap(file='test3.png')
pacf(resid,length(resid)/2, main='Residual Partial Autocorrelation Function')
dev.off()
bitmap(file='test4.png')
cpgram(resid, main='Residual Cumulative Periodogram')
dev.off()
bitmap(file='test5.png')
hist(resid, main='Residual Histogram', xlab='values of Residuals')
dev.off()
bitmap(file='test6.png')
densityplot(~resid,col='black',main='Residual Density Plot', xlab='values of Residuals')
dev.off()
bitmap(file='test7.png')
qqnorm(resid, main='Residual Normal Q-Q Plot')
qqline(resid)
dev.off()
ncols <- length(selection[[1]][1,])
nrows <- length(selection[[2]][,1])-1
load(file='createtable')
a<-table.start()
a<-table.row.start(a)
a<-table.element(a,'ARIMA Parameter Estimation and Backward Selection', ncols+1,TRUE)
a<-table.row.end(a)
a<-table.row.start(a)
a<-table.element(a,'Iteration', header=TRUE)
for (i in 1:ncols) {
a<-table.element(a,names(selection[[3]][[1]]$coef)[i],header=TRUE)
}
a<-table.row.end(a)
for (j in 1:nrows) {
a<-table.row.start(a)
mydum <- 'Estimates ('
mydum <- paste(mydum,j)
mydum <- paste(mydum,')')
a<-table.element(a,mydum, header=TRUE)
for (i in 1:ncols) {
a<-table.element(a,round(selection[[1]][j,i],4))
}
a<-table.row.end(a)
a<-table.row.start(a)
a<-table.element(a,'(p-val)', header=TRUE)
for (i in 1:ncols) {
mydum <- '('
mydum <- paste(mydum,round(selection[[2]][j,i],4),sep='')
mydum <- paste(mydum,')')
a<-table.element(a,mydum)
}
a<-table.row.end(a)
}
a<-table.end(a)
table.save(a,file='mytable.tab')
a<-table.start()
a<-table.row.start(a)
a<-table.element(a,'Estimated ARIMA Residuals', 1,TRUE)
a<-table.row.end(a)
a<-table.row.start(a)
a<-table.element(a,'Value', 1,TRUE)
a<-table.row.end(a)
for (i in (par4*par5+par3):length(resid)) {
a<-table.row.start(a)
a<-table.element(a,resid[i])
a<-table.row.end(a)
}
a<-table.end(a)
table.save(a,file='mytable1.tab')