Free Statistics
of Irreproducible Research!
Description of Statistical Computation | |||||||||||||||||||||||||||||||||||||||||
|---|---|---|---|---|---|---|---|---|---|---|---|---|---|---|---|---|---|---|---|---|---|---|---|---|---|---|---|---|---|---|---|---|---|---|---|---|---|---|---|---|---|
| Author's title | |||||||||||||||||||||||||||||||||||||||||
| Author | *Unverified author* | ||||||||||||||||||||||||||||||||||||||||
| R Software Module | -- | ||||||||||||||||||||||||||||||||||||||||
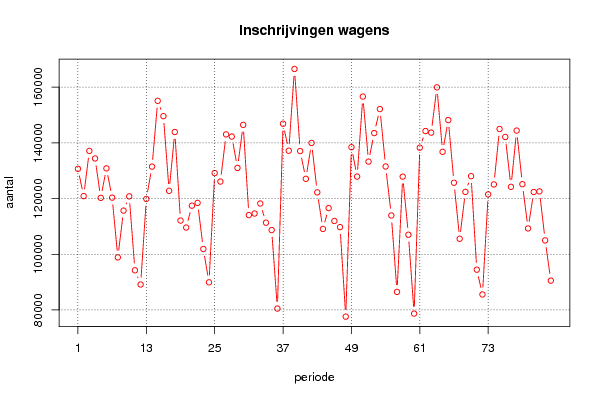
| Title produced by software | Univariate Data Series | ||||||||||||||||||||||||||||||||||||||||
| Date of computation | Sat, 17 Dec 2011 08:30:27 -0500 | ||||||||||||||||||||||||||||||||||||||||
| Cite this page as follows | Statistical Computations at FreeStatistics.org, Office for Research Development and Education, URL https://freestatistics.org/blog/index.php?v=date/2011/Dec/17/t1324128643uzov8gllutf2fnd.htm/, Retrieved Fri, 26 Apr 2024 10:13:24 +0000 | ||||||||||||||||||||||||||||||||||||||||
| Statistical Computations at FreeStatistics.org, Office for Research Development and Education, URL https://freestatistics.org/blog/index.php?pk=156273, Retrieved Fri, 26 Apr 2024 10:13:24 +0000 | |||||||||||||||||||||||||||||||||||||||||
| QR Codes: | |||||||||||||||||||||||||||||||||||||||||
|
| |||||||||||||||||||||||||||||||||||||||||
| Original text written by user: | |||||||||||||||||||||||||||||||||||||||||
| IsPrivate? | No (this computation is public) | ||||||||||||||||||||||||||||||||||||||||
| User-defined keywords | |||||||||||||||||||||||||||||||||||||||||
| Estimated Impact | 145 | ||||||||||||||||||||||||||||||||||||||||
Tree of Dependent Computations | |||||||||||||||||||||||||||||||||||||||||
| Family? (F = Feedback message, R = changed R code, M = changed R Module, P = changed Parameters, D = changed Data) | |||||||||||||||||||||||||||||||||||||||||
| - [Univariate Explorative Data Analysis] [Run Sequence gebo...] [2008-12-12 13:32:37] [76963dc1903f0f612b6153510a3818cf] - R D [Univariate Explorative Data Analysis] [Run Sequence gebo...] [2008-12-17 12:14:40] [76963dc1903f0f612b6153510a3818cf] - [Univariate Explorative Data Analysis] [Run Sequence Plot...] [2008-12-22 18:19:51] [1ce0d16c8f4225c977b42c8fa93bc163] - RMP [Univariate Data Series] [Identifying Integ...] [2009-11-22 12:08:06] [b98453cac15ba1066b407e146608df68] - PD [Univariate Data Series] [WS 8, maandelijks...] [2010-11-28 09:47:18] [d946de7cca328fbcf207448a112523ab] - PD [Univariate Data Series] [WS 8, maandelijks...] [2010-11-28 12:21:51] [d946de7cca328fbcf207448a112523ab] - PD [Univariate Data Series] [Workshop 8, maand...] [2010-11-28 19:48:13] [d946de7cca328fbcf207448a112523ab] - R PD [Univariate Data Series] [Paper Inschrijvin...] [2010-12-18 14:20:05] [3635fb7041b1998c5a1332cf9de22bce] - RMP [Univariate Data Series] [] [2011-12-17 13:30:27] [d41d8cd98f00b204e9800998ecf8427e] [Current] | |||||||||||||||||||||||||||||||||||||||||
| Feedback Forum | |||||||||||||||||||||||||||||||||||||||||
Post a new message | |||||||||||||||||||||||||||||||||||||||||
Dataset | |||||||||||||||||||||||||||||||||||||||||
| Dataseries X: | |||||||||||||||||||||||||||||||||||||||||
130 678 120 877 137 114 134 406 120 262 130 846 120 343 98 881 115 678 120 796 94 261 89 151 119 880 131 468 155 089 149 581 122 788 143 900 112 115 109 600 117 446 118 456 101 901 89 940 129 143 126 102 143 048 142 258 131 011 146 471 114 073 114 642 118 226 111 338 108 701 80 512 146 865 137 179 166 536 137 070 127 090 139 966 122 243 109 097 116 591 111 964 109 754 77 609 138 445 127 901 156 615 133 264 143 521 152 139 131 523 113 925 86 495 127 877 107 017 78 716 138 278 144 238 143 679 159 932 136 781 148 173 125 673 105 573 122 405 128 045 94 467 85 573 121 501 125 074 144 979 142 120 124 213 144 407 125 170 109 267 122 354 122 589 104 982 90 542 | |||||||||||||||||||||||||||||||||||||||||
Tables (Output of Computation) | |||||||||||||||||||||||||||||||||||||||||
| |||||||||||||||||||||||||||||||||||||||||
Figures (Output of Computation) | |||||||||||||||||||||||||||||||||||||||||
Input Parameters & R Code | |||||||||||||||||||||||||||||||||||||||||
| Parameters (Session): | |||||||||||||||||||||||||||||||||||||||||
| par1 = Inschrijvingen nieuwe en tweedehands voertuigen ; par2 = http://www.mobilit.fgov.be/nl/index.htm ; par3 = Inschrijvingen wagens voor de periode 2003-2009 ; par4 = 12 ; | |||||||||||||||||||||||||||||||||||||||||
| Parameters (R input): | |||||||||||||||||||||||||||||||||||||||||
| par1 = Inschrijvingen nieuwe en tweedehands voertuigen ; par2 = http://www.mobilit.fgov.be/nl/index.htm ; par3 = Inschrijvingen wagens voor de periode 2003-2009 ; par4 = 12 ; par5 = ; par6 = ; par7 = ; par8 = ; par9 = ; par10 = ; par11 = ; par12 = ; par13 = ; par14 = ; par15 = ; par16 = ; par17 = ; par18 = ; par19 = ; par20 = ; | |||||||||||||||||||||||||||||||||||||||||
| R code (references can be found in the software module): | |||||||||||||||||||||||||||||||||||||||||
if (par4 != 'No season') { | |||||||||||||||||||||||||||||||||||||||||