Free Statistics

of Irreproducible Research!

Author's title

Author*The author of this computation has been verified*
R Software Modulerwasp_arimabackwardselection.wasp
Title produced by softwareARIMA Backward Selection
Date of computationSun, 11 Dec 2011 05:44:54 -0500
Cite this page as followsStatistical Computations at FreeStatistics.org, Office for Research Development and Education, URL https://freestatistics.org/blog/index.php?v=date/2011/Dec/11/t13236003757e2q543vlo1oajr.htm/, Retrieved Mon, 29 Apr 2024 06:47:36 +0000
Statistical Computations at FreeStatistics.org, Office for Research Development and Education, URL https://freestatistics.org/blog/index.php?pk=153668, Retrieved Mon, 29 Apr 2024 06:47:36 +0000
QR Codes:

Original text written by user:
IsPrivate?No (this computation is public)
User-defined keywords
Estimated Impact201
Family? (F = Feedback message, R = changed R code, M = changed R Module, P = changed Parameters, D = changed Data)
-     [Univariate Explorative Data Analysis] [Run Sequence gebo...] [2008-12-12 13:32:37] [76963dc1903f0f612b6153510a3818cf]
- R  D  [Univariate Explorative Data Analysis] [Run Sequence gebo...] [2008-12-17 12:14:40] [76963dc1903f0f612b6153510a3818cf]
-         [Univariate Explorative Data Analysis] [Run Sequence Plot...] [2008-12-22 18:19:51] [1ce0d16c8f4225c977b42c8fa93bc163]
- RMP       [Univariate Data Series] [Identifying Integ...] [2009-11-22 12:08:06] [b98453cac15ba1066b407e146608df68]
- RMP         [Standard Deviation-Mean Plot] [Births] [2010-11-29 10:52:49] [b98453cac15ba1066b407e146608df68]
- RMP           [ARIMA Backward Selection] [Births] [2010-11-29 17:42:52] [b98453cac15ba1066b407e146608df68]
-   PD            [ARIMA Backward Selection] [paper ARIMA (fout...] [2011-12-09 13:07:59] [7e261c986c934df955dd3ac53e9d45c6]
- R P                 [ARIMA Backward Selection] [paper - ARIMA] [2011-12-11 10:44:54] [13dfa60174f50d862e8699db2153bfc5] [Current]
Feedback Forum

Post a new message
Dataseries X:
617
614
647
580
614
636
388
356
639
753
611
639
630
586
695
552
619
681
421
307
754
690
644
643
608
651
691
627
634
731
475
337
803
722
590
724
627
696
825
677
656
785
412
352
839
729
696
641
695
638
762
635
721
854
418
367
824
687
601
676
740
691
683
594
729
731
386
331
706
715
657
653
642
643
718
654
632
731
392
344
792
852
649
629
685
617
715
715
629
916
531
357
917
828
708
858
775
785
1006
789
734
906
532
387
991
841
892
782
811
792
978
773
796
946
594
438
1023
868
791
760
779
852
1001
734
996
869
599
426
1138


Summary of computational transaction
Raw Inputview raw input (R code)
Raw Outputview raw output of R engine
Computing time4 seconds
R Server'Gwilym Jenkins' @ jenkins.wessa.net

\begin{tabular}{lllllllll}
\hline
Summary of computational transaction \tabularnewline
Raw Input & view raw input (R code)  \tabularnewline
Raw Output & view raw output of R engine  \tabularnewline
Computing time & 4 seconds \tabularnewline
R Server & 'Gwilym Jenkins' @ jenkins.wessa.net \tabularnewline
\hline
\end{tabular}
%Source: https://freestatistics.org/blog/index.php?pk=153668&T=0

[TABLE]
[ROW][C]Summary of computational transaction[/C][/ROW]
[ROW][C]Raw Input[/C][C]view raw input (R code) [/C][/ROW]
[ROW][C]Raw Output[/C][C]view raw output of R engine [/C][/ROW]
[ROW][C]Computing time[/C][C]4 seconds[/C][/ROW]
[ROW][C]R Server[/C][C]'Gwilym Jenkins' @ jenkins.wessa.net[/C][/ROW]
[/TABLE]
Source: https://freestatistics.org/blog/index.php?pk=153668&T=0

Globally Unique Identifier (entire table): ba.freestatistics.org/blog/index.php?pk=153668&T=0

As an alternative you can also use a QR Code:  

The GUIDs for individual cells are displayed in the table below:

Summary of computational transaction
Raw Inputview raw input (R code)
Raw Outputview raw output of R engine
Computing time4 seconds
R Server'Gwilym Jenkins' @ jenkins.wessa.net


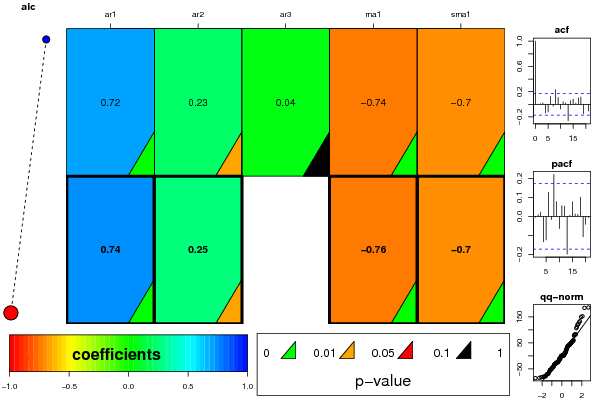
ARIMA Parameter Estimation and Backward Selection
Iterationar1ar2ar3ma1sma1
Estimates ( 1 )0.71650.23070.0409-0.7423-0.6986
(p-val)(0 )(0.0485 )(0.7252 )(0 )(0 )
Estimates ( 2 )0.74150.24750-0.7592-0.6955
(p-val)(0 )(0.0196 )(NA )(0 )(0 )
Estimates ( 3 )NANANANANA
(p-val)(NA )(NA )(NA )(NA )(NA )
Estimates ( 4 )NANANANANA
(p-val)(NA )(NA )(NA )(NA )(NA )
Estimates ( 5 )NANANANANA
(p-val)(NA )(NA )(NA )(NA )(NA )
Estimates ( 6 )NANANANANA
(p-val)(NA )(NA )(NA )(NA )(NA )
Estimates ( 7 )NANANANANA
(p-val)(NA )(NA )(NA )(NA )(NA )
Estimates ( 8 )NANANANANA
(p-val)(NA )(NA )(NA )(NA )(NA )
Estimates ( 9 )NANANANANA
(p-val)(NA )(NA )(NA )(NA )(NA )

\begin{tabular}{lllllllll}
\hline
ARIMA Parameter Estimation and Backward Selection \tabularnewline
Iteration & ar1 & ar2 & ar3 & ma1 & sma1 \tabularnewline
Estimates ( 1 ) & 0.7165 & 0.2307 & 0.0409 & -0.7423 & -0.6986 \tabularnewline
(p-val) & (0 ) & (0.0485 ) & (0.7252 ) & (0 ) & (0 ) \tabularnewline
Estimates ( 2 ) & 0.7415 & 0.2475 & 0 & -0.7592 & -0.6955 \tabularnewline
(p-val) & (0 ) & (0.0196 ) & (NA ) & (0 ) & (0 ) \tabularnewline
Estimates ( 3 ) & NA & NA & NA & NA & NA \tabularnewline
(p-val) & (NA ) & (NA ) & (NA ) & (NA ) & (NA ) \tabularnewline
Estimates ( 4 ) & NA & NA & NA & NA & NA \tabularnewline
(p-val) & (NA ) & (NA ) & (NA ) & (NA ) & (NA ) \tabularnewline
Estimates ( 5 ) & NA & NA & NA & NA & NA \tabularnewline
(p-val) & (NA ) & (NA ) & (NA ) & (NA ) & (NA ) \tabularnewline
Estimates ( 6 ) & NA & NA & NA & NA & NA \tabularnewline
(p-val) & (NA ) & (NA ) & (NA ) & (NA ) & (NA ) \tabularnewline
Estimates ( 7 ) & NA & NA & NA & NA & NA \tabularnewline
(p-val) & (NA ) & (NA ) & (NA ) & (NA ) & (NA ) \tabularnewline
Estimates ( 8 ) & NA & NA & NA & NA & NA \tabularnewline
(p-val) & (NA ) & (NA ) & (NA ) & (NA ) & (NA ) \tabularnewline
Estimates ( 9 ) & NA & NA & NA & NA & NA \tabularnewline
(p-val) & (NA ) & (NA ) & (NA ) & (NA ) & (NA ) \tabularnewline
\hline
\end{tabular}
%Source: https://freestatistics.org/blog/index.php?pk=153668&T=1

[TABLE]
[ROW][C]ARIMA Parameter Estimation and Backward Selection[/C][/ROW]
[ROW][C]Iteration[/C][C]ar1[/C][C]ar2[/C][C]ar3[/C][C]ma1[/C][C]sma1[/C][/ROW]
[ROW][C]Estimates ( 1 )[/C][C]0.7165[/C][C]0.2307[/C][C]0.0409[/C][C]-0.7423[/C][C]-0.6986[/C][/ROW]
[ROW][C](p-val)[/C][C](0 )[/C][C](0.0485 )[/C][C](0.7252 )[/C][C](0 )[/C][C](0 )[/C][/ROW]
[ROW][C]Estimates ( 2 )[/C][C]0.7415[/C][C]0.2475[/C][C]0[/C][C]-0.7592[/C][C]-0.6955[/C][/ROW]
[ROW][C](p-val)[/C][C](0 )[/C][C](0.0196 )[/C][C](NA )[/C][C](0 )[/C][C](0 )[/C][/ROW]
[ROW][C]Estimates ( 3 )[/C][C]NA[/C][C]NA[/C][C]NA[/C][C]NA[/C][C]NA[/C][/ROW]
[ROW][C](p-val)[/C][C](NA )[/C][C](NA )[/C][C](NA )[/C][C](NA )[/C][C](NA )[/C][/ROW]
[ROW][C]Estimates ( 4 )[/C][C]NA[/C][C]NA[/C][C]NA[/C][C]NA[/C][C]NA[/C][/ROW]
[ROW][C](p-val)[/C][C](NA )[/C][C](NA )[/C][C](NA )[/C][C](NA )[/C][C](NA )[/C][/ROW]
[ROW][C]Estimates ( 5 )[/C][C]NA[/C][C]NA[/C][C]NA[/C][C]NA[/C][C]NA[/C][/ROW]
[ROW][C](p-val)[/C][C](NA )[/C][C](NA )[/C][C](NA )[/C][C](NA )[/C][C](NA )[/C][/ROW]
[ROW][C]Estimates ( 6 )[/C][C]NA[/C][C]NA[/C][C]NA[/C][C]NA[/C][C]NA[/C][/ROW]
[ROW][C](p-val)[/C][C](NA )[/C][C](NA )[/C][C](NA )[/C][C](NA )[/C][C](NA )[/C][/ROW]
[ROW][C]Estimates ( 7 )[/C][C]NA[/C][C]NA[/C][C]NA[/C][C]NA[/C][C]NA[/C][/ROW]
[ROW][C](p-val)[/C][C](NA )[/C][C](NA )[/C][C](NA )[/C][C](NA )[/C][C](NA )[/C][/ROW]
[ROW][C]Estimates ( 8 )[/C][C]NA[/C][C]NA[/C][C]NA[/C][C]NA[/C][C]NA[/C][/ROW]
[ROW][C](p-val)[/C][C](NA )[/C][C](NA )[/C][C](NA )[/C][C](NA )[/C][C](NA )[/C][/ROW]
[ROW][C]Estimates ( 9 )[/C][C]NA[/C][C]NA[/C][C]NA[/C][C]NA[/C][C]NA[/C][/ROW]
[ROW][C](p-val)[/C][C](NA )[/C][C](NA )[/C][C](NA )[/C][C](NA )[/C][C](NA )[/C][/ROW]
[/TABLE]
Source: https://freestatistics.org/blog/index.php?pk=153668&T=1

Globally Unique Identifier (entire table): ba.freestatistics.org/blog/index.php?pk=153668&T=1

As an alternative you can also use a QR Code:  

The GUIDs for individual cells are displayed in the table below:

ARIMA Parameter Estimation and Backward Selection
Iterationar1ar2ar3ma1sma1
Estimates ( 1 )0.71650.23070.0409-0.7423-0.6986
(p-val)(0 )(0.0485 )(0.7252 )(0 )(0 )
Estimates ( 2 )0.74150.24750-0.7592-0.6955
(p-val)(0 )(0.0196 )(NA )(0 )(0 )
Estimates ( 3 )NANANANANA
(p-val)(NA )(NA )(NA )(NA )(NA )
Estimates ( 4 )NANANANANA
(p-val)(NA )(NA )(NA )(NA )(NA )
Estimates ( 5 )NANANANANA
(p-val)(NA )(NA )(NA )(NA )(NA )
Estimates ( 6 )NANANANANA
(p-val)(NA )(NA )(NA )(NA )(NA )
Estimates ( 7 )NANANANANA
(p-val)(NA )(NA )(NA )(NA )(NA )
Estimates ( 8 )NANANANANA
(p-val)(NA )(NA )(NA )(NA )(NA )
Estimates ( 9 )NANANANANA
(p-val)(NA )(NA )(NA )(NA )(NA )


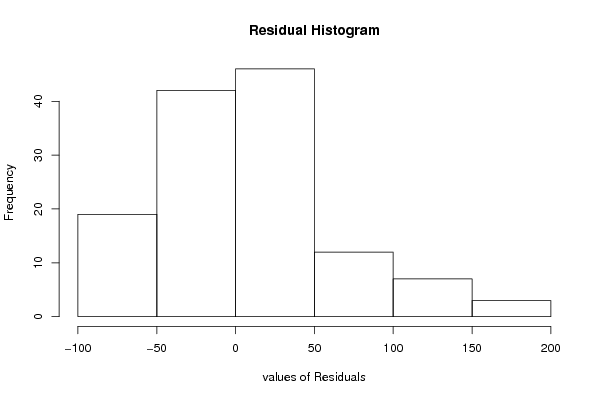
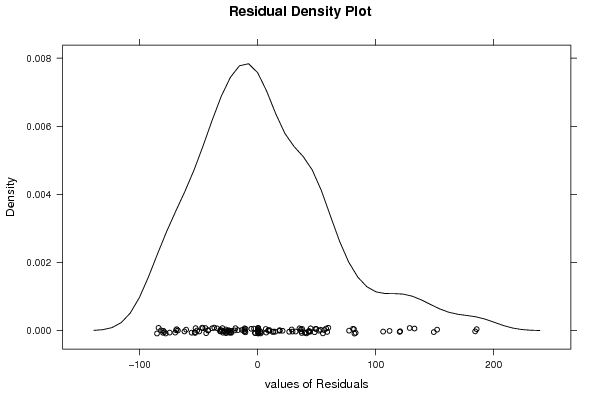
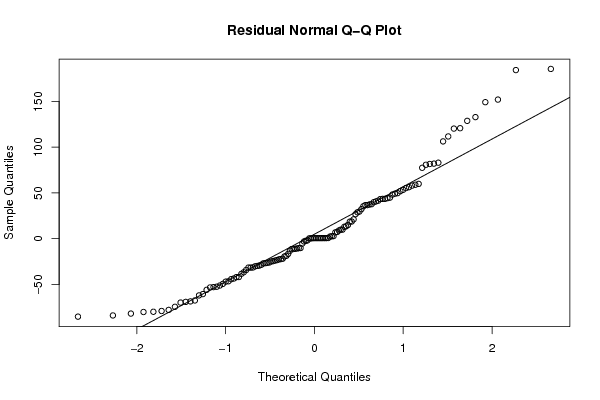
Estimated ARIMA Residuals
Value
0.638997413419203
9.90389303197282
-22.3023122314741
36.7800822877371
-19.3973585930276
-1.82728173431642
36.724066486773
28.8944188935952
-46.5447482676979
81.6669904922509
-49.3930539014323
7.32370593938105
-2.30938667138516
-24.7990807360454
37.724523686561
13.5082463734854
44.8741193262163
2.82810059127998
43.358748956677
44.3143722315104
-21.8938057081436
58.0924837106478
-26.3069296564498
-79.0312269035011
41.5110259041723
-13.1817192637497
39.9735020498047
111.800865424203
49.7870353541202
-26.8800725354202
26.7716077443333
-77.8312732647454
-46.9549404660863
48.2440783186885
-26.7544278903347
32.2685752571835
-69.0885472315691
18.7581149930453
-44.2107589570958
-10.9995953045413
-16.6543983695614
55.3520149024308
106.378953587588
-41.9150565981803
-31.5936647886223
2.35602637665503
-74.4547743387148
-81.8542252953119
-11.3023881661074
82.0619621095758
37.4332373170131
-85.2268950398416
-67.5118324553083
49.1631848298552
-34.2088759546933
-52.5269451126761
-24.5171134155982
-79.8851589272531
9.86643963696357
53.4082765899247
8.91844754070827
-25.9484302522257
-10.1960784792828
6.90086621046144
51.9597681113942
-38.4301255407228
-23.3767806921408
-10.28301333605
15.0050434191045
43.5780911400606
152.09757895771
18.6904275447767
-60.540320278058
-11.2583864862485
-52.9470897150597
-22.5504419972589
83.0911969680649
-36.7048015722767
149.264384623041
120.380162891832
-23.8078320520287
80.8150517860111
21.1674150000616
-3.0154230265066
132.923103119384
35.4977837293873
43.5435725692647
184.367520210177
29.6390549620705
-68.5328349926419
-41.9816152638818
-43.5509106544566
-83.9119155983483
58.9892080666153
-30.2040417200046
120.801371286879
-29.8240104859906
-18.7532008640895
-10.7271401794726
59.9403759515053
-29.3373778448672
-5.3423058820943
2.64944519118931
13.0102449176301
-31.5183557191033
40.7517317806003
-31.602546611366
-53.2953128677026
-80.1246742013271
-51.1754373539952
56.3537281731507
77.5270810035798
-61.9957902418702
185.595679151298
-69.8264776254453
-28.4868094222719
-55.9032935755958
128.862676946648

\begin{tabular}{lllllllll}
\hline
Estimated ARIMA Residuals \tabularnewline
Value \tabularnewline
0.638997413419203 \tabularnewline
9.90389303197282 \tabularnewline
-22.3023122314741 \tabularnewline
36.7800822877371 \tabularnewline
-19.3973585930276 \tabularnewline
-1.82728173431642 \tabularnewline
36.724066486773 \tabularnewline
28.8944188935952 \tabularnewline
-46.5447482676979 \tabularnewline
81.6669904922509 \tabularnewline
-49.3930539014323 \tabularnewline
7.32370593938105 \tabularnewline
-2.30938667138516 \tabularnewline
-24.7990807360454 \tabularnewline
37.724523686561 \tabularnewline
13.5082463734854 \tabularnewline
44.8741193262163 \tabularnewline
2.82810059127998 \tabularnewline
43.358748956677 \tabularnewline
44.3143722315104 \tabularnewline
-21.8938057081436 \tabularnewline
58.0924837106478 \tabularnewline
-26.3069296564498 \tabularnewline
-79.0312269035011 \tabularnewline
41.5110259041723 \tabularnewline
-13.1817192637497 \tabularnewline
39.9735020498047 \tabularnewline
111.800865424203 \tabularnewline
49.7870353541202 \tabularnewline
-26.8800725354202 \tabularnewline
26.7716077443333 \tabularnewline
-77.8312732647454 \tabularnewline
-46.9549404660863 \tabularnewline
48.2440783186885 \tabularnewline
-26.7544278903347 \tabularnewline
32.2685752571835 \tabularnewline
-69.0885472315691 \tabularnewline
18.7581149930453 \tabularnewline
-44.2107589570958 \tabularnewline
-10.9995953045413 \tabularnewline
-16.6543983695614 \tabularnewline
55.3520149024308 \tabularnewline
106.378953587588 \tabularnewline
-41.9150565981803 \tabularnewline
-31.5936647886223 \tabularnewline
2.35602637665503 \tabularnewline
-74.4547743387148 \tabularnewline
-81.8542252953119 \tabularnewline
-11.3023881661074 \tabularnewline
82.0619621095758 \tabularnewline
37.4332373170131 \tabularnewline
-85.2268950398416 \tabularnewline
-67.5118324553083 \tabularnewline
49.1631848298552 \tabularnewline
-34.2088759546933 \tabularnewline
-52.5269451126761 \tabularnewline
-24.5171134155982 \tabularnewline
-79.8851589272531 \tabularnewline
9.86643963696357 \tabularnewline
53.4082765899247 \tabularnewline
8.91844754070827 \tabularnewline
-25.9484302522257 \tabularnewline
-10.1960784792828 \tabularnewline
6.90086621046144 \tabularnewline
51.9597681113942 \tabularnewline
-38.4301255407228 \tabularnewline
-23.3767806921408 \tabularnewline
-10.28301333605 \tabularnewline
15.0050434191045 \tabularnewline
43.5780911400606 \tabularnewline
152.09757895771 \tabularnewline
18.6904275447767 \tabularnewline
-60.540320278058 \tabularnewline
-11.2583864862485 \tabularnewline
-52.9470897150597 \tabularnewline
-22.5504419972589 \tabularnewline
83.0911969680649 \tabularnewline
-36.7048015722767 \tabularnewline
149.264384623041 \tabularnewline
120.380162891832 \tabularnewline
-23.8078320520287 \tabularnewline
80.8150517860111 \tabularnewline
21.1674150000616 \tabularnewline
-3.0154230265066 \tabularnewline
132.923103119384 \tabularnewline
35.4977837293873 \tabularnewline
43.5435725692647 \tabularnewline
184.367520210177 \tabularnewline
29.6390549620705 \tabularnewline
-68.5328349926419 \tabularnewline
-41.9816152638818 \tabularnewline
-43.5509106544566 \tabularnewline
-83.9119155983483 \tabularnewline
58.9892080666153 \tabularnewline
-30.2040417200046 \tabularnewline
120.801371286879 \tabularnewline
-29.8240104859906 \tabularnewline
-18.7532008640895 \tabularnewline
-10.7271401794726 \tabularnewline
59.9403759515053 \tabularnewline
-29.3373778448672 \tabularnewline
-5.3423058820943 \tabularnewline
2.64944519118931 \tabularnewline
13.0102449176301 \tabularnewline
-31.5183557191033 \tabularnewline
40.7517317806003 \tabularnewline
-31.602546611366 \tabularnewline
-53.2953128677026 \tabularnewline
-80.1246742013271 \tabularnewline
-51.1754373539952 \tabularnewline
56.3537281731507 \tabularnewline
77.5270810035798 \tabularnewline
-61.9957902418702 \tabularnewline
185.595679151298 \tabularnewline
-69.8264776254453 \tabularnewline
-28.4868094222719 \tabularnewline
-55.9032935755958 \tabularnewline
128.862676946648 \tabularnewline
\hline
\end{tabular}
%Source: https://freestatistics.org/blog/index.php?pk=153668&T=2

[TABLE]
[ROW][C]Estimated ARIMA Residuals[/C][/ROW]
[ROW][C]Value[/C][/ROW]
[ROW][C]0.638997413419203[/C][/ROW]
[ROW][C]9.90389303197282[/C][/ROW]
[ROW][C]-22.3023122314741[/C][/ROW]
[ROW][C]36.7800822877371[/C][/ROW]
[ROW][C]-19.3973585930276[/C][/ROW]
[ROW][C]-1.82728173431642[/C][/ROW]
[ROW][C]36.724066486773[/C][/ROW]
[ROW][C]28.8944188935952[/C][/ROW]
[ROW][C]-46.5447482676979[/C][/ROW]
[ROW][C]81.6669904922509[/C][/ROW]
[ROW][C]-49.3930539014323[/C][/ROW]
[ROW][C]7.32370593938105[/C][/ROW]
[ROW][C]-2.30938667138516[/C][/ROW]
[ROW][C]-24.7990807360454[/C][/ROW]
[ROW][C]37.724523686561[/C][/ROW]
[ROW][C]13.5082463734854[/C][/ROW]
[ROW][C]44.8741193262163[/C][/ROW]
[ROW][C]2.82810059127998[/C][/ROW]
[ROW][C]43.358748956677[/C][/ROW]
[ROW][C]44.3143722315104[/C][/ROW]
[ROW][C]-21.8938057081436[/C][/ROW]
[ROW][C]58.0924837106478[/C][/ROW]
[ROW][C]-26.3069296564498[/C][/ROW]
[ROW][C]-79.0312269035011[/C][/ROW]
[ROW][C]41.5110259041723[/C][/ROW]
[ROW][C]-13.1817192637497[/C][/ROW]
[ROW][C]39.9735020498047[/C][/ROW]
[ROW][C]111.800865424203[/C][/ROW]
[ROW][C]49.7870353541202[/C][/ROW]
[ROW][C]-26.8800725354202[/C][/ROW]
[ROW][C]26.7716077443333[/C][/ROW]
[ROW][C]-77.8312732647454[/C][/ROW]
[ROW][C]-46.9549404660863[/C][/ROW]
[ROW][C]48.2440783186885[/C][/ROW]
[ROW][C]-26.7544278903347[/C][/ROW]
[ROW][C]32.2685752571835[/C][/ROW]
[ROW][C]-69.0885472315691[/C][/ROW]
[ROW][C]18.7581149930453[/C][/ROW]
[ROW][C]-44.2107589570958[/C][/ROW]
[ROW][C]-10.9995953045413[/C][/ROW]
[ROW][C]-16.6543983695614[/C][/ROW]
[ROW][C]55.3520149024308[/C][/ROW]
[ROW][C]106.378953587588[/C][/ROW]
[ROW][C]-41.9150565981803[/C][/ROW]
[ROW][C]-31.5936647886223[/C][/ROW]
[ROW][C]2.35602637665503[/C][/ROW]
[ROW][C]-74.4547743387148[/C][/ROW]
[ROW][C]-81.8542252953119[/C][/ROW]
[ROW][C]-11.3023881661074[/C][/ROW]
[ROW][C]82.0619621095758[/C][/ROW]
[ROW][C]37.4332373170131[/C][/ROW]
[ROW][C]-85.2268950398416[/C][/ROW]
[ROW][C]-67.5118324553083[/C][/ROW]
[ROW][C]49.1631848298552[/C][/ROW]
[ROW][C]-34.2088759546933[/C][/ROW]
[ROW][C]-52.5269451126761[/C][/ROW]
[ROW][C]-24.5171134155982[/C][/ROW]
[ROW][C]-79.8851589272531[/C][/ROW]
[ROW][C]9.86643963696357[/C][/ROW]
[ROW][C]53.4082765899247[/C][/ROW]
[ROW][C]8.91844754070827[/C][/ROW]
[ROW][C]-25.9484302522257[/C][/ROW]
[ROW][C]-10.1960784792828[/C][/ROW]
[ROW][C]6.90086621046144[/C][/ROW]
[ROW][C]51.9597681113942[/C][/ROW]
[ROW][C]-38.4301255407228[/C][/ROW]
[ROW][C]-23.3767806921408[/C][/ROW]
[ROW][C]-10.28301333605[/C][/ROW]
[ROW][C]15.0050434191045[/C][/ROW]
[ROW][C]43.5780911400606[/C][/ROW]
[ROW][C]152.09757895771[/C][/ROW]
[ROW][C]18.6904275447767[/C][/ROW]
[ROW][C]-60.540320278058[/C][/ROW]
[ROW][C]-11.2583864862485[/C][/ROW]
[ROW][C]-52.9470897150597[/C][/ROW]
[ROW][C]-22.5504419972589[/C][/ROW]
[ROW][C]83.0911969680649[/C][/ROW]
[ROW][C]-36.7048015722767[/C][/ROW]
[ROW][C]149.264384623041[/C][/ROW]
[ROW][C]120.380162891832[/C][/ROW]
[ROW][C]-23.8078320520287[/C][/ROW]
[ROW][C]80.8150517860111[/C][/ROW]
[ROW][C]21.1674150000616[/C][/ROW]
[ROW][C]-3.0154230265066[/C][/ROW]
[ROW][C]132.923103119384[/C][/ROW]
[ROW][C]35.4977837293873[/C][/ROW]
[ROW][C]43.5435725692647[/C][/ROW]
[ROW][C]184.367520210177[/C][/ROW]
[ROW][C]29.6390549620705[/C][/ROW]
[ROW][C]-68.5328349926419[/C][/ROW]
[ROW][C]-41.9816152638818[/C][/ROW]
[ROW][C]-43.5509106544566[/C][/ROW]
[ROW][C]-83.9119155983483[/C][/ROW]
[ROW][C]58.9892080666153[/C][/ROW]
[ROW][C]-30.2040417200046[/C][/ROW]
[ROW][C]120.801371286879[/C][/ROW]
[ROW][C]-29.8240104859906[/C][/ROW]
[ROW][C]-18.7532008640895[/C][/ROW]
[ROW][C]-10.7271401794726[/C][/ROW]
[ROW][C]59.9403759515053[/C][/ROW]
[ROW][C]-29.3373778448672[/C][/ROW]
[ROW][C]-5.3423058820943[/C][/ROW]
[ROW][C]2.64944519118931[/C][/ROW]
[ROW][C]13.0102449176301[/C][/ROW]
[ROW][C]-31.5183557191033[/C][/ROW]
[ROW][C]40.7517317806003[/C][/ROW]
[ROW][C]-31.602546611366[/C][/ROW]
[ROW][C]-53.2953128677026[/C][/ROW]
[ROW][C]-80.1246742013271[/C][/ROW]
[ROW][C]-51.1754373539952[/C][/ROW]
[ROW][C]56.3537281731507[/C][/ROW]
[ROW][C]77.5270810035798[/C][/ROW]
[ROW][C]-61.9957902418702[/C][/ROW]
[ROW][C]185.595679151298[/C][/ROW]
[ROW][C]-69.8264776254453[/C][/ROW]
[ROW][C]-28.4868094222719[/C][/ROW]
[ROW][C]-55.9032935755958[/C][/ROW]
[ROW][C]128.862676946648[/C][/ROW]
[/TABLE]
Source: https://freestatistics.org/blog/index.php?pk=153668&T=2

Globally Unique Identifier (entire table): ba.freestatistics.org/blog/index.php?pk=153668&T=2

As an alternative you can also use a QR Code:  

The GUIDs for individual cells are displayed in the table below:

Estimated ARIMA Residuals
Value
0.638997413419203
9.90389303197282
-22.3023122314741
36.7800822877371
-19.3973585930276
-1.82728173431642
36.724066486773
28.8944188935952
-46.5447482676979
81.6669904922509
-49.3930539014323
7.32370593938105
-2.30938667138516
-24.7990807360454
37.724523686561
13.5082463734854
44.8741193262163
2.82810059127998
43.358748956677
44.3143722315104
-21.8938057081436
58.0924837106478
-26.3069296564498
-79.0312269035011
41.5110259041723
-13.1817192637497
39.9735020498047
111.800865424203
49.7870353541202
-26.8800725354202
26.7716077443333
-77.8312732647454
-46.9549404660863
48.2440783186885
-26.7544278903347
32.2685752571835
-69.0885472315691
18.7581149930453
-44.2107589570958
-10.9995953045413
-16.6543983695614
55.3520149024308
106.378953587588
-41.9150565981803
-31.5936647886223
2.35602637665503
-74.4547743387148
-81.8542252953119
-11.3023881661074
82.0619621095758
37.4332373170131
-85.2268950398416
-67.5118324553083
49.1631848298552
-34.2088759546933
-52.5269451126761
-24.5171134155982
-79.8851589272531
9.86643963696357
53.4082765899247
8.91844754070827
-25.9484302522257
-10.1960784792828
6.90086621046144
51.9597681113942
-38.4301255407228
-23.3767806921408
-10.28301333605
15.0050434191045
43.5780911400606
152.09757895771
18.6904275447767
-60.540320278058
-11.2583864862485
-52.9470897150597
-22.5504419972589
83.0911969680649
-36.7048015722767
149.264384623041
120.380162891832
-23.8078320520287
80.8150517860111
21.1674150000616
-3.0154230265066
132.923103119384
35.4977837293873
43.5435725692647
184.367520210177
29.6390549620705
-68.5328349926419
-41.9816152638818
-43.5509106544566
-83.9119155983483
58.9892080666153
-30.2040417200046
120.801371286879
-29.8240104859906
-18.7532008640895
-10.7271401794726
59.9403759515053
-29.3373778448672
-5.3423058820943
2.64944519118931
13.0102449176301
-31.5183557191033
40.7517317806003
-31.602546611366
-53.2953128677026
-80.1246742013271
-51.1754373539952
56.3537281731507
77.5270810035798
-61.9957902418702
185.595679151298
-69.8264776254453
-28.4868094222719
-55.9032935755958
128.862676946648


Parameters (Session):
par1 = FALSE ; par2 = 1 ; par3 = 0 ; par4 = 1 ; par5 = 12 ; par6 = 3 ; par7 = 1 ; par8 = 0 ; par9 = 1 ;
Parameters (R input):
par1 = FALSE ; par2 = 1 ; par3 = 0 ; par4 = 1 ; par5 = 12 ; par6 = 3 ; par7 = 1 ; par8 = 0 ; par9 = 1 ;
R code (references can be found in the software module):
library(lattice)
if (par1 == 'TRUE') par1 <- TRUE
if (par1 == 'FALSE') par1 <- FALSE
par2 <- as.numeric(par2) #Box-Cox lambda transformation parameter
par3 <- as.numeric(par3) #degree of non-seasonal differencing
par4 <- as.numeric(par4) #degree of seasonal differencing
par5 <- as.numeric(par5) #seasonal period
par6 <- as.numeric(par6) #degree (p) of the non-seasonal AR(p) polynomial
par7 <- as.numeric(par7) #degree (q) of the non-seasonal MA(q) polynomial
par8 <- as.numeric(par8) #degree (P) of the seasonal AR(P) polynomial
par9 <- as.numeric(par9) #degree (Q) of the seasonal MA(Q) polynomial
armaGR <- function(arima.out, names, n){
try1 <- arima.out$coef
try2 <- sqrt(diag(arima.out$var.coef))
try.data.frame <- data.frame(matrix(NA,ncol=4,nrow=length(names)))
dimnames(try.data.frame) <- list(names,c('coef','std','tstat','pv'))
try.data.frame[,1] <- try1
for(i in 1:length(try2)) try.data.frame[which(rownames(try.data.frame)==names(try2)[i]),2] <- try2[i]
try.data.frame[,3] <- try.data.frame[,1] / try.data.frame[,2]
try.data.frame[,4] <- round((1-pt(abs(try.data.frame[,3]),df=n-(length(try2)+1)))*2,5)
vector <- rep(NA,length(names))
vector[is.na(try.data.frame[,4])] <- 0
maxi <- which.max(try.data.frame[,4])
continue <- max(try.data.frame[,4],na.rm=TRUE) > .05
vector[maxi] <- 0
list(summary=try.data.frame,next.vector=vector,continue=continue)
}
arimaSelect <- function(series, order=c(13,0,0), seasonal=list(order=c(2,0,0),period=12), include.mean=F){
nrc <- order[1]+order[3]+seasonal$order[1]+seasonal$order[3]
coeff <- matrix(NA, nrow=nrc*2, ncol=nrc)
pval <- matrix(NA, nrow=nrc*2, ncol=nrc)
mylist <- rep(list(NULL), nrc)
names <- NULL
if(order[1] > 0) names <- paste('ar',1:order[1],sep='')
if(order[3] > 0) names <- c( names , paste('ma',1:order[3],sep='') )
if(seasonal$order[1] > 0) names <- c(names, paste('sar',1:seasonal$order[1],sep=''))
if(seasonal$order[3] > 0) names <- c(names, paste('sma',1:seasonal$order[3],sep=''))
arima.out <- arima(series, order=order, seasonal=seasonal, include.mean=include.mean, method='ML')
mylist[[1]] <- arima.out
last.arma <- armaGR(arima.out, names, length(series))
mystop <- FALSE
i <- 1
coeff[i,] <- last.arma[[1]][,1]
pval [i,] <- last.arma[[1]][,4]
i <- 2
aic <- arima.out$aic
while(!mystop){
mylist[[i]] <- arima.out
arima.out <- arima(series, order=order, seasonal=seasonal, include.mean=include.mean, method='ML', fixed=last.arma$next.vector)
aic <- c(aic, arima.out$aic)
last.arma <- armaGR(arima.out, names, length(series))
mystop <- !last.arma$continue
coeff[i,] <- last.arma[[1]][,1]
pval [i,] <- last.arma[[1]][,4]
i <- i+1
}
list(coeff, pval, mylist, aic=aic)
}
arimaSelectplot <- function(arimaSelect.out,noms,choix){
noms <- names(arimaSelect.out[[3]][[1]]$coef)
coeff <- arimaSelect.out[[1]]
k <- min(which(is.na(coeff[,1])))-1
coeff <- coeff[1:k,]
pval <- arimaSelect.out[[2]][1:k,]
aic <- arimaSelect.out$aic[1:k]
coeff[coeff==0] <- NA
n <- ncol(coeff)
if(missing(choix)) choix <- k
layout(matrix(c(1,1,1,2,
3,3,3,2,
3,3,3,4,
5,6,7,7),nr=4),
widths=c(10,35,45,15),
heights=c(30,30,15,15))
couleurs <- rainbow(75)[1:50]#(50)
ticks <- pretty(coeff)
par(mar=c(1,1,3,1))
plot(aic,k:1-.5,type='o',pch=21,bg='blue',cex=2,axes=F,lty=2,xpd=NA)
points(aic[choix],k-choix+.5,pch=21,cex=4,bg=2,xpd=NA)
title('aic',line=2)
par(mar=c(3,0,0,0))
plot(0,axes=F,xlab='',ylab='',xlim=range(ticks),ylim=c(.1,1))
rect(xleft = min(ticks) + (0:49)/50*(max(ticks)-min(ticks)),
xright = min(ticks) + (1:50)/50*(max(ticks)-min(ticks)),
ytop = rep(1,50),
ybottom= rep(0,50),col=couleurs,border=NA)
axis(1,ticks)
rect(xleft=min(ticks),xright=max(ticks),ytop=1,ybottom=0)
text(mean(coeff,na.rm=T),.5,'coefficients',cex=2,font=2)
par(mar=c(1,1,3,1))
image(1:n,1:k,t(coeff[k:1,]),axes=F,col=couleurs,zlim=range(ticks))
for(i in 1:n) for(j in 1:k) if(!is.na(coeff[j,i])) {
if(pval[j,i]<.01) symb = 'green'
else if( (pval[j,i]<.05) & (pval[j,i]>=.01)) symb = 'orange'
else if( (pval[j,i]<.1) & (pval[j,i]>=.05)) symb = 'red'
else symb = 'black'
polygon(c(i+.5 ,i+.2 ,i+.5 ,i+.5),
c(k-j+0.5,k-j+0.5,k-j+0.8,k-j+0.5),
col=symb)
if(j==choix) {
rect(xleft=i-.5,
xright=i+.5,
ybottom=k-j+1.5,
ytop=k-j+.5,
lwd=4)
text(i,
k-j+1,
round(coeff[j,i],2),
cex=1.2,
font=2)
}
else{
rect(xleft=i-.5,xright=i+.5,ybottom=k-j+1.5,ytop=k-j+.5)
text(i,k-j+1,round(coeff[j,i],2),cex=1.2,font=1)
}
}
axis(3,1:n,noms)
par(mar=c(0.5,0,0,0.5))
plot(0,axes=F,xlab='',ylab='',type='n',xlim=c(0,8),ylim=c(-.2,.8))
cols <- c('green','orange','red','black')
niv <- c('0','0.01','0.05','0.1')
for(i in 0:3){
polygon(c(1+2*i ,1+2*i ,1+2*i-.5 ,1+2*i),
c(.4 ,.7 , .4 , .4),
col=cols[i+1])
text(2*i,0.5,niv[i+1],cex=1.5)
}
text(8,.5,1,cex=1.5)
text(4,0,'p-value',cex=2)
box()
residus <- arimaSelect.out[[3]][[choix]]$res
par(mar=c(1,2,4,1))
acf(residus,main='')
title('acf',line=.5)
par(mar=c(1,2,4,1))
pacf(residus,main='')
title('pacf',line=.5)
par(mar=c(2,2,4,1))
qqnorm(residus,main='')
title('qq-norm',line=.5)
qqline(residus)
residus
}
if (par2 == 0) x <- log(x)
if (par2 != 0) x <- x^par2
(selection <- arimaSelect(x, order=c(par6,par3,par7), seasonal=list(order=c(par8,par4,par9), period=par5)))
bitmap(file='test1.png')
resid <- arimaSelectplot(selection)
dev.off()
resid
bitmap(file='test2.png')
acf(resid,length(resid)/2, main='Residual Autocorrelation Function')
dev.off()
bitmap(file='test3.png')
pacf(resid,length(resid)/2, main='Residual Partial Autocorrelation Function')
dev.off()
bitmap(file='test4.png')
cpgram(resid, main='Residual Cumulative Periodogram')
dev.off()
bitmap(file='test5.png')
hist(resid, main='Residual Histogram', xlab='values of Residuals')
dev.off()
bitmap(file='test6.png')
densityplot(~resid,col='black',main='Residual Density Plot', xlab='values of Residuals')
dev.off()
bitmap(file='test7.png')
qqnorm(resid, main='Residual Normal Q-Q Plot')
qqline(resid)
dev.off()
ncols <- length(selection[[1]][1,])
nrows <- length(selection[[2]][,1])-1
load(file='createtable')
a<-table.start()
a<-table.row.start(a)
a<-table.element(a,'ARIMA Parameter Estimation and Backward Selection', ncols+1,TRUE)
a<-table.row.end(a)
a<-table.row.start(a)
a<-table.element(a,'Iteration', header=TRUE)
for (i in 1:ncols) {
a<-table.element(a,names(selection[[3]][[1]]$coef)[i],header=TRUE)
}
a<-table.row.end(a)
for (j in 1:nrows) {
a<-table.row.start(a)
mydum <- 'Estimates ('
mydum <- paste(mydum,j)
mydum <- paste(mydum,')')
a<-table.element(a,mydum, header=TRUE)
for (i in 1:ncols) {
a<-table.element(a,round(selection[[1]][j,i],4))
}
a<-table.row.end(a)
a<-table.row.start(a)
a<-table.element(a,'(p-val)', header=TRUE)
for (i in 1:ncols) {
mydum <- '('
mydum <- paste(mydum,round(selection[[2]][j,i],4),sep='')
mydum <- paste(mydum,')')
a<-table.element(a,mydum)
}
a<-table.row.end(a)
}
a<-table.end(a)
table.save(a,file='mytable.tab')
a<-table.start()
a<-table.row.start(a)
a<-table.element(a,'Estimated ARIMA Residuals', 1,TRUE)
a<-table.row.end(a)
a<-table.row.start(a)
a<-table.element(a,'Value', 1,TRUE)
a<-table.row.end(a)
for (i in (par4*par5+par3):length(resid)) {
a<-table.row.start(a)
a<-table.element(a,resid[i])
a<-table.row.end(a)
}
a<-table.end(a)
table.save(a,file='mytable1.tab')