Free Statistics

of Irreproducible Research!

Author's title

Author*Unverified author*
R Software Modulerwasp_arimabackwardselection.wasp
Title produced by softwareARIMA Backward Selection
Date of computationSun, 04 Dec 2011 09:15:32 -0500
Cite this page as followsStatistical Computations at FreeStatistics.org, Office for Research Development and Education, URL https://freestatistics.org/blog/index.php?v=date/2011/Dec/04/t1323008420tf7kt53rdlma0xs.htm/, Retrieved Sun, 05 May 2024 14:26:19 +0000
Statistical Computations at FreeStatistics.org, Office for Research Development and Education, URL https://freestatistics.org/blog/index.php?pk=150656, Retrieved Sun, 05 May 2024 14:26:19 +0000
QR Codes:

Original text written by user:
IsPrivate?No (this computation is public)
User-defined keywords
Estimated Impact136
Family? (F = Feedback message, R = changed R code, M = changed R Module, P = changed Parameters, D = changed Data)
-     [Univariate Explorative Data Analysis] [Monthly US soldie...] [2010-11-02 12:07:39] [b98453cac15ba1066b407e146608df68]
- RMP   [Variance Reduction Matrix] [Soldiers] [2010-11-29 09:51:25] [b98453cac15ba1066b407e146608df68]
- RM      [Standard Deviation-Mean Plot] [Soldiers] [2010-11-29 11:02:42] [b98453cac15ba1066b407e146608df68]
- RMP       [ARIMA Backward Selection] [Soldiers] [2010-11-29 17:56:11] [b98453cac15ba1066b407e146608df68]
- R PD        [ARIMA Backward Selection] [WS9 4 Foutmelding] [2010-12-07 15:26:08] [afe9379cca749d06b3d6872e02cc47ed]
-   P           [ARIMA Backward Selection] [WS9 4 AR MA] [2010-12-07 15:33:10] [afe9379cca749d06b3d6872e02cc47ed]
- R PD              [ARIMA Backward Selection] [ARIMA] [2011-12-04 14:15:32] [d41d8cd98f00b204e9800998ecf8427e] [Current]
Feedback Forum

Post a new message
Dataseries X:
9700
9081
9084
9743
8587
9731
9563
9998
9437
10038
9918
9252
9737
9035
9133
9487
8700
9627
8947
9283
8829
9947
9628
9318
9605
8640
9214
9567
8547
9185
9470
9123
9278
10170
9434
9655
9429
8739
9552
9687
9019
9672
9206
9069
9788
10312
10105
9863
9656
9295
9946
9701
9049
10190
9706
9765
9893
9994
10433
10073
10112
9266
9820
10097
9115
10411
9678
10408
10153
10368
10581
10597
10680
9738
9556


Summary of computational transaction
Raw Inputview raw input (R code)
Raw Outputview raw output of R engine
Computing time7 seconds
R Server'AstonUniversity' @ aston.wessa.net

\begin{tabular}{lllllllll}
\hline
Summary of computational transaction \tabularnewline
Raw Input & view raw input (R code)  \tabularnewline
Raw Output & view raw output of R engine  \tabularnewline
Computing time & 7 seconds \tabularnewline
R Server & 'AstonUniversity' @ aston.wessa.net \tabularnewline
\hline
\end{tabular}
%Source: https://freestatistics.org/blog/index.php?pk=150656&T=0

[TABLE]
[ROW][C]Summary of computational transaction[/C][/ROW]
[ROW][C]Raw Input[/C][C]view raw input (R code) [/C][/ROW]
[ROW][C]Raw Output[/C][C]view raw output of R engine [/C][/ROW]
[ROW][C]Computing time[/C][C]7 seconds[/C][/ROW]
[ROW][C]R Server[/C][C]'AstonUniversity' @ aston.wessa.net[/C][/ROW]
[/TABLE]
Source: https://freestatistics.org/blog/index.php?pk=150656&T=0

Globally Unique Identifier (entire table): ba.freestatistics.org/blog/index.php?pk=150656&T=0

As an alternative you can also use a QR Code:  

The GUIDs for individual cells are displayed in the table below:

Summary of computational transaction
Raw Inputview raw input (R code)
Raw Outputview raw output of R engine
Computing time7 seconds
R Server'AstonUniversity' @ aston.wessa.net


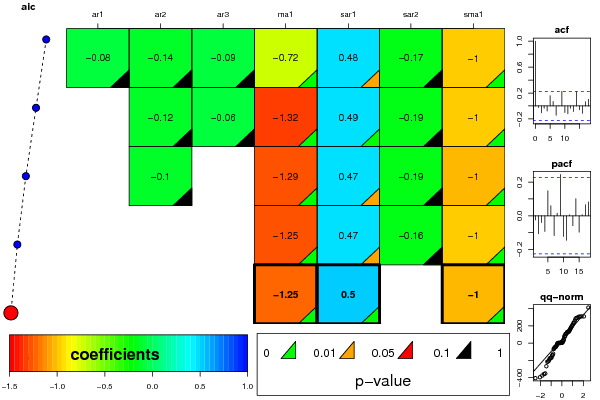
ARIMA Parameter Estimation and Backward Selection
Iterationar1ar2ar3ma1sar1sar2sma1
Estimates ( 1 )-0.0815-0.1445-0.0885-0.7180.477-0.171-1
(p-val)(0.6886 )(0.3825 )(0.5739 )(0 )(0.0115 )(0.3465 )(0.0012 )
Estimates ( 2 )0-0.1156-0.0599-1.31850.485-0.1913-0.9999
(p-val)(NA )(0.4371 )(0.6749 )(0 )(0.0092 )(0.2699 )(0.0013 )
Estimates ( 3 )0-0.10190-1.29390.47-0.1867-1.0003
(p-val)(NA )(0.4878 )(NA )(0 )(0.0108 )(0.2846 )(0.0012 )
Estimates ( 4 )000-1.25240.4673-0.1609-1
(p-val)(NA )(NA )(NA )(0 )(0.0126 )(0.3477 )(0.0012 )
Estimates ( 5 )000-1.24560.50-1.0001
(p-val)(NA )(NA )(NA )(0 )(0.0078 )(NA )(0 )
Estimates ( 6 )NANANANANANANA
(p-val)(NA )(NA )(NA )(NA )(NA )(NA )(NA )
Estimates ( 7 )NANANANANANANA
(p-val)(NA )(NA )(NA )(NA )(NA )(NA )(NA )
Estimates ( 8 )NANANANANANANA
(p-val)(NA )(NA )(NA )(NA )(NA )(NA )(NA )
Estimates ( 9 )NANANANANANANA
(p-val)(NA )(NA )(NA )(NA )(NA )(NA )(NA )
Estimates ( 10 )NANANANANANANA
(p-val)(NA )(NA )(NA )(NA )(NA )(NA )(NA )
Estimates ( 11 )NANANANANANANA
(p-val)(NA )(NA )(NA )(NA )(NA )(NA )(NA )
Estimates ( 12 )NANANANANANANA
(p-val)(NA )(NA )(NA )(NA )(NA )(NA )(NA )
Estimates ( 13 )NANANANANANANA
(p-val)(NA )(NA )(NA )(NA )(NA )(NA )(NA )

\begin{tabular}{lllllllll}
\hline
ARIMA Parameter Estimation and Backward Selection \tabularnewline
Iteration & ar1 & ar2 & ar3 & ma1 & sar1 & sar2 & sma1 \tabularnewline
Estimates ( 1 ) & -0.0815 & -0.1445 & -0.0885 & -0.718 & 0.477 & -0.171 & -1 \tabularnewline
(p-val) & (0.6886 ) & (0.3825 ) & (0.5739 ) & (0 ) & (0.0115 ) & (0.3465 ) & (0.0012 ) \tabularnewline
Estimates ( 2 ) & 0 & -0.1156 & -0.0599 & -1.3185 & 0.485 & -0.1913 & -0.9999 \tabularnewline
(p-val) & (NA ) & (0.4371 ) & (0.6749 ) & (0 ) & (0.0092 ) & (0.2699 ) & (0.0013 ) \tabularnewline
Estimates ( 3 ) & 0 & -0.1019 & 0 & -1.2939 & 0.47 & -0.1867 & -1.0003 \tabularnewline
(p-val) & (NA ) & (0.4878 ) & (NA ) & (0 ) & (0.0108 ) & (0.2846 ) & (0.0012 ) \tabularnewline
Estimates ( 4 ) & 0 & 0 & 0 & -1.2524 & 0.4673 & -0.1609 & -1 \tabularnewline
(p-val) & (NA ) & (NA ) & (NA ) & (0 ) & (0.0126 ) & (0.3477 ) & (0.0012 ) \tabularnewline
Estimates ( 5 ) & 0 & 0 & 0 & -1.2456 & 0.5 & 0 & -1.0001 \tabularnewline
(p-val) & (NA ) & (NA ) & (NA ) & (0 ) & (0.0078 ) & (NA ) & (0 ) \tabularnewline
Estimates ( 6 ) & NA & NA & NA & NA & NA & NA & NA \tabularnewline
(p-val) & (NA ) & (NA ) & (NA ) & (NA ) & (NA ) & (NA ) & (NA ) \tabularnewline
Estimates ( 7 ) & NA & NA & NA & NA & NA & NA & NA \tabularnewline
(p-val) & (NA ) & (NA ) & (NA ) & (NA ) & (NA ) & (NA ) & (NA ) \tabularnewline
Estimates ( 8 ) & NA & NA & NA & NA & NA & NA & NA \tabularnewline
(p-val) & (NA ) & (NA ) & (NA ) & (NA ) & (NA ) & (NA ) & (NA ) \tabularnewline
Estimates ( 9 ) & NA & NA & NA & NA & NA & NA & NA \tabularnewline
(p-val) & (NA ) & (NA ) & (NA ) & (NA ) & (NA ) & (NA ) & (NA ) \tabularnewline
Estimates ( 10 ) & NA & NA & NA & NA & NA & NA & NA \tabularnewline
(p-val) & (NA ) & (NA ) & (NA ) & (NA ) & (NA ) & (NA ) & (NA ) \tabularnewline
Estimates ( 11 ) & NA & NA & NA & NA & NA & NA & NA \tabularnewline
(p-val) & (NA ) & (NA ) & (NA ) & (NA ) & (NA ) & (NA ) & (NA ) \tabularnewline
Estimates ( 12 ) & NA & NA & NA & NA & NA & NA & NA \tabularnewline
(p-val) & (NA ) & (NA ) & (NA ) & (NA ) & (NA ) & (NA ) & (NA ) \tabularnewline
Estimates ( 13 ) & NA & NA & NA & NA & NA & NA & NA \tabularnewline
(p-val) & (NA ) & (NA ) & (NA ) & (NA ) & (NA ) & (NA ) & (NA ) \tabularnewline
\hline
\end{tabular}
%Source: https://freestatistics.org/blog/index.php?pk=150656&T=1

[TABLE]
[ROW][C]ARIMA Parameter Estimation and Backward Selection[/C][/ROW]
[ROW][C]Iteration[/C][C]ar1[/C][C]ar2[/C][C]ar3[/C][C]ma1[/C][C]sar1[/C][C]sar2[/C][C]sma1[/C][/ROW]
[ROW][C]Estimates ( 1 )[/C][C]-0.0815[/C][C]-0.1445[/C][C]-0.0885[/C][C]-0.718[/C][C]0.477[/C][C]-0.171[/C][C]-1[/C][/ROW]
[ROW][C](p-val)[/C][C](0.6886 )[/C][C](0.3825 )[/C][C](0.5739 )[/C][C](0 )[/C][C](0.0115 )[/C][C](0.3465 )[/C][C](0.0012 )[/C][/ROW]
[ROW][C]Estimates ( 2 )[/C][C]0[/C][C]-0.1156[/C][C]-0.0599[/C][C]-1.3185[/C][C]0.485[/C][C]-0.1913[/C][C]-0.9999[/C][/ROW]
[ROW][C](p-val)[/C][C](NA )[/C][C](0.4371 )[/C][C](0.6749 )[/C][C](0 )[/C][C](0.0092 )[/C][C](0.2699 )[/C][C](0.0013 )[/C][/ROW]
[ROW][C]Estimates ( 3 )[/C][C]0[/C][C]-0.1019[/C][C]0[/C][C]-1.2939[/C][C]0.47[/C][C]-0.1867[/C][C]-1.0003[/C][/ROW]
[ROW][C](p-val)[/C][C](NA )[/C][C](0.4878 )[/C][C](NA )[/C][C](0 )[/C][C](0.0108 )[/C][C](0.2846 )[/C][C](0.0012 )[/C][/ROW]
[ROW][C]Estimates ( 4 )[/C][C]0[/C][C]0[/C][C]0[/C][C]-1.2524[/C][C]0.4673[/C][C]-0.1609[/C][C]-1[/C][/ROW]
[ROW][C](p-val)[/C][C](NA )[/C][C](NA )[/C][C](NA )[/C][C](0 )[/C][C](0.0126 )[/C][C](0.3477 )[/C][C](0.0012 )[/C][/ROW]
[ROW][C]Estimates ( 5 )[/C][C]0[/C][C]0[/C][C]0[/C][C]-1.2456[/C][C]0.5[/C][C]0[/C][C]-1.0001[/C][/ROW]
[ROW][C](p-val)[/C][C](NA )[/C][C](NA )[/C][C](NA )[/C][C](0 )[/C][C](0.0078 )[/C][C](NA )[/C][C](0 )[/C][/ROW]
[ROW][C]Estimates ( 6 )[/C][C]NA[/C][C]NA[/C][C]NA[/C][C]NA[/C][C]NA[/C][C]NA[/C][C]NA[/C][/ROW]
[ROW][C](p-val)[/C][C](NA )[/C][C](NA )[/C][C](NA )[/C][C](NA )[/C][C](NA )[/C][C](NA )[/C][C](NA )[/C][/ROW]
[ROW][C]Estimates ( 7 )[/C][C]NA[/C][C]NA[/C][C]NA[/C][C]NA[/C][C]NA[/C][C]NA[/C][C]NA[/C][/ROW]
[ROW][C](p-val)[/C][C](NA )[/C][C](NA )[/C][C](NA )[/C][C](NA )[/C][C](NA )[/C][C](NA )[/C][C](NA )[/C][/ROW]
[ROW][C]Estimates ( 8 )[/C][C]NA[/C][C]NA[/C][C]NA[/C][C]NA[/C][C]NA[/C][C]NA[/C][C]NA[/C][/ROW]
[ROW][C](p-val)[/C][C](NA )[/C][C](NA )[/C][C](NA )[/C][C](NA )[/C][C](NA )[/C][C](NA )[/C][C](NA )[/C][/ROW]
[ROW][C]Estimates ( 9 )[/C][C]NA[/C][C]NA[/C][C]NA[/C][C]NA[/C][C]NA[/C][C]NA[/C][C]NA[/C][/ROW]
[ROW][C](p-val)[/C][C](NA )[/C][C](NA )[/C][C](NA )[/C][C](NA )[/C][C](NA )[/C][C](NA )[/C][C](NA )[/C][/ROW]
[ROW][C]Estimates ( 10 )[/C][C]NA[/C][C]NA[/C][C]NA[/C][C]NA[/C][C]NA[/C][C]NA[/C][C]NA[/C][/ROW]
[ROW][C](p-val)[/C][C](NA )[/C][C](NA )[/C][C](NA )[/C][C](NA )[/C][C](NA )[/C][C](NA )[/C][C](NA )[/C][/ROW]
[ROW][C]Estimates ( 11 )[/C][C]NA[/C][C]NA[/C][C]NA[/C][C]NA[/C][C]NA[/C][C]NA[/C][C]NA[/C][/ROW]
[ROW][C](p-val)[/C][C](NA )[/C][C](NA )[/C][C](NA )[/C][C](NA )[/C][C](NA )[/C][C](NA )[/C][C](NA )[/C][/ROW]
[ROW][C]Estimates ( 12 )[/C][C]NA[/C][C]NA[/C][C]NA[/C][C]NA[/C][C]NA[/C][C]NA[/C][C]NA[/C][/ROW]
[ROW][C](p-val)[/C][C](NA )[/C][C](NA )[/C][C](NA )[/C][C](NA )[/C][C](NA )[/C][C](NA )[/C][C](NA )[/C][/ROW]
[ROW][C]Estimates ( 13 )[/C][C]NA[/C][C]NA[/C][C]NA[/C][C]NA[/C][C]NA[/C][C]NA[/C][C]NA[/C][/ROW]
[ROW][C](p-val)[/C][C](NA )[/C][C](NA )[/C][C](NA )[/C][C](NA )[/C][C](NA )[/C][C](NA )[/C][C](NA )[/C][/ROW]
[/TABLE]
Source: https://freestatistics.org/blog/index.php?pk=150656&T=1

Globally Unique Identifier (entire table): ba.freestatistics.org/blog/index.php?pk=150656&T=1

As an alternative you can also use a QR Code:  

The GUIDs for individual cells are displayed in the table below:

ARIMA Parameter Estimation and Backward Selection
Iterationar1ar2ar3ma1sar1sar2sma1
Estimates ( 1 )-0.0815-0.1445-0.0885-0.7180.477-0.171-1
(p-val)(0.6886 )(0.3825 )(0.5739 )(0 )(0.0115 )(0.3465 )(0.0012 )
Estimates ( 2 )0-0.1156-0.0599-1.31850.485-0.1913-0.9999
(p-val)(NA )(0.4371 )(0.6749 )(0 )(0.0092 )(0.2699 )(0.0013 )
Estimates ( 3 )0-0.10190-1.29390.47-0.1867-1.0003
(p-val)(NA )(0.4878 )(NA )(0 )(0.0108 )(0.2846 )(0.0012 )
Estimates ( 4 )000-1.25240.4673-0.1609-1
(p-val)(NA )(NA )(NA )(0 )(0.0126 )(0.3477 )(0.0012 )
Estimates ( 5 )000-1.24560.50-1.0001
(p-val)(NA )(NA )(NA )(0 )(0.0078 )(NA )(0 )
Estimates ( 6 )NANANANANANANA
(p-val)(NA )(NA )(NA )(NA )(NA )(NA )(NA )
Estimates ( 7 )NANANANANANANA
(p-val)(NA )(NA )(NA )(NA )(NA )(NA )(NA )
Estimates ( 8 )NANANANANANANA
(p-val)(NA )(NA )(NA )(NA )(NA )(NA )(NA )
Estimates ( 9 )NANANANANANANA
(p-val)(NA )(NA )(NA )(NA )(NA )(NA )(NA )
Estimates ( 10 )NANANANANANANA
(p-val)(NA )(NA )(NA )(NA )(NA )(NA )(NA )
Estimates ( 11 )NANANANANANANA
(p-val)(NA )(NA )(NA )(NA )(NA )(NA )(NA )
Estimates ( 12 )NANANANANANANA
(p-val)(NA )(NA )(NA )(NA )(NA )(NA )(NA )
Estimates ( 13 )NANANANANANANA
(p-val)(NA )(NA )(NA )(NA )(NA )(NA )(NA )


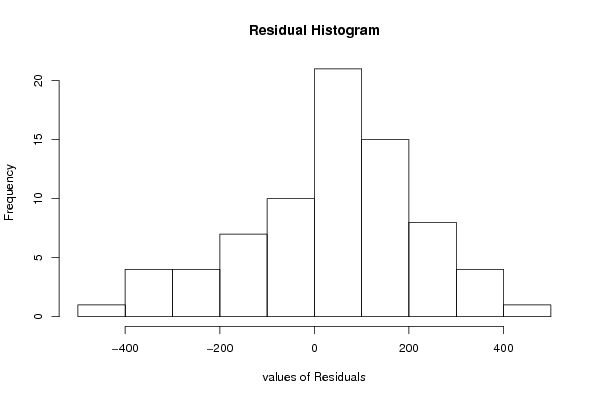
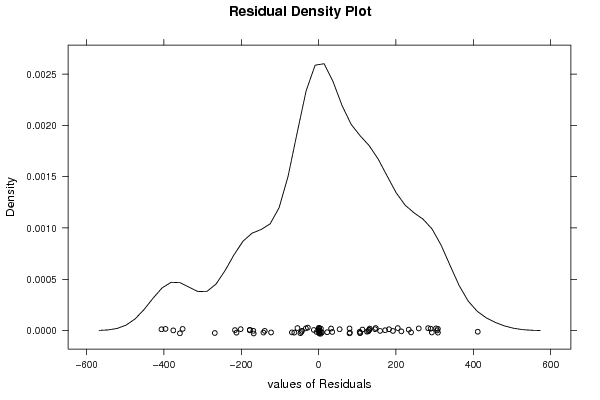
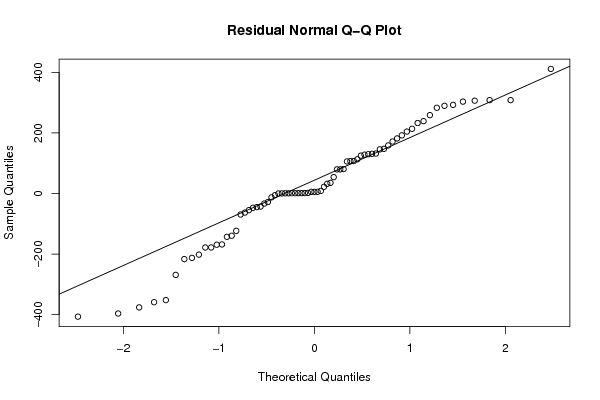
Estimated ARIMA Residuals
Value
-33.010363329693
-42.9288428564787
32.138938717836
-167.979168325514
113.169298460159
-54.7633255462275
-375.835625959695
-358.690208116944
-212.41970022349
171.877719921094
5.46202081120015
238.982540936451
79.867772033034
-123.068668479601
232.929179320473
145.922740619864
5.74104334187227
-216.365808691154
411.329995323521
-142.840304042794
308.294160029419
158.820371629991
-178.114039135882
258.875121070161
-139.40927459072
22.192076527621
283.176692492604
8.51582195176551
289.633750959815
147.51863317024
-351.790682001349
-268.480630529131
306.520643005024
54.2052619101206
303.498994992776
79.8331713827312
-44.8348625596039
181.974271435949
213.8262697531
-201.645896838402
-69.1624575284287
192.160772074829
132.017013108318
106.054866859189
-47.0960556126861
-396.007438713769
129.786340967032
107.092974998179
107.246442616092
-168.898363171234
-62.9174239229583
128.349484026016
-27.9935067295413
131.136499106444
-177.994246542027
308.371323714993
124.995550717551
-12.4645252019297
35.2512876189443
292.662643493084
204.496920402677
80.8102845246182
-406.386203251232

\begin{tabular}{lllllllll}
\hline
Estimated ARIMA Residuals \tabularnewline
Value \tabularnewline
-33.010363329693 \tabularnewline
-42.9288428564787 \tabularnewline
32.138938717836 \tabularnewline
-167.979168325514 \tabularnewline
113.169298460159 \tabularnewline
-54.7633255462275 \tabularnewline
-375.835625959695 \tabularnewline
-358.690208116944 \tabularnewline
-212.41970022349 \tabularnewline
171.877719921094 \tabularnewline
5.46202081120015 \tabularnewline
238.982540936451 \tabularnewline
79.867772033034 \tabularnewline
-123.068668479601 \tabularnewline
232.929179320473 \tabularnewline
145.922740619864 \tabularnewline
5.74104334187227 \tabularnewline
-216.365808691154 \tabularnewline
411.329995323521 \tabularnewline
-142.840304042794 \tabularnewline
308.294160029419 \tabularnewline
158.820371629991 \tabularnewline
-178.114039135882 \tabularnewline
258.875121070161 \tabularnewline
-139.40927459072 \tabularnewline
22.192076527621 \tabularnewline
283.176692492604 \tabularnewline
8.51582195176551 \tabularnewline
289.633750959815 \tabularnewline
147.51863317024 \tabularnewline
-351.790682001349 \tabularnewline
-268.480630529131 \tabularnewline
306.520643005024 \tabularnewline
54.2052619101206 \tabularnewline
303.498994992776 \tabularnewline
79.8331713827312 \tabularnewline
-44.8348625596039 \tabularnewline
181.974271435949 \tabularnewline
213.8262697531 \tabularnewline
-201.645896838402 \tabularnewline
-69.1624575284287 \tabularnewline
192.160772074829 \tabularnewline
132.017013108318 \tabularnewline
106.054866859189 \tabularnewline
-47.0960556126861 \tabularnewline
-396.007438713769 \tabularnewline
129.786340967032 \tabularnewline
107.092974998179 \tabularnewline
107.246442616092 \tabularnewline
-168.898363171234 \tabularnewline
-62.9174239229583 \tabularnewline
128.349484026016 \tabularnewline
-27.9935067295413 \tabularnewline
131.136499106444 \tabularnewline
-177.994246542027 \tabularnewline
308.371323714993 \tabularnewline
124.995550717551 \tabularnewline
-12.4645252019297 \tabularnewline
35.2512876189443 \tabularnewline
292.662643493084 \tabularnewline
204.496920402677 \tabularnewline
80.8102845246182 \tabularnewline
-406.386203251232 \tabularnewline
\hline
\end{tabular}
%Source: https://freestatistics.org/blog/index.php?pk=150656&T=2

[TABLE]
[ROW][C]Estimated ARIMA Residuals[/C][/ROW]
[ROW][C]Value[/C][/ROW]
[ROW][C]-33.010363329693[/C][/ROW]
[ROW][C]-42.9288428564787[/C][/ROW]
[ROW][C]32.138938717836[/C][/ROW]
[ROW][C]-167.979168325514[/C][/ROW]
[ROW][C]113.169298460159[/C][/ROW]
[ROW][C]-54.7633255462275[/C][/ROW]
[ROW][C]-375.835625959695[/C][/ROW]
[ROW][C]-358.690208116944[/C][/ROW]
[ROW][C]-212.41970022349[/C][/ROW]
[ROW][C]171.877719921094[/C][/ROW]
[ROW][C]5.46202081120015[/C][/ROW]
[ROW][C]238.982540936451[/C][/ROW]
[ROW][C]79.867772033034[/C][/ROW]
[ROW][C]-123.068668479601[/C][/ROW]
[ROW][C]232.929179320473[/C][/ROW]
[ROW][C]145.922740619864[/C][/ROW]
[ROW][C]5.74104334187227[/C][/ROW]
[ROW][C]-216.365808691154[/C][/ROW]
[ROW][C]411.329995323521[/C][/ROW]
[ROW][C]-142.840304042794[/C][/ROW]
[ROW][C]308.294160029419[/C][/ROW]
[ROW][C]158.820371629991[/C][/ROW]
[ROW][C]-178.114039135882[/C][/ROW]
[ROW][C]258.875121070161[/C][/ROW]
[ROW][C]-139.40927459072[/C][/ROW]
[ROW][C]22.192076527621[/C][/ROW]
[ROW][C]283.176692492604[/C][/ROW]
[ROW][C]8.51582195176551[/C][/ROW]
[ROW][C]289.633750959815[/C][/ROW]
[ROW][C]147.51863317024[/C][/ROW]
[ROW][C]-351.790682001349[/C][/ROW]
[ROW][C]-268.480630529131[/C][/ROW]
[ROW][C]306.520643005024[/C][/ROW]
[ROW][C]54.2052619101206[/C][/ROW]
[ROW][C]303.498994992776[/C][/ROW]
[ROW][C]79.8331713827312[/C][/ROW]
[ROW][C]-44.8348625596039[/C][/ROW]
[ROW][C]181.974271435949[/C][/ROW]
[ROW][C]213.8262697531[/C][/ROW]
[ROW][C]-201.645896838402[/C][/ROW]
[ROW][C]-69.1624575284287[/C][/ROW]
[ROW][C]192.160772074829[/C][/ROW]
[ROW][C]132.017013108318[/C][/ROW]
[ROW][C]106.054866859189[/C][/ROW]
[ROW][C]-47.0960556126861[/C][/ROW]
[ROW][C]-396.007438713769[/C][/ROW]
[ROW][C]129.786340967032[/C][/ROW]
[ROW][C]107.092974998179[/C][/ROW]
[ROW][C]107.246442616092[/C][/ROW]
[ROW][C]-168.898363171234[/C][/ROW]
[ROW][C]-62.9174239229583[/C][/ROW]
[ROW][C]128.349484026016[/C][/ROW]
[ROW][C]-27.9935067295413[/C][/ROW]
[ROW][C]131.136499106444[/C][/ROW]
[ROW][C]-177.994246542027[/C][/ROW]
[ROW][C]308.371323714993[/C][/ROW]
[ROW][C]124.995550717551[/C][/ROW]
[ROW][C]-12.4645252019297[/C][/ROW]
[ROW][C]35.2512876189443[/C][/ROW]
[ROW][C]292.662643493084[/C][/ROW]
[ROW][C]204.496920402677[/C][/ROW]
[ROW][C]80.8102845246182[/C][/ROW]
[ROW][C]-406.386203251232[/C][/ROW]
[/TABLE]
Source: https://freestatistics.org/blog/index.php?pk=150656&T=2

Globally Unique Identifier (entire table): ba.freestatistics.org/blog/index.php?pk=150656&T=2

As an alternative you can also use a QR Code:  

The GUIDs for individual cells are displayed in the table below:

Estimated ARIMA Residuals
Value
-33.010363329693
-42.9288428564787
32.138938717836
-167.979168325514
113.169298460159
-54.7633255462275
-375.835625959695
-358.690208116944
-212.41970022349
171.877719921094
5.46202081120015
238.982540936451
79.867772033034
-123.068668479601
232.929179320473
145.922740619864
5.74104334187227
-216.365808691154
411.329995323521
-142.840304042794
308.294160029419
158.820371629991
-178.114039135882
258.875121070161
-139.40927459072
22.192076527621
283.176692492604
8.51582195176551
289.633750959815
147.51863317024
-351.790682001349
-268.480630529131
306.520643005024
54.2052619101206
303.498994992776
79.8331713827312
-44.8348625596039
181.974271435949
213.8262697531
-201.645896838402
-69.1624575284287
192.160772074829
132.017013108318
106.054866859189
-47.0960556126861
-396.007438713769
129.786340967032
107.092974998179
107.246442616092
-168.898363171234
-62.9174239229583
128.349484026016
-27.9935067295413
131.136499106444
-177.994246542027
308.371323714993
124.995550717551
-12.4645252019297
35.2512876189443
292.662643493084
204.496920402677
80.8102845246182
-406.386203251232


Parameters (Session):
par1 = 1 ; par2 = 2 ; par3 = 2 ; par4 = 12 ;
Parameters (R input):
par1 = FALSE ; par2 = 1 ; par3 = 1 ; par4 = 1 ; par5 = 12 ; par6 = 3 ; par7 = 1 ; par8 = 2 ; par9 = 1 ;
R code (references can be found in the software module):
library(lattice)
if (par1 == 'TRUE') par1 <- TRUE
if (par1 == 'FALSE') par1 <- FALSE
par2 <- as.numeric(par2) #Box-Cox lambda transformation parameter
par3 <- as.numeric(par3) #degree of non-seasonal differencing
par4 <- as.numeric(par4) #degree of seasonal differencing
par5 <- as.numeric(par5) #seasonal period
par6 <- as.numeric(par6) #degree (p) of the non-seasonal AR(p) polynomial
par7 <- as.numeric(par7) #degree (q) of the non-seasonal MA(q) polynomial
par8 <- as.numeric(par8) #degree (P) of the seasonal AR(P) polynomial
par9 <- as.numeric(par9) #degree (Q) of the seasonal MA(Q) polynomial
armaGR <- function(arima.out, names, n){
try1 <- arima.out$coef
try2 <- sqrt(diag(arima.out$var.coef))
try.data.frame <- data.frame(matrix(NA,ncol=4,nrow=length(names)))
dimnames(try.data.frame) <- list(names,c('coef','std','tstat','pv'))
try.data.frame[,1] <- try1
for(i in 1:length(try2)) try.data.frame[which(rownames(try.data.frame)==names(try2)[i]),2] <- try2[i]
try.data.frame[,3] <- try.data.frame[,1] / try.data.frame[,2]
try.data.frame[,4] <- round((1-pt(abs(try.data.frame[,3]),df=n-(length(try2)+1)))*2,5)
vector <- rep(NA,length(names))
vector[is.na(try.data.frame[,4])] <- 0
maxi <- which.max(try.data.frame[,4])
continue <- max(try.data.frame[,4],na.rm=TRUE) > .05
vector[maxi] <- 0
list(summary=try.data.frame,next.vector=vector,continue=continue)
}
arimaSelect <- function(series, order=c(13,0,0), seasonal=list(order=c(2,0,0),period=12), include.mean=F){
nrc <- order[1]+order[3]+seasonal$order[1]+seasonal$order[3]
coeff <- matrix(NA, nrow=nrc*2, ncol=nrc)
pval <- matrix(NA, nrow=nrc*2, ncol=nrc)
mylist <- rep(list(NULL), nrc)
names <- NULL
if(order[1] > 0) names <- paste('ar',1:order[1],sep='')
if(order[3] > 0) names <- c( names , paste('ma',1:order[3],sep='') )
if(seasonal$order[1] > 0) names <- c(names, paste('sar',1:seasonal$order[1],sep=''))
if(seasonal$order[3] > 0) names <- c(names, paste('sma',1:seasonal$order[3],sep=''))
arima.out <- arima(series, order=order, seasonal=seasonal, include.mean=include.mean, method='ML')
mylist[[1]] <- arima.out
last.arma <- armaGR(arima.out, names, length(series))
mystop <- FALSE
i <- 1
coeff[i,] <- last.arma[[1]][,1]
pval [i,] <- last.arma[[1]][,4]
i <- 2
aic <- arima.out$aic
while(!mystop){
mylist[[i]] <- arima.out
arima.out <- arima(series, order=order, seasonal=seasonal, include.mean=include.mean, method='ML', fixed=last.arma$next.vector)
aic <- c(aic, arima.out$aic)
last.arma <- armaGR(arima.out, names, length(series))
mystop <- !last.arma$continue
coeff[i,] <- last.arma[[1]][,1]
pval [i,] <- last.arma[[1]][,4]
i <- i+1
}
list(coeff, pval, mylist, aic=aic)
}
arimaSelectplot <- function(arimaSelect.out,noms,choix){
noms <- names(arimaSelect.out[[3]][[1]]$coef)
coeff <- arimaSelect.out[[1]]
k <- min(which(is.na(coeff[,1])))-1
coeff <- coeff[1:k,]
pval <- arimaSelect.out[[2]][1:k,]
aic <- arimaSelect.out$aic[1:k]
coeff[coeff==0] <- NA
n <- ncol(coeff)
if(missing(choix)) choix <- k
layout(matrix(c(1,1,1,2,
3,3,3,2,
3,3,3,4,
5,6,7,7),nr=4),
widths=c(10,35,45,15),
heights=c(30,30,15,15))
couleurs <- rainbow(75)[1:50]#(50)
ticks <- pretty(coeff)
par(mar=c(1,1,3,1))
plot(aic,k:1-.5,type='o',pch=21,bg='blue',cex=2,axes=F,lty=2,xpd=NA)
points(aic[choix],k-choix+.5,pch=21,cex=4,bg=2,xpd=NA)
title('aic',line=2)
par(mar=c(3,0,0,0))
plot(0,axes=F,xlab='',ylab='',xlim=range(ticks),ylim=c(.1,1))
rect(xleft = min(ticks) + (0:49)/50*(max(ticks)-min(ticks)),
xright = min(ticks) + (1:50)/50*(max(ticks)-min(ticks)),
ytop = rep(1,50),
ybottom= rep(0,50),col=couleurs,border=NA)
axis(1,ticks)
rect(xleft=min(ticks),xright=max(ticks),ytop=1,ybottom=0)
text(mean(coeff,na.rm=T),.5,'coefficients',cex=2,font=2)
par(mar=c(1,1,3,1))
image(1:n,1:k,t(coeff[k:1,]),axes=F,col=couleurs,zlim=range(ticks))
for(i in 1:n) for(j in 1:k) if(!is.na(coeff[j,i])) {
if(pval[j,i]<.01) symb = 'green'
else if( (pval[j,i]<.05) & (pval[j,i]>=.01)) symb = 'orange'
else if( (pval[j,i]<.1) & (pval[j,i]>=.05)) symb = 'red'
else symb = 'black'
polygon(c(i+.5 ,i+.2 ,i+.5 ,i+.5),
c(k-j+0.5,k-j+0.5,k-j+0.8,k-j+0.5),
col=symb)
if(j==choix) {
rect(xleft=i-.5,
xright=i+.5,
ybottom=k-j+1.5,
ytop=k-j+.5,
lwd=4)
text(i,
k-j+1,
round(coeff[j,i],2),
cex=1.2,
font=2)
}
else{
rect(xleft=i-.5,xright=i+.5,ybottom=k-j+1.5,ytop=k-j+.5)
text(i,k-j+1,round(coeff[j,i],2),cex=1.2,font=1)
}
}
axis(3,1:n,noms)
par(mar=c(0.5,0,0,0.5))
plot(0,axes=F,xlab='',ylab='',type='n',xlim=c(0,8),ylim=c(-.2,.8))
cols <- c('green','orange','red','black')
niv <- c('0','0.01','0.05','0.1')
for(i in 0:3){
polygon(c(1+2*i ,1+2*i ,1+2*i-.5 ,1+2*i),
c(.4 ,.7 , .4 , .4),
col=cols[i+1])
text(2*i,0.5,niv[i+1],cex=1.5)
}
text(8,.5,1,cex=1.5)
text(4,0,'p-value',cex=2)
box()
residus <- arimaSelect.out[[3]][[choix]]$res
par(mar=c(1,2,4,1))
acf(residus,main='')
title('acf',line=.5)
par(mar=c(1,2,4,1))
pacf(residus,main='')
title('pacf',line=.5)
par(mar=c(2,2,4,1))
qqnorm(residus,main='')
title('qq-norm',line=.5)
qqline(residus)
residus
}
if (par2 == 0) x <- log(x)
if (par2 != 0) x <- x^par2
(selection <- arimaSelect(x, order=c(par6,par3,par7), seasonal=list(order=c(par8,par4,par9), period=par5)))
bitmap(file='test1.png')
resid <- arimaSelectplot(selection)
dev.off()
resid
bitmap(file='test2.png')
acf(resid,length(resid)/2, main='Residual Autocorrelation Function')
dev.off()
bitmap(file='test3.png')
pacf(resid,length(resid)/2, main='Residual Partial Autocorrelation Function')
dev.off()
bitmap(file='test4.png')
cpgram(resid, main='Residual Cumulative Periodogram')
dev.off()
bitmap(file='test5.png')
hist(resid, main='Residual Histogram', xlab='values of Residuals')
dev.off()
bitmap(file='test6.png')
densityplot(~resid,col='black',main='Residual Density Plot', xlab='values of Residuals')
dev.off()
bitmap(file='test7.png')
qqnorm(resid, main='Residual Normal Q-Q Plot')
qqline(resid)
dev.off()
ncols <- length(selection[[1]][1,])
nrows <- length(selection[[2]][,1])-1
load(file='createtable')
a<-table.start()
a<-table.row.start(a)
a<-table.element(a,'ARIMA Parameter Estimation and Backward Selection', ncols+1,TRUE)
a<-table.row.end(a)
a<-table.row.start(a)
a<-table.element(a,'Iteration', header=TRUE)
for (i in 1:ncols) {
a<-table.element(a,names(selection[[3]][[1]]$coef)[i],header=TRUE)
}
a<-table.row.end(a)
for (j in 1:nrows) {
a<-table.row.start(a)
mydum <- 'Estimates ('
mydum <- paste(mydum,j)
mydum <- paste(mydum,')')
a<-table.element(a,mydum, header=TRUE)
for (i in 1:ncols) {
a<-table.element(a,round(selection[[1]][j,i],4))
}
a<-table.row.end(a)
a<-table.row.start(a)
a<-table.element(a,'(p-val)', header=TRUE)
for (i in 1:ncols) {
mydum <- '('
mydum <- paste(mydum,round(selection[[2]][j,i],4),sep='')
mydum <- paste(mydum,')')
a<-table.element(a,mydum)
}
a<-table.row.end(a)
}
a<-table.end(a)
table.save(a,file='mytable.tab')
a<-table.start()
a<-table.row.start(a)
a<-table.element(a,'Estimated ARIMA Residuals', 1,TRUE)
a<-table.row.end(a)
a<-table.row.start(a)
a<-table.element(a,'Value', 1,TRUE)
a<-table.row.end(a)
for (i in (par4*par5+par3):length(resid)) {
a<-table.row.start(a)
a<-table.element(a,resid[i])
a<-table.row.end(a)
}
a<-table.end(a)
table.save(a,file='mytable1.tab')