Free Statistics

of Irreproducible Research!

Author's title

Author*Unverified author*
R Software Modulerwasp_notchedbox1.wasp
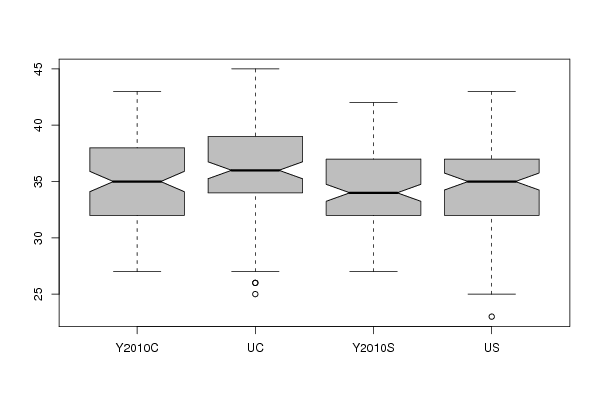
Title produced by softwareNotched Boxplots
Date of computationMon, 11 Oct 2010 22:23:51 +0000
Cite this page as followsStatistical Computations at FreeStatistics.org, Office for Research Development and Education, URL https://freestatistics.org/blog/index.php?v=date/2010/Oct/12/t1286835823kn14i2i57nlz2tm.htm/, Retrieved Tue, 30 Apr 2024 11:07:04 +0000
Statistical Computations at FreeStatistics.org, Office for Research Development and Education, URL https://freestatistics.org/blog/index.php?pk=82748, Retrieved Tue, 30 Apr 2024 11:07:04 +0000
QR Codes:

Original text written by user:
IsPrivate?No (this computation is public)
User-defined keywords
Estimated Impact196
Family? (F = Feedback message, R = changed R code, M = changed R Module, P = changed Parameters, D = changed Data)
-     [Survey Scores] [E-Learn 2008 table 1] [2008-09-07 11:33:54] [b98453cac15ba1066b407e146608df68]
F RM D  [Survey Scores] [ATTLES] [2010-04-05 12:47:13] [b98453cac15ba1066b407e146608df68]
F RMPD    [Notched Boxplots] [Compare ATTLES Sc...] [2010-10-03 17:09:07] [b98453cac15ba1066b407e146608df68]
F             [Notched Boxplots] [work shop 2 task 6] [2010-10-11 22:23:51] [d41d8cd98f00b204e9800998ecf8427e] [Current]
Feedback Forum
2010-10-13 19:01:40 [e6db9a09cb3ba986d5f9cc28edcae776] [reply

Dit antwoord kon nog verduidelijkt worden door te spreken over het feit dat de resultaten onderhevig zijn aan spreiding, dat er naar de mediaan moet gekeken worden (welke niet gevoelig is voor outliers) en de inkepingen van de notched boxplots..

Post a new message
Dataseries X:
41	34	38	30
39	33	32	28
30	29	35	31
31	34	33	35
34	32	37	35
35	35	29	37
39	41	31	39
34	27	36	31
36	40	35	38
37	40	38	37
38	36	31	37
36	40	34	35
38	43	35	37
39	40	38	42
33	33	37	28
32	37	33	37
36	32	32	36
38	26	38	37
39	36	38	33
32	39	32	40
32	38	33	30
31	34	31	36
39	35	38	33
37	41	39	40
39	42	32	37
41	36	32	37
36	39	35	39
33	33	37	35
33	33	33	36
34	36	33	34
31	37	28	36
27	36	32	32
37	34	31	33
34	32	37	27
34	35	30	37
32	39	33	32
29	30	31	31
36	25	33	31
29	29	31	32
35	39	33	37
37	31	32	25
34	26	33	30
38	28	32	37
35	40	33	37
38	32	28	40
37	35	35	35
38	32	39	35
33	41	34	43
36	34	38	32
38	36	32	42
32	38	38	35
32	34	30	27
32	32	33	30
34	34	38	31
32	32	32	36
37	40	32	36
39	43	34	41
29	35	34	34
37	45	36	36
35	36	34	33
30	39	28	35
38	31	34	28
34	36	35	33
31	36	35	38
34	37	31	37
35	40	37	39
36	35	35	34
30	36	27	32
39	32	40	36
35	36	37	36
38	37	36	35
31	42	38	33
34	37	39	42
38	36	41	36
34	36	27	33
39	33	30	36
37	37	37	32
34	35	31	35
28	37	31	38
37	28	27	33
33	33	36	32
37	45	38	38
35	38	37	39
37	43	33	39
32	37	34	39
33	36	31	30
38	40	39	38
33	39	34	38
29	43	32	42
33	32	33	41
31	37	36	31
36	34	32	39
35	44	41	40
32	35	28	31
29	34	30	34
39	37	36	23
37	40	35	28
35	36	31	36
37	44	34	41
32	35	36	29
38	34	36	31
37	40	35	33
36	34	37	35
32	39	28	35
33	36	39	34
40	40	32	40
38	37	35	34
41	35	39	36
36	45	35	35
43	39	42	39


Summary of computational transaction
Raw Inputview raw input (R code)
Raw Outputview raw output of R engine
Computing time1 seconds
R Server'Sir Ronald Aylmer Fisher' @ 193.190.124.24

\begin{tabular}{lllllllll}
\hline
Summary of computational transaction \tabularnewline
Raw Input & view raw input (R code)  \tabularnewline
Raw Output & view raw output of R engine  \tabularnewline
Computing time & 1 seconds \tabularnewline
R Server & 'Sir Ronald Aylmer Fisher' @ 193.190.124.24 \tabularnewline
\hline
\end{tabular}
%Source: https://freestatistics.org/blog/index.php?pk=82748&T=0

[TABLE]
[ROW][C]Summary of computational transaction[/C][/ROW]
[ROW][C]Raw Input[/C][C]view raw input (R code) [/C][/ROW]
[ROW][C]Raw Output[/C][C]view raw output of R engine [/C][/ROW]
[ROW][C]Computing time[/C][C]1 seconds[/C][/ROW]
[ROW][C]R Server[/C][C]'Sir Ronald Aylmer Fisher' @ 193.190.124.24[/C][/ROW]
[/TABLE]
Source: https://freestatistics.org/blog/index.php?pk=82748&T=0

Globally Unique Identifier (entire table): ba.freestatistics.org/blog/index.php?pk=82748&T=0

As an alternative you can also use a QR Code:  

The GUIDs for individual cells are displayed in the table below:

Summary of computational transaction
Raw Inputview raw input (R code)
Raw Outputview raw output of R engine
Computing time1 seconds
R Server'Sir Ronald Aylmer Fisher' @ 193.190.124.24


Boxplot statistics
Variablelower whiskerlower hingemedianupper hingeupper whisker
Y2010C2732353843
UC2734363945
Y2010S2732343742
US2532353743

\begin{tabular}{lllllllll}
\hline
Boxplot statistics \tabularnewline
Variable & lower whisker & lower hinge & median & upper hinge & upper whisker \tabularnewline
Y2010C & 27 & 32 & 35 & 38 & 43 \tabularnewline
UC & 27 & 34 & 36 & 39 & 45 \tabularnewline
Y2010S & 27 & 32 & 34 & 37 & 42 \tabularnewline
US & 25 & 32 & 35 & 37 & 43 \tabularnewline
\hline
\end{tabular}
%Source: https://freestatistics.org/blog/index.php?pk=82748&T=1

[TABLE]
[ROW][C]Boxplot statistics[/C][/ROW]
[ROW][C]Variable[/C][C]lower whisker[/C][C]lower hinge[/C][C]median[/C][C]upper hinge[/C][C]upper whisker[/C][/ROW]
[ROW][C]Y2010C[/C][C]27[/C][C]32[/C][C]35[/C][C]38[/C][C]43[/C][/ROW]
[ROW][C]UC[/C][C]27[/C][C]34[/C][C]36[/C][C]39[/C][C]45[/C][/ROW]
[ROW][C]Y2010S[/C][C]27[/C][C]32[/C][C]34[/C][C]37[/C][C]42[/C][/ROW]
[ROW][C]US[/C][C]25[/C][C]32[/C][C]35[/C][C]37[/C][C]43[/C][/ROW]
[/TABLE]
Source: https://freestatistics.org/blog/index.php?pk=82748&T=1

Globally Unique Identifier (entire table): ba.freestatistics.org/blog/index.php?pk=82748&T=1

As an alternative you can also use a QR Code:  

The GUIDs for individual cells are displayed in the table below:

Boxplot statistics
Variablelower whiskerlower hingemedianupper hingeupper whisker
Y2010C2732353843
UC2734363945
Y2010S2732343742
US2532353743


Boxplot Notches
Variablelower boundmedianupper bound
Y2010C34.09611746539523535.9038825346048
UC35.2467645544963636.753235445504
Y2010S33.2467645544963434.753235445504
US34.2467645544963535.753235445504

\begin{tabular}{lllllllll}
\hline
Boxplot Notches \tabularnewline
Variable & lower bound & median & upper bound \tabularnewline
Y2010C & 34.0961174653952 & 35 & 35.9038825346048 \tabularnewline
UC & 35.246764554496 & 36 & 36.753235445504 \tabularnewline
Y2010S & 33.246764554496 & 34 & 34.753235445504 \tabularnewline
US & 34.246764554496 & 35 & 35.753235445504 \tabularnewline
\hline
\end{tabular}
%Source: https://freestatistics.org/blog/index.php?pk=82748&T=2

[TABLE]
[ROW][C]Boxplot Notches[/C][/ROW]
[ROW][C]Variable[/C][C]lower bound[/C][C]median[/C][C]upper bound[/C][/ROW]
[ROW][C]Y2010C[/C][C]34.0961174653952[/C][C]35[/C][C]35.9038825346048[/C][/ROW]
[ROW][C]UC[/C][C]35.246764554496[/C][C]36[/C][C]36.753235445504[/C][/ROW]
[ROW][C]Y2010S[/C][C]33.246764554496[/C][C]34[/C][C]34.753235445504[/C][/ROW]
[ROW][C]US[/C][C]34.246764554496[/C][C]35[/C][C]35.753235445504[/C][/ROW]
[/TABLE]
Source: https://freestatistics.org/blog/index.php?pk=82748&T=2

Globally Unique Identifier (entire table): ba.freestatistics.org/blog/index.php?pk=82748&T=2

As an alternative you can also use a QR Code:  

The GUIDs for individual cells are displayed in the table below:

Boxplot Notches
Variablelower boundmedianupper bound
Y2010C34.09611746539523535.9038825346048
UC35.2467645544963636.753235445504
Y2010S33.2467645544963434.753235445504
US34.2467645544963535.753235445504


Parameters (Session):
par1 = grey ;
Parameters (R input):
par1 = grey ; par2 = ; par3 = ; par4 = ; par5 = ; par6 = ; par7 = ; par8 = ; par9 = ; par10 = ; par11 = ; par12 = ; par13 = ; par14 = ; par15 = ; par16 = ; par17 = ; par18 = ; par19 = ; par20 = ;
R code (references can be found in the software module):
z <- as.data.frame(t(y))
bitmap(file='test1.png')
(r<-boxplot(z ,xlab=xlab,ylab=ylab,main=main,notch=TRUE,col=par1))
dev.off()
load(file='createtable')
a<-table.start()
a<-table.row.start(a)
a<-table.element(a,hyperlink('overview.htm','Boxplot statistics','Boxplot overview'),6,TRUE)
a<-table.row.end(a)
a<-table.row.start(a)
a<-table.element(a,'Variable',1,TRUE)
a<-table.element(a,hyperlink('lower_whisker.htm','lower whisker','definition of lower whisker'),1,TRUE)
a<-table.element(a,hyperlink('lower_hinge.htm','lower hinge','definition of lower hinge'),1,TRUE)
a<-table.element(a,hyperlink('central_tendency.htm','median','definitions about measures of central tendency'),1,TRUE)
a<-table.element(a,hyperlink('upper_hinge.htm','upper hinge','definition of upper hinge'),1,TRUE)
a<-table.element(a,hyperlink('upper_whisker.htm','upper whisker','definition of upper whisker'),1,TRUE)
a<-table.row.end(a)
for (i in 1:length(y[,1]))
{
a<-table.row.start(a)
a<-table.element(a,dimnames(t(x))[[2]][i],1,TRUE)
for (j in 1:5)
{
a<-table.element(a,r$stats[j,i])
}
a<-table.row.end(a)
}
a<-table.end(a)
table.save(a,file='mytable.tab')
a<-table.start()
a<-table.row.start(a)
a<-table.element(a,'Boxplot Notches',4,TRUE)
a<-table.row.end(a)
a<-table.row.start(a)
a<-table.element(a,'Variable',1,TRUE)
a<-table.element(a,'lower bound',1,TRUE)
a<-table.element(a,'median',1,TRUE)
a<-table.element(a,'upper bound',1,TRUE)
a<-table.row.end(a)
for (i in 1:length(y[,1]))
{
a<-table.row.start(a)
a<-table.element(a,dimnames(t(x))[[2]][i],1,TRUE)
a<-table.element(a,r$conf[1,i])
a<-table.element(a,r$stats[3,i])
a<-table.element(a,r$conf[2,i])
a<-table.row.end(a)
}
a<-table.end(a)
table.save(a,file='mytable1.tab')