Free Statistics

of Irreproducible Research!

Author's title

Author*The author of this computation has been verified*
R Software Modulerwasp_edabi.wasp
Title produced by softwareBivariate Explorative Data Analysis
Date of computationWed, 28 Oct 2009 10:30:59 -0600
Cite this page as followsStatistical Computations at FreeStatistics.org, Office for Research Development and Education, URL https://freestatistics.org/blog/index.php?v=date/2009/Oct/28/t125674749421esaf7bf65j0t3.htm/, Retrieved Sun, 05 May 2024 22:32:26 +0000
Statistical Computations at FreeStatistics.org, Office for Research Development and Education, URL https://freestatistics.org/blog/index.php?pk=51523, Retrieved Sun, 05 May 2024 22:32:26 +0000
QR Codes:

Original text written by user:
IsPrivate?No (this computation is public)
User-defined keywords
Estimated Impact136
Family? (F = Feedback message, R = changed R code, M = changed R Module, P = changed Parameters, D = changed Data)
-     [Bivariate Data Series] [Bivariate dataset] [2008-01-05 23:51:08] [74be16979710d4c4e7c6647856088456]
- RMPD  [Bivariate Explorative Data Analysis] [Bivariate EDA par...] [2009-10-21 15:12:14] [2f74b736c031245eb7b9a6567f4b8492]
-    D    [Bivariate Explorative Data Analysis] [Ln] [2009-10-27 16:19:13] [2f74b736c031245eb7b9a6567f4b8492]
-    D        [Bivariate Explorative Data Analysis] [Bivariate EDA WS5 ] [2009-10-28 16:30:59] [eeda0e496238f8886c14dbbeff6ff613] [Current]
Feedback Forum

Post a new message
Dataseries X:
0,691734054
-0,603641425
-1,069413377
-0,147448407
1,029183073
2,01250241
2,333930551
1,319397202
0,32649893
0,257176114
0,346193629
0,485376091
0,650611214
0,19334454
-0,148315129
0,42790248
0,533270766
1,17934802
1,606804232
0,78677964
0,47418667
0,378274362
0,378811191
0,430049794
0,676127048
0,030049794
0,30734106
0,449000729
0,368902363
1,024021723
1,2550288
0,806267403
0,397762125
0,069232256
0,289793676
0,268695427
0,675590219
0,392807711
0,089256847
-0,172634349
-0,817101116
-0,764458963
-0,914294017
-0,415904503
-0,690181733
-0,991048454
-0,768546656
-1,00525191
-1,595672975
-1,669620313
-2,216771224
-1,61181681
-0,911609874
-0,297076525
-0,184690491
-0,617844881
-1,509132667
-1,362848477
-0,962311649
-0,796002868
-0,697613354
Dataseries Y:
0,523666617
-0,373533875
-0,784207621
-0,402492632
0,114567387
0,703718879
1,151838116
0,675372619
0,346588624
0,400306876
0,459449381
0,48560863
0,662686623
0,324453875
0,229878128
0,147813616
-0,116228858
0,18158413
0,633727867
0,586833622
0,64518887
0,714392625
0,847988378
0,982196626
1,280009615
0,982196626
0,867323619
0,361899366
-0,625677612
-0,621827873
-0,234076134
0,000132114
0,027691117
-0,091644125
0,088845872
-0,025239877
0,046413862
-0,109141878
-0,24474988
-0,485782136
-0,682807867
-0,547374626
-0,580357883
-0,48114514
-0,764259883
-0,731889123
-0,216578381
-0,174321133
-0,634688631
-0,783769886
-1,24877438
-0,811941385
-0,11237912
0,064086377
0,006168864
-0,815965885
-1,443962623
-1,146587369
-0,312991616
0,331277882
0,730490625


Summary of computational transaction
Raw Inputview raw input (R code)
Raw Outputview raw output of R engine
Computing time4 seconds
R Server'RServer@AstonUniversity' @ vre.aston.ac.uk

\begin{tabular}{lllllllll}
\hline
Summary of computational transaction \tabularnewline
Raw Input & view raw input (R code)  \tabularnewline
Raw Output & view raw output of R engine  \tabularnewline
Computing time & 4 seconds \tabularnewline
R Server & 'RServer@AstonUniversity' @ vre.aston.ac.uk \tabularnewline
\hline
\end{tabular}
%Source: https://freestatistics.org/blog/index.php?pk=51523&T=0

[TABLE]
[ROW][C]Summary of computational transaction[/C][/ROW]
[ROW][C]Raw Input[/C][C]view raw input (R code) [/C][/ROW]
[ROW][C]Raw Output[/C][C]view raw output of R engine [/C][/ROW]
[ROW][C]Computing time[/C][C]4 seconds[/C][/ROW]
[ROW][C]R Server[/C][C]'RServer@AstonUniversity' @ vre.aston.ac.uk[/C][/ROW]
[/TABLE]
Source: https://freestatistics.org/blog/index.php?pk=51523&T=0

Globally Unique Identifier (entire table): ba.freestatistics.org/blog/index.php?pk=51523&T=0

As an alternative you can also use a QR Code:  

The GUIDs for individual cells are displayed in the table below:

Summary of computational transaction
Raw Inputview raw input (R code)
Raw Outputview raw output of R engine
Computing time4 seconds
R Server'RServer@AstonUniversity' @ vre.aston.ac.uk


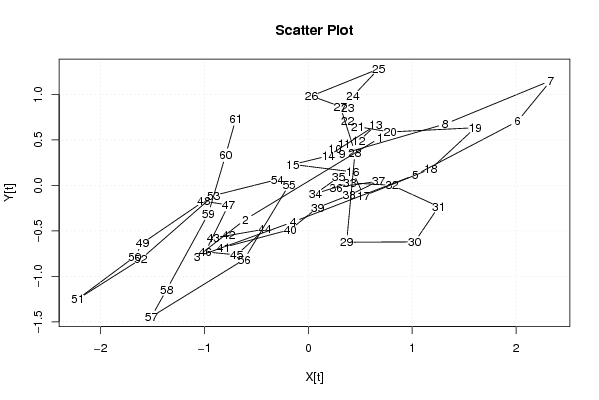
Model: Y[t] = c + b X[t] + e[t]
c-4.23724852828734e-11
b0.471759450988505

\begin{tabular}{lllllllll}
\hline
Model: Y[t] = c + b X[t] + e[t] \tabularnewline
c & -4.23724852828734e-11 \tabularnewline
b & 0.471759450988505 \tabularnewline
\hline
\end{tabular}
%Source: https://freestatistics.org/blog/index.php?pk=51523&T=1

[TABLE]
[ROW][C]Model: Y[t] = c + b X[t] + e[t][/C][/ROW]
[ROW][C]c[/C][C]-4.23724852828734e-11[/C][/ROW]
[ROW][C]b[/C][C]0.471759450988505[/C][/ROW]
[/TABLE]
Source: https://freestatistics.org/blog/index.php?pk=51523&T=1

Globally Unique Identifier (entire table): ba.freestatistics.org/blog/index.php?pk=51523&T=1

As an alternative you can also use a QR Code:  

The GUIDs for individual cells are displayed in the table below:

Model: Y[t] = c + b X[t] + e[t]
c-4.23724852828734e-11
b0.471759450988505


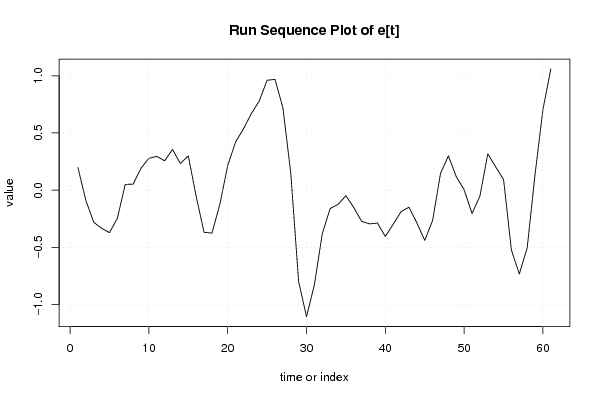
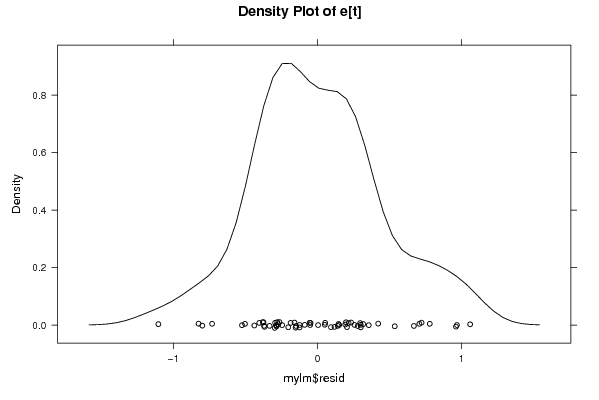
Descriptive Statistics about e[t]
# observations61
minimum-1.10491979880041
Q1-0.286857641095312
median-0.0515515715779848
mean7.21616527916582e-19
Q30.256627871829266
maximum1.05959631792766

\begin{tabular}{lllllllll}
\hline
Descriptive Statistics about e[t] \tabularnewline
# observations & 61 \tabularnewline
minimum & -1.10491979880041 \tabularnewline
Q1 & -0.286857641095312 \tabularnewline
median & -0.0515515715779848 \tabularnewline
mean & 7.21616527916582e-19 \tabularnewline
Q3 & 0.256627871829266 \tabularnewline
maximum & 1.05959631792766 \tabularnewline
\hline
\end{tabular}
%Source: https://freestatistics.org/blog/index.php?pk=51523&T=2

[TABLE]
[ROW][C]Descriptive Statistics about e[t][/C][/ROW]
[ROW][C]# observations[/C][C]61[/C][/ROW]
[ROW][C]minimum[/C][C]-1.10491979880041[/C][/ROW]
[ROW][C]Q1[/C][C]-0.286857641095312[/C][/ROW]
[ROW][C]median[/C][C]-0.0515515715779848[/C][/ROW]
[ROW][C]mean[/C][C]7.21616527916582e-19[/C][/ROW]
[ROW][C]Q3[/C][C]0.256627871829266[/C][/ROW]
[ROW][C]maximum[/C][C]1.05959631792766[/C][/ROW]
[/TABLE]
Source: https://freestatistics.org/blog/index.php?pk=51523&T=2

Globally Unique Identifier (entire table): ba.freestatistics.org/blog/index.php?pk=51523&T=2

As an alternative you can also use a QR Code:  

The GUIDs for individual cells are displayed in the table below:

Descriptive Statistics about e[t]
# observations61
minimum-1.10491979880041
Q1-0.286857641095312
median-0.0515515715779848
mean7.21616527916582e-19
Q30.256627871829266
maximum1.05959631792766


Parameters (Session):
par1 = 0 ; par2 = 36 ;
Parameters (R input):
par1 = 0 ; par2 = 36 ;
R code (references can be found in the software module):
par1 <- as.numeric(par1)
par2 <- as.numeric(par2)
x <- as.ts(x)
y <- as.ts(y)
mylm <- lm(y~x)
cbind(mylm$resid)
library(lattice)
bitmap(file='pic1.png')
plot(y,type='l',main='Run Sequence Plot of Y[t]',xlab='time or index',ylab='value')
grid()
dev.off()
bitmap(file='pic1a.png')
plot(x,type='l',main='Run Sequence Plot of X[t]',xlab='time or index',ylab='value')
grid()
dev.off()
bitmap(file='pic1b.png')
plot(x,y,main='Scatter Plot',xlab='X[t]',ylab='Y[t]')
grid()
dev.off()
bitmap(file='pic1c.png')
plot(mylm$resid,type='l',main='Run Sequence Plot of e[t]',xlab='time or index',ylab='value')
grid()
dev.off()
bitmap(file='pic2.png')
hist(mylm$resid,main='Histogram of e[t]')
dev.off()
bitmap(file='pic3.png')
if (par1 > 0)
{
densityplot(~mylm$resid,col='black',main=paste('Density Plot of e[t] bw = ',par1),bw=par1)
} else {
densityplot(~mylm$resid,col='black',main='Density Plot of e[t]')
}
dev.off()
bitmap(file='pic4.png')
qqnorm(mylm$resid,main='QQ plot of e[t]')
qqline(mylm$resid)
grid()
dev.off()
if (par2 > 0)
{
bitmap(file='pic5.png')
acf(mylm$resid,lag.max=par2,main='Residual Autocorrelation Function')
grid()
dev.off()
}
summary(x)
load(file='createtable')
a<-table.start()
a<-table.row.start(a)
a<-table.element(a,'Model: Y[t] = c + b X[t] + e[t]',2,TRUE)
a<-table.row.end(a)
a<-table.row.start(a)
a<-table.element(a,'c',1,TRUE)
a<-table.element(a,mylm$coeff[[1]])
a<-table.row.end(a)
a<-table.row.start(a)
a<-table.element(a,'b',1,TRUE)
a<-table.element(a,mylm$coeff[[2]])
a<-table.row.end(a)
a<-table.end(a)
table.save(a,file='mytable.tab')
a<-table.start()
a<-table.row.start(a)
a<-table.element(a,'Descriptive Statistics about e[t]',2,TRUE)
a<-table.row.end(a)
a<-table.row.start(a)
a<-table.element(a,'# observations',header=TRUE)
a<-table.element(a,length(mylm$resid))
a<-table.row.end(a)
a<-table.row.start(a)
a<-table.element(a,'minimum',header=TRUE)
a<-table.element(a,min(mylm$resid))
a<-table.row.end(a)
a<-table.row.start(a)
a<-table.element(a,'Q1',header=TRUE)
a<-table.element(a,quantile(mylm$resid,0.25))
a<-table.row.end(a)
a<-table.row.start(a)
a<-table.element(a,'median',header=TRUE)
a<-table.element(a,median(mylm$resid))
a<-table.row.end(a)
a<-table.row.start(a)
a<-table.element(a,'mean',header=TRUE)
a<-table.element(a,mean(mylm$resid))
a<-table.row.end(a)
a<-table.row.start(a)
a<-table.element(a,'Q3',header=TRUE)
a<-table.element(a,quantile(mylm$resid,0.75))
a<-table.row.end(a)
a<-table.row.start(a)
a<-table.element(a,'maximum',header=TRUE)
a<-table.element(a,max(mylm$resid))
a<-table.row.end(a)
a<-table.end(a)
table.save(a,file='mytable.tab')