Free Statistics

of Irreproducible Research!

Author's title

Author*The author of this computation has been verified*
R Software Modulerwasp_centraltendency.wasp
Title produced by softwareCentral Tendency
Date of computationSun, 18 Oct 2009 08:30:03 -0600
Cite this page as followsStatistical Computations at FreeStatistics.org, Office for Research Development and Education, URL https://freestatistics.org/blog/index.php?v=date/2009/Oct/18/t1255876421q5mxmwpcr2boje1.htm/, Retrieved Mon, 29 Apr 2024 14:55:23 +0000
Statistical Computations at FreeStatistics.org, Office for Research Development and Education, URL https://freestatistics.org/blog/index.php?pk=47324, Retrieved Mon, 29 Apr 2024 14:55:23 +0000
QR Codes:

Original text written by user:
IsPrivate?No (this computation is public)
User-defined keywords
Estimated Impact184
Family? (F = Feedback message, R = changed R code, M = changed R Module, P = changed Parameters, D = changed Data)
F     [Univariate Data Series] [Gemiddelde renden...] [2008-10-13 19:42:56] [86c69698417c3ad89592e76776a2c65b]
-   PD  [Univariate Data Series] [Werkloosheid in BE] [2009-10-11 19:20:59] [5c968c05ca472afa314d272082b56b09]
- RMP       [Central Tendency] [Voorspelling voor...] [2009-10-18 14:30:03] [b8ce264f75295a954feffaf60221d1b0] [Current]
Feedback Forum

Post a new message
Dataseries X:
476
475
470
461
455
456
517
525
523
519
509
512
519
517
510
509
501
507
569
580
578
565
547
555
562
561
555
544
537
543
594
611
613
611
594
595
591
589
584
573
567
569
621
629
628
612
595
597
593
590
580
574
573
573
620
626
620
588
566
557
561
549
532
526
511
499
555
565
542
527
510
514


Summary of computational transaction
Raw Inputview raw input (R code)
Raw Outputview raw output of R engine
Computing time2 seconds
R Server'Sir Ronald Aylmer Fisher' @ 193.190.124.24

\begin{tabular}{lllllllll}
\hline
Summary of computational transaction \tabularnewline
Raw Input & view raw input (R code)  \tabularnewline
Raw Output & view raw output of R engine  \tabularnewline
Computing time & 2 seconds \tabularnewline
R Server & 'Sir Ronald Aylmer Fisher' @ 193.190.124.24 \tabularnewline
\hline
\end{tabular}
%Source: https://freestatistics.org/blog/index.php?pk=47324&T=0

[TABLE]
[ROW][C]Summary of computational transaction[/C][/ROW]
[ROW][C]Raw Input[/C][C]view raw input (R code) [/C][/ROW]
[ROW][C]Raw Output[/C][C]view raw output of R engine [/C][/ROW]
[ROW][C]Computing time[/C][C]2 seconds[/C][/ROW]
[ROW][C]R Server[/C][C]'Sir Ronald Aylmer Fisher' @ 193.190.124.24[/C][/ROW]
[/TABLE]
Source: https://freestatistics.org/blog/index.php?pk=47324&T=0

Globally Unique Identifier (entire table): ba.freestatistics.org/blog/index.php?pk=47324&T=0

As an alternative you can also use a QR Code:  

The GUIDs for individual cells are displayed in the table below:

Summary of computational transaction
Raw Inputview raw input (R code)
Raw Outputview raw output of R engine
Computing time2 seconds
R Server'Sir Ronald Aylmer Fisher' @ 193.190.124.24


Central Tendency - Ungrouped Data
MeasureValueS.E.Value/S.E.
Arithmetic Mean553.9027777777785.26348628204207105.234961790929
Geometric Mean552.085911947097
Harmonic Mean550.227758623616
Quadratic Mean555.675527323875
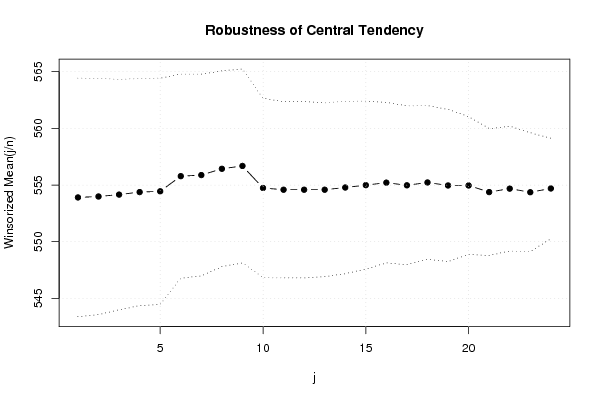
Winsorized Mean ( 1 / 24 )553.9027777777785.25705278270828105.363746698473
Winsorized Mean ( 2 / 24 )553.9861111111115.21045705267702106.321980108537
Winsorized Mean ( 3 / 24 )554.1527777777785.07994228932192109.086431738134
Winsorized Mean ( 4 / 24 )554.3755.00623388772979110.736935675092
Winsorized Mean ( 5 / 24 )554.4444444444444.9907931230635111.093453640112
Winsorized Mean ( 6 / 24 )555.7777777777784.49987924643332123.509487108637
Winsorized Mean ( 7 / 24 )555.8754.44836211087672124.961724370601
Winsorized Mean ( 8 / 24 )556.4305555555564.31686226780035128.896990692984
Winsorized Mean ( 9 / 24 )556.6805555555564.27707368501842130.154539423877
Winsorized Mean ( 10 / 24 )554.7361111111113.95579016674692140.233957749914
Winsorized Mean ( 11 / 24 )554.5833333333333.88562768467494142.726832918303
Winsorized Mean ( 12 / 24 )554.5833333333333.88562768467494142.726832918303
Winsorized Mean ( 13 / 24 )554.5833333333333.83025749225349144.790091646567
Winsorized Mean ( 14 / 24 )554.7777777777783.79925772248619146.022675559566
Winsorized Mean ( 15 / 24 )554.9861111111113.70353281915378149.853164049433
Winsorized Mean ( 16 / 24 )555.2083333333333.53702402140734156.970472909716
Winsorized Mean ( 17 / 24 )554.9722222222223.50357364072107158.40175750038
Winsorized Mean ( 18 / 24 )555.2222222222223.39267727397942163.653120348514
Winsorized Mean ( 19 / 24 )554.9583333333333.35587667459430165.369108327088
Winsorized Mean ( 20 / 24 )554.9583333333333.03767665496081182.691706975143
Winsorized Mean ( 21 / 24 )554.3752.79737171944956198.177094644070
Winsorized Mean ( 22 / 24 )554.6805555555562.75235184600894201.529668657687
Winsorized Mean ( 23 / 24 )554.3611111111112.62349931435255211.305986656193
Winsorized Mean ( 24 / 24 )554.6944444444442.21388056835205250.553011925726
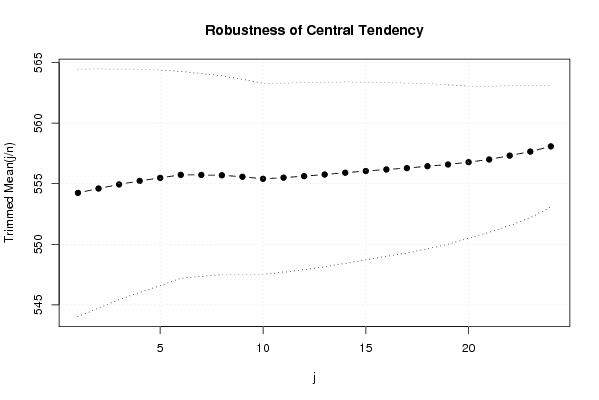
Trimmed Mean ( 1 / 24 )554.2428571428575.11148731517581108.430838808370
Trimmed Mean ( 2 / 24 )554.6029411764714.93803302902422112.312521588391
Trimmed Mean ( 3 / 24 )554.9393939393944.76065257656154116.567925303259
Trimmed Mean ( 4 / 24 )555.2343754.60878981353966120.472921843569
Trimmed Mean ( 5 / 24 )555.4838709677424.4533982731759124.732583275469
Trimmed Mean ( 6 / 24 )555.7333333333334.26931415036431130.169229473524
Trimmed Mean ( 7 / 24 )555.7241379310354.18946285025335132.648064392653
Trimmed Mean ( 8 / 24 )555.6964285714294.1035239561867135.419321174823
Trimmed Mean ( 9 / 24 )555.5740740740744.02790769849179137.931183051216
Trimmed Mean ( 10 / 24 )555.4038461538463.94104935220549140.927909426719
Trimmed Mean ( 11 / 24 )555.53.90219718327289142.355697036839
Trimmed Mean ( 12 / 24 )555.6253.86354403595074143.812260150226
Trimmed Mean ( 13 / 24 )555.7608695652173.80962229258785145.883456910289
Trimmed Mean ( 14 / 24 )555.9090909090913.74784196986712148.327783129234
Trimmed Mean ( 15 / 24 )556.0476190476193.6701945409727151.503581851073
Trimmed Mean ( 16 / 24 )556.1753.58609985631845155.091888760448
Trimmed Mean ( 17 / 24 )556.289473684213.50916457025508158.52476067937
Trimmed Mean ( 18 / 24 )556.4444444444443.40784446242350163.283404093133
Trimmed Mean ( 19 / 24 )556.5882352941183.29346504867485168.997765899494
Trimmed Mean ( 20 / 24 )556.781253.13819291763691177.420975896938
Trimmed Mean ( 21 / 24 )5573.01070885608223185.006264845154
Trimmed Mean ( 22 / 24 )557.3214285714292.89364088932471192.60214030964
Trimmed Mean ( 23 / 24 )557.6538461538462.72647549760735204.532865467972
Trimmed Mean ( 24 / 24 )558.0833333333332.50862040342943222.466233859217
Median561
Midrange542
Midmean - Weighted Average at Xnp554.368421052632
Midmean - Weighted Average at X(n+1)p556.444444444444
Midmean - Empirical Distribution Function554.368421052632
Midmean - Empirical Distribution Function - Averaging556.444444444444
Midmean - Empirical Distribution Function - Interpolation556.444444444444
Midmean - Closest Observation554.368421052632
Midmean - True Basic - Statistics Graphics Toolkit556.444444444444
Midmean - MS Excel (old versions)555.282051282051
Number of observations72

\begin{tabular}{lllllllll}
\hline
Central Tendency - Ungrouped Data \tabularnewline
Measure & Value & S.E. & Value/S.E. \tabularnewline
Arithmetic Mean & 553.902777777778 & 5.26348628204207 & 105.234961790929 \tabularnewline
Geometric Mean & 552.085911947097 &  &  \tabularnewline
Harmonic Mean & 550.227758623616 &  &  \tabularnewline
Quadratic Mean & 555.675527323875 &  &  \tabularnewline
Winsorized Mean ( 1 / 24 ) & 553.902777777778 & 5.25705278270828 & 105.363746698473 \tabularnewline
Winsorized Mean ( 2 / 24 ) & 553.986111111111 & 5.21045705267702 & 106.321980108537 \tabularnewline
Winsorized Mean ( 3 / 24 ) & 554.152777777778 & 5.07994228932192 & 109.086431738134 \tabularnewline
Winsorized Mean ( 4 / 24 ) & 554.375 & 5.00623388772979 & 110.736935675092 \tabularnewline
Winsorized Mean ( 5 / 24 ) & 554.444444444444 & 4.9907931230635 & 111.093453640112 \tabularnewline
Winsorized Mean ( 6 / 24 ) & 555.777777777778 & 4.49987924643332 & 123.509487108637 \tabularnewline
Winsorized Mean ( 7 / 24 ) & 555.875 & 4.44836211087672 & 124.961724370601 \tabularnewline
Winsorized Mean ( 8 / 24 ) & 556.430555555556 & 4.31686226780035 & 128.896990692984 \tabularnewline
Winsorized Mean ( 9 / 24 ) & 556.680555555556 & 4.27707368501842 & 130.154539423877 \tabularnewline
Winsorized Mean ( 10 / 24 ) & 554.736111111111 & 3.95579016674692 & 140.233957749914 \tabularnewline
Winsorized Mean ( 11 / 24 ) & 554.583333333333 & 3.88562768467494 & 142.726832918303 \tabularnewline
Winsorized Mean ( 12 / 24 ) & 554.583333333333 & 3.88562768467494 & 142.726832918303 \tabularnewline
Winsorized Mean ( 13 / 24 ) & 554.583333333333 & 3.83025749225349 & 144.790091646567 \tabularnewline
Winsorized Mean ( 14 / 24 ) & 554.777777777778 & 3.79925772248619 & 146.022675559566 \tabularnewline
Winsorized Mean ( 15 / 24 ) & 554.986111111111 & 3.70353281915378 & 149.853164049433 \tabularnewline
Winsorized Mean ( 16 / 24 ) & 555.208333333333 & 3.53702402140734 & 156.970472909716 \tabularnewline
Winsorized Mean ( 17 / 24 ) & 554.972222222222 & 3.50357364072107 & 158.40175750038 \tabularnewline
Winsorized Mean ( 18 / 24 ) & 555.222222222222 & 3.39267727397942 & 163.653120348514 \tabularnewline
Winsorized Mean ( 19 / 24 ) & 554.958333333333 & 3.35587667459430 & 165.369108327088 \tabularnewline
Winsorized Mean ( 20 / 24 ) & 554.958333333333 & 3.03767665496081 & 182.691706975143 \tabularnewline
Winsorized Mean ( 21 / 24 ) & 554.375 & 2.79737171944956 & 198.177094644070 \tabularnewline
Winsorized Mean ( 22 / 24 ) & 554.680555555556 & 2.75235184600894 & 201.529668657687 \tabularnewline
Winsorized Mean ( 23 / 24 ) & 554.361111111111 & 2.62349931435255 & 211.305986656193 \tabularnewline
Winsorized Mean ( 24 / 24 ) & 554.694444444444 & 2.21388056835205 & 250.553011925726 \tabularnewline
Trimmed Mean ( 1 / 24 ) & 554.242857142857 & 5.11148731517581 & 108.430838808370 \tabularnewline
Trimmed Mean ( 2 / 24 ) & 554.602941176471 & 4.93803302902422 & 112.312521588391 \tabularnewline
Trimmed Mean ( 3 / 24 ) & 554.939393939394 & 4.76065257656154 & 116.567925303259 \tabularnewline
Trimmed Mean ( 4 / 24 ) & 555.234375 & 4.60878981353966 & 120.472921843569 \tabularnewline
Trimmed Mean ( 5 / 24 ) & 555.483870967742 & 4.4533982731759 & 124.732583275469 \tabularnewline
Trimmed Mean ( 6 / 24 ) & 555.733333333333 & 4.26931415036431 & 130.169229473524 \tabularnewline
Trimmed Mean ( 7 / 24 ) & 555.724137931035 & 4.18946285025335 & 132.648064392653 \tabularnewline
Trimmed Mean ( 8 / 24 ) & 555.696428571429 & 4.1035239561867 & 135.419321174823 \tabularnewline
Trimmed Mean ( 9 / 24 ) & 555.574074074074 & 4.02790769849179 & 137.931183051216 \tabularnewline
Trimmed Mean ( 10 / 24 ) & 555.403846153846 & 3.94104935220549 & 140.927909426719 \tabularnewline
Trimmed Mean ( 11 / 24 ) & 555.5 & 3.90219718327289 & 142.355697036839 \tabularnewline
Trimmed Mean ( 12 / 24 ) & 555.625 & 3.86354403595074 & 143.812260150226 \tabularnewline
Trimmed Mean ( 13 / 24 ) & 555.760869565217 & 3.80962229258785 & 145.883456910289 \tabularnewline
Trimmed Mean ( 14 / 24 ) & 555.909090909091 & 3.74784196986712 & 148.327783129234 \tabularnewline
Trimmed Mean ( 15 / 24 ) & 556.047619047619 & 3.6701945409727 & 151.503581851073 \tabularnewline
Trimmed Mean ( 16 / 24 ) & 556.175 & 3.58609985631845 & 155.091888760448 \tabularnewline
Trimmed Mean ( 17 / 24 ) & 556.28947368421 & 3.50916457025508 & 158.52476067937 \tabularnewline
Trimmed Mean ( 18 / 24 ) & 556.444444444444 & 3.40784446242350 & 163.283404093133 \tabularnewline
Trimmed Mean ( 19 / 24 ) & 556.588235294118 & 3.29346504867485 & 168.997765899494 \tabularnewline
Trimmed Mean ( 20 / 24 ) & 556.78125 & 3.13819291763691 & 177.420975896938 \tabularnewline
Trimmed Mean ( 21 / 24 ) & 557 & 3.01070885608223 & 185.006264845154 \tabularnewline
Trimmed Mean ( 22 / 24 ) & 557.321428571429 & 2.89364088932471 & 192.60214030964 \tabularnewline
Trimmed Mean ( 23 / 24 ) & 557.653846153846 & 2.72647549760735 & 204.532865467972 \tabularnewline
Trimmed Mean ( 24 / 24 ) & 558.083333333333 & 2.50862040342943 & 222.466233859217 \tabularnewline
Median & 561 &  &  \tabularnewline
Midrange & 542 &  &  \tabularnewline
Midmean - Weighted Average at Xnp & 554.368421052632 &  &  \tabularnewline
Midmean - Weighted Average at X(n+1)p & 556.444444444444 &  &  \tabularnewline
Midmean - Empirical Distribution Function & 554.368421052632 &  &  \tabularnewline
Midmean - Empirical Distribution Function - Averaging & 556.444444444444 &  &  \tabularnewline
Midmean - Empirical Distribution Function - Interpolation & 556.444444444444 &  &  \tabularnewline
Midmean - Closest Observation & 554.368421052632 &  &  \tabularnewline
Midmean - True Basic - Statistics Graphics Toolkit & 556.444444444444 &  &  \tabularnewline
Midmean - MS Excel (old versions) & 555.282051282051 &  &  \tabularnewline
Number of observations & 72 &  &  \tabularnewline
\hline
\end{tabular}
%Source: https://freestatistics.org/blog/index.php?pk=47324&T=1

[TABLE]
[ROW][C]Central Tendency - Ungrouped Data[/C][/ROW]
[ROW][C]Measure[/C][C]Value[/C][C]S.E.[/C][C]Value/S.E.[/C][/ROW]
[ROW][C]Arithmetic Mean[/C][C]553.902777777778[/C][C]5.26348628204207[/C][C]105.234961790929[/C][/ROW]
[ROW][C]Geometric Mean[/C][C]552.085911947097[/C][C][/C][C][/C][/ROW]
[ROW][C]Harmonic Mean[/C][C]550.227758623616[/C][C][/C][C][/C][/ROW]
[ROW][C]Quadratic Mean[/C][C]555.675527323875[/C][C][/C][C][/C][/ROW]
[ROW][C]Winsorized Mean ( 1 / 24 )[/C][C]553.902777777778[/C][C]5.25705278270828[/C][C]105.363746698473[/C][/ROW]
[ROW][C]Winsorized Mean ( 2 / 24 )[/C][C]553.986111111111[/C][C]5.21045705267702[/C][C]106.321980108537[/C][/ROW]
[ROW][C]Winsorized Mean ( 3 / 24 )[/C][C]554.152777777778[/C][C]5.07994228932192[/C][C]109.086431738134[/C][/ROW]
[ROW][C]Winsorized Mean ( 4 / 24 )[/C][C]554.375[/C][C]5.00623388772979[/C][C]110.736935675092[/C][/ROW]
[ROW][C]Winsorized Mean ( 5 / 24 )[/C][C]554.444444444444[/C][C]4.9907931230635[/C][C]111.093453640112[/C][/ROW]
[ROW][C]Winsorized Mean ( 6 / 24 )[/C][C]555.777777777778[/C][C]4.49987924643332[/C][C]123.509487108637[/C][/ROW]
[ROW][C]Winsorized Mean ( 7 / 24 )[/C][C]555.875[/C][C]4.44836211087672[/C][C]124.961724370601[/C][/ROW]
[ROW][C]Winsorized Mean ( 8 / 24 )[/C][C]556.430555555556[/C][C]4.31686226780035[/C][C]128.896990692984[/C][/ROW]
[ROW][C]Winsorized Mean ( 9 / 24 )[/C][C]556.680555555556[/C][C]4.27707368501842[/C][C]130.154539423877[/C][/ROW]
[ROW][C]Winsorized Mean ( 10 / 24 )[/C][C]554.736111111111[/C][C]3.95579016674692[/C][C]140.233957749914[/C][/ROW]
[ROW][C]Winsorized Mean ( 11 / 24 )[/C][C]554.583333333333[/C][C]3.88562768467494[/C][C]142.726832918303[/C][/ROW]
[ROW][C]Winsorized Mean ( 12 / 24 )[/C][C]554.583333333333[/C][C]3.88562768467494[/C][C]142.726832918303[/C][/ROW]
[ROW][C]Winsorized Mean ( 13 / 24 )[/C][C]554.583333333333[/C][C]3.83025749225349[/C][C]144.790091646567[/C][/ROW]
[ROW][C]Winsorized Mean ( 14 / 24 )[/C][C]554.777777777778[/C][C]3.79925772248619[/C][C]146.022675559566[/C][/ROW]
[ROW][C]Winsorized Mean ( 15 / 24 )[/C][C]554.986111111111[/C][C]3.70353281915378[/C][C]149.853164049433[/C][/ROW]
[ROW][C]Winsorized Mean ( 16 / 24 )[/C][C]555.208333333333[/C][C]3.53702402140734[/C][C]156.970472909716[/C][/ROW]
[ROW][C]Winsorized Mean ( 17 / 24 )[/C][C]554.972222222222[/C][C]3.50357364072107[/C][C]158.40175750038[/C][/ROW]
[ROW][C]Winsorized Mean ( 18 / 24 )[/C][C]555.222222222222[/C][C]3.39267727397942[/C][C]163.653120348514[/C][/ROW]
[ROW][C]Winsorized Mean ( 19 / 24 )[/C][C]554.958333333333[/C][C]3.35587667459430[/C][C]165.369108327088[/C][/ROW]
[ROW][C]Winsorized Mean ( 20 / 24 )[/C][C]554.958333333333[/C][C]3.03767665496081[/C][C]182.691706975143[/C][/ROW]
[ROW][C]Winsorized Mean ( 21 / 24 )[/C][C]554.375[/C][C]2.79737171944956[/C][C]198.177094644070[/C][/ROW]
[ROW][C]Winsorized Mean ( 22 / 24 )[/C][C]554.680555555556[/C][C]2.75235184600894[/C][C]201.529668657687[/C][/ROW]
[ROW][C]Winsorized Mean ( 23 / 24 )[/C][C]554.361111111111[/C][C]2.62349931435255[/C][C]211.305986656193[/C][/ROW]
[ROW][C]Winsorized Mean ( 24 / 24 )[/C][C]554.694444444444[/C][C]2.21388056835205[/C][C]250.553011925726[/C][/ROW]
[ROW][C]Trimmed Mean ( 1 / 24 )[/C][C]554.242857142857[/C][C]5.11148731517581[/C][C]108.430838808370[/C][/ROW]
[ROW][C]Trimmed Mean ( 2 / 24 )[/C][C]554.602941176471[/C][C]4.93803302902422[/C][C]112.312521588391[/C][/ROW]
[ROW][C]Trimmed Mean ( 3 / 24 )[/C][C]554.939393939394[/C][C]4.76065257656154[/C][C]116.567925303259[/C][/ROW]
[ROW][C]Trimmed Mean ( 4 / 24 )[/C][C]555.234375[/C][C]4.60878981353966[/C][C]120.472921843569[/C][/ROW]
[ROW][C]Trimmed Mean ( 5 / 24 )[/C][C]555.483870967742[/C][C]4.4533982731759[/C][C]124.732583275469[/C][/ROW]
[ROW][C]Trimmed Mean ( 6 / 24 )[/C][C]555.733333333333[/C][C]4.26931415036431[/C][C]130.169229473524[/C][/ROW]
[ROW][C]Trimmed Mean ( 7 / 24 )[/C][C]555.724137931035[/C][C]4.18946285025335[/C][C]132.648064392653[/C][/ROW]
[ROW][C]Trimmed Mean ( 8 / 24 )[/C][C]555.696428571429[/C][C]4.1035239561867[/C][C]135.419321174823[/C][/ROW]
[ROW][C]Trimmed Mean ( 9 / 24 )[/C][C]555.574074074074[/C][C]4.02790769849179[/C][C]137.931183051216[/C][/ROW]
[ROW][C]Trimmed Mean ( 10 / 24 )[/C][C]555.403846153846[/C][C]3.94104935220549[/C][C]140.927909426719[/C][/ROW]
[ROW][C]Trimmed Mean ( 11 / 24 )[/C][C]555.5[/C][C]3.90219718327289[/C][C]142.355697036839[/C][/ROW]
[ROW][C]Trimmed Mean ( 12 / 24 )[/C][C]555.625[/C][C]3.86354403595074[/C][C]143.812260150226[/C][/ROW]
[ROW][C]Trimmed Mean ( 13 / 24 )[/C][C]555.760869565217[/C][C]3.80962229258785[/C][C]145.883456910289[/C][/ROW]
[ROW][C]Trimmed Mean ( 14 / 24 )[/C][C]555.909090909091[/C][C]3.74784196986712[/C][C]148.327783129234[/C][/ROW]
[ROW][C]Trimmed Mean ( 15 / 24 )[/C][C]556.047619047619[/C][C]3.6701945409727[/C][C]151.503581851073[/C][/ROW]
[ROW][C]Trimmed Mean ( 16 / 24 )[/C][C]556.175[/C][C]3.58609985631845[/C][C]155.091888760448[/C][/ROW]
[ROW][C]Trimmed Mean ( 17 / 24 )[/C][C]556.28947368421[/C][C]3.50916457025508[/C][C]158.52476067937[/C][/ROW]
[ROW][C]Trimmed Mean ( 18 / 24 )[/C][C]556.444444444444[/C][C]3.40784446242350[/C][C]163.283404093133[/C][/ROW]
[ROW][C]Trimmed Mean ( 19 / 24 )[/C][C]556.588235294118[/C][C]3.29346504867485[/C][C]168.997765899494[/C][/ROW]
[ROW][C]Trimmed Mean ( 20 / 24 )[/C][C]556.78125[/C][C]3.13819291763691[/C][C]177.420975896938[/C][/ROW]
[ROW][C]Trimmed Mean ( 21 / 24 )[/C][C]557[/C][C]3.01070885608223[/C][C]185.006264845154[/C][/ROW]
[ROW][C]Trimmed Mean ( 22 / 24 )[/C][C]557.321428571429[/C][C]2.89364088932471[/C][C]192.60214030964[/C][/ROW]
[ROW][C]Trimmed Mean ( 23 / 24 )[/C][C]557.653846153846[/C][C]2.72647549760735[/C][C]204.532865467972[/C][/ROW]
[ROW][C]Trimmed Mean ( 24 / 24 )[/C][C]558.083333333333[/C][C]2.50862040342943[/C][C]222.466233859217[/C][/ROW]
[ROW][C]Median[/C][C]561[/C][C][/C][C][/C][/ROW]
[ROW][C]Midrange[/C][C]542[/C][C][/C][C][/C][/ROW]
[ROW][C]Midmean - Weighted Average at Xnp[/C][C]554.368421052632[/C][C][/C][C][/C][/ROW]
[ROW][C]Midmean - Weighted Average at X(n+1)p[/C][C]556.444444444444[/C][C][/C][C][/C][/ROW]
[ROW][C]Midmean - Empirical Distribution Function[/C][C]554.368421052632[/C][C][/C][C][/C][/ROW]
[ROW][C]Midmean - Empirical Distribution Function - Averaging[/C][C]556.444444444444[/C][C][/C][C][/C][/ROW]
[ROW][C]Midmean - Empirical Distribution Function - Interpolation[/C][C]556.444444444444[/C][C][/C][C][/C][/ROW]
[ROW][C]Midmean - Closest Observation[/C][C]554.368421052632[/C][C][/C][C][/C][/ROW]
[ROW][C]Midmean - True Basic - Statistics Graphics Toolkit[/C][C]556.444444444444[/C][C][/C][C][/C][/ROW]
[ROW][C]Midmean - MS Excel (old versions)[/C][C]555.282051282051[/C][C][/C][C][/C][/ROW]
[ROW][C]Number of observations[/C][C]72[/C][C][/C][C][/C][/ROW]
[/TABLE]
Source: https://freestatistics.org/blog/index.php?pk=47324&T=1

Globally Unique Identifier (entire table): ba.freestatistics.org/blog/index.php?pk=47324&T=1

As an alternative you can also use a QR Code:  

The GUIDs for individual cells are displayed in the table below:

Central Tendency - Ungrouped Data
MeasureValueS.E.Value/S.E.
Arithmetic Mean553.9027777777785.26348628204207105.234961790929
Geometric Mean552.085911947097
Harmonic Mean550.227758623616
Quadratic Mean555.675527323875
Winsorized Mean ( 1 / 24 )553.9027777777785.25705278270828105.363746698473
Winsorized Mean ( 2 / 24 )553.9861111111115.21045705267702106.321980108537
Winsorized Mean ( 3 / 24 )554.1527777777785.07994228932192109.086431738134
Winsorized Mean ( 4 / 24 )554.3755.00623388772979110.736935675092
Winsorized Mean ( 5 / 24 )554.4444444444444.9907931230635111.093453640112
Winsorized Mean ( 6 / 24 )555.7777777777784.49987924643332123.509487108637
Winsorized Mean ( 7 / 24 )555.8754.44836211087672124.961724370601
Winsorized Mean ( 8 / 24 )556.4305555555564.31686226780035128.896990692984
Winsorized Mean ( 9 / 24 )556.6805555555564.27707368501842130.154539423877
Winsorized Mean ( 10 / 24 )554.7361111111113.95579016674692140.233957749914
Winsorized Mean ( 11 / 24 )554.5833333333333.88562768467494142.726832918303
Winsorized Mean ( 12 / 24 )554.5833333333333.88562768467494142.726832918303
Winsorized Mean ( 13 / 24 )554.5833333333333.83025749225349144.790091646567
Winsorized Mean ( 14 / 24 )554.7777777777783.79925772248619146.022675559566
Winsorized Mean ( 15 / 24 )554.9861111111113.70353281915378149.853164049433
Winsorized Mean ( 16 / 24 )555.2083333333333.53702402140734156.970472909716
Winsorized Mean ( 17 / 24 )554.9722222222223.50357364072107158.40175750038
Winsorized Mean ( 18 / 24 )555.2222222222223.39267727397942163.653120348514
Winsorized Mean ( 19 / 24 )554.9583333333333.35587667459430165.369108327088
Winsorized Mean ( 20 / 24 )554.9583333333333.03767665496081182.691706975143
Winsorized Mean ( 21 / 24 )554.3752.79737171944956198.177094644070
Winsorized Mean ( 22 / 24 )554.6805555555562.75235184600894201.529668657687
Winsorized Mean ( 23 / 24 )554.3611111111112.62349931435255211.305986656193
Winsorized Mean ( 24 / 24 )554.6944444444442.21388056835205250.553011925726
Trimmed Mean ( 1 / 24 )554.2428571428575.11148731517581108.430838808370
Trimmed Mean ( 2 / 24 )554.6029411764714.93803302902422112.312521588391
Trimmed Mean ( 3 / 24 )554.9393939393944.76065257656154116.567925303259
Trimmed Mean ( 4 / 24 )555.2343754.60878981353966120.472921843569
Trimmed Mean ( 5 / 24 )555.4838709677424.4533982731759124.732583275469
Trimmed Mean ( 6 / 24 )555.7333333333334.26931415036431130.169229473524
Trimmed Mean ( 7 / 24 )555.7241379310354.18946285025335132.648064392653
Trimmed Mean ( 8 / 24 )555.6964285714294.1035239561867135.419321174823
Trimmed Mean ( 9 / 24 )555.5740740740744.02790769849179137.931183051216
Trimmed Mean ( 10 / 24 )555.4038461538463.94104935220549140.927909426719
Trimmed Mean ( 11 / 24 )555.53.90219718327289142.355697036839
Trimmed Mean ( 12 / 24 )555.6253.86354403595074143.812260150226
Trimmed Mean ( 13 / 24 )555.7608695652173.80962229258785145.883456910289
Trimmed Mean ( 14 / 24 )555.9090909090913.74784196986712148.327783129234
Trimmed Mean ( 15 / 24 )556.0476190476193.6701945409727151.503581851073
Trimmed Mean ( 16 / 24 )556.1753.58609985631845155.091888760448
Trimmed Mean ( 17 / 24 )556.289473684213.50916457025508158.52476067937
Trimmed Mean ( 18 / 24 )556.4444444444443.40784446242350163.283404093133
Trimmed Mean ( 19 / 24 )556.5882352941183.29346504867485168.997765899494
Trimmed Mean ( 20 / 24 )556.781253.13819291763691177.420975896938
Trimmed Mean ( 21 / 24 )5573.01070885608223185.006264845154
Trimmed Mean ( 22 / 24 )557.3214285714292.89364088932471192.60214030964
Trimmed Mean ( 23 / 24 )557.6538461538462.72647549760735204.532865467972
Trimmed Mean ( 24 / 24 )558.0833333333332.50862040342943222.466233859217
Median561
Midrange542
Midmean - Weighted Average at Xnp554.368421052632
Midmean - Weighted Average at X(n+1)p556.444444444444
Midmean - Empirical Distribution Function554.368421052632
Midmean - Empirical Distribution Function - Averaging556.444444444444
Midmean - Empirical Distribution Function - Interpolation556.444444444444
Midmean - Closest Observation554.368421052632
Midmean - True Basic - Statistics Graphics Toolkit556.444444444444
Midmean - MS Excel (old versions)555.282051282051
Number of observations72


Parameters (Session):
par1 = 0.01 ; par2 = 0.99 ; par3 = 0.005 ;
Parameters (R input):
R code (references can be found in the software module):
geomean <- function(x) {
return(exp(mean(log(x))))
}
harmean <- function(x) {
return(1/mean(1/x))
}
quamean <- function(x) {
return(sqrt(mean(x*x)))
}
winmean <- function(x) {
x <-sort(x[!is.na(x)])
n<-length(x)
denom <- 3
nodenom <- n/denom
if (nodenom>40) denom <- n/40
sqrtn = sqrt(n)
roundnodenom = floor(nodenom)
win <- array(NA,dim=c(roundnodenom,2))
for (j in 1:roundnodenom) {
win[j,1] <- (j*x[j+1]+sum(x[(j+1):(n-j)])+j*x[n-j])/n
win[j,2] <- sd(c(rep(x[j+1],j),x[(j+1):(n-j)],rep(x[n-j],j)))/sqrtn
}
return(win)
}
trimean <- function(x) {
x <-sort(x[!is.na(x)])
n<-length(x)
denom <- 3
nodenom <- n/denom
if (nodenom>40) denom <- n/40
sqrtn = sqrt(n)
roundnodenom = floor(nodenom)
tri <- array(NA,dim=c(roundnodenom,2))
for (j in 1:roundnodenom) {
tri[j,1] <- mean(x,trim=j/n)
tri[j,2] <- sd(x[(j+1):(n-j)]) / sqrt(n-j*2)
}
return(tri)
}
midrange <- function(x) {
return((max(x)+min(x))/2)
}
q1 <- function(data,n,p,i,f) {
np <- n*p;
i <<- floor(np)
f <<- np - i
qvalue <- (1-f)*data[i] + f*data[i+1]
}
q2 <- function(data,n,p,i,f) {
np <- (n+1)*p
i <<- floor(np)
f <<- np - i
qvalue <- (1-f)*data[i] + f*data[i+1]
}
q3 <- function(data,n,p,i,f) {
np <- n*p
i <<- floor(np)
f <<- np - i
if (f==0) {
qvalue <- data[i]
} else {
qvalue <- data[i+1]
}
}
q4 <- function(data,n,p,i,f) {
np <- n*p
i <<- floor(np)
f <<- np - i
if (f==0) {
qvalue <- (data[i]+data[i+1])/2
} else {
qvalue <- data[i+1]
}
}
q5 <- function(data,n,p,i,f) {
np <- (n-1)*p
i <<- floor(np)
f <<- np - i
if (f==0) {
qvalue <- data[i+1]
} else {
qvalue <- data[i+1] + f*(data[i+2]-data[i+1])
}
}
q6 <- function(data,n,p,i,f) {
np <- n*p+0.5
i <<- floor(np)
f <<- np - i
qvalue <- data[i]
}
q7 <- function(data,n,p,i,f) {
np <- (n+1)*p
i <<- floor(np)
f <<- np - i
if (f==0) {
qvalue <- data[i]
} else {
qvalue <- f*data[i] + (1-f)*data[i+1]
}
}
q8 <- function(data,n,p,i,f) {
np <- (n+1)*p
i <<- floor(np)
f <<- np - i
if (f==0) {
qvalue <- data[i]
} else {
if (f == 0.5) {
qvalue <- (data[i]+data[i+1])/2
} else {
if (f < 0.5) {
qvalue <- data[i]
} else {
qvalue <- data[i+1]
}
}
}
}
midmean <- function(x,def) {
x <-sort(x[!is.na(x)])
n<-length(x)
if (def==1) {
qvalue1 <- q1(x,n,0.25,i,f)
qvalue3 <- q1(x,n,0.75,i,f)
}
if (def==2) {
qvalue1 <- q2(x,n,0.25,i,f)
qvalue3 <- q2(x,n,0.75,i,f)
}
if (def==3) {
qvalue1 <- q3(x,n,0.25,i,f)
qvalue3 <- q3(x,n,0.75,i,f)
}
if (def==4) {
qvalue1 <- q4(x,n,0.25,i,f)
qvalue3 <- q4(x,n,0.75,i,f)
}
if (def==5) {
qvalue1 <- q5(x,n,0.25,i,f)
qvalue3 <- q5(x,n,0.75,i,f)
}
if (def==6) {
qvalue1 <- q6(x,n,0.25,i,f)
qvalue3 <- q6(x,n,0.75,i,f)
}
if (def==7) {
qvalue1 <- q7(x,n,0.25,i,f)
qvalue3 <- q7(x,n,0.75,i,f)
}
if (def==8) {
qvalue1 <- q8(x,n,0.25,i,f)
qvalue3 <- q8(x,n,0.75,i,f)
}
midm <- 0
myn <- 0
roundno4 <- round(n/4)
round3no4 <- round(3*n/4)
for (i in 1:n) {
if ((x[i]>=qvalue1) & (x[i]<=qvalue3)){
midm = midm + x[i]
myn = myn + 1
}
}
midm = midm / myn
return(midm)
}
(arm <- mean(x))
sqrtn <- sqrt(length(x))
(armse <- sd(x) / sqrtn)
(armose <- arm / armse)
(geo <- geomean(x))
(har <- harmean(x))
(qua <- quamean(x))
(win <- winmean(x))
(tri <- trimean(x))
(midr <- midrange(x))
midm <- array(NA,dim=8)
for (j in 1:8) midm[j] <- midmean(x,j)
midm
bitmap(file='test1.png')
lb <- win[,1] - 2*win[,2]
ub <- win[,1] + 2*win[,2]
if ((ylimmin == '') | (ylimmax == '')) plot(win[,1],type='b',main=main, xlab='j', pch=19, ylab='Winsorized Mean(j/n)', ylim=c(min(lb),max(ub))) else plot(win[,1],type='l',main=main, xlab='j', pch=19, ylab='Winsorized Mean(j/n)', ylim=c(ylimmin,ylimmax))
lines(ub,lty=3)
lines(lb,lty=3)
grid()
dev.off()
bitmap(file='test2.png')
lb <- tri[,1] - 2*tri[,2]
ub <- tri[,1] + 2*tri[,2]
if ((ylimmin == '') | (ylimmax == '')) plot(tri[,1],type='b',main=main, xlab='j', pch=19, ylab='Trimmed Mean(j/n)', ylim=c(min(lb),max(ub))) else plot(tri[,1],type='l',main=main, xlab='j', pch=19, ylab='Trimmed Mean(j/n)', ylim=c(ylimmin,ylimmax))
lines(ub,lty=3)
lines(lb,lty=3)
grid()
dev.off()
load(file='createtable')
a<-table.start()
a<-table.row.start(a)
a<-table.element(a,'Central Tendency - Ungrouped Data',4,TRUE)
a<-table.row.end(a)
a<-table.row.start(a)
a<-table.element(a,'Measure',header=TRUE)
a<-table.element(a,'Value',header=TRUE)
a<-table.element(a,'S.E.',header=TRUE)
a<-table.element(a,'Value/S.E.',header=TRUE)
a<-table.row.end(a)
a<-table.row.start(a)
a<-table.element(a,hyperlink('arithmetic_mean.htm', 'Arithmetic Mean', 'click to view the definition of the Arithmetic Mean'),header=TRUE)
a<-table.element(a,arm)
a<-table.element(a,hyperlink('arithmetic_mean_standard_error.htm', armse, 'click to view the definition of the Standard Error of the Arithmetic Mean'))
a<-table.element(a,armose)
a<-table.row.end(a)
a<-table.row.start(a)
a<-table.element(a,hyperlink('geometric_mean.htm', 'Geometric Mean', 'click to view the definition of the Geometric Mean'),header=TRUE)
a<-table.element(a,geo)
a<-table.element(a,'')
a<-table.row.end(a)
a<-table.row.start(a)
a<-table.element(a,hyperlink('harmonic_mean.htm', 'Harmonic Mean', 'click to view the definition of the Harmonic Mean'),header=TRUE)
a<-table.element(a,har)
a<-table.element(a,'')
a<-table.row.end(a)
a<-table.row.start(a)
a<-table.element(a,hyperlink('quadratic_mean.htm', 'Quadratic Mean', 'click to view the definition of the Quadratic Mean'),header=TRUE)
a<-table.element(a,qua)
a<-table.element(a,'')
a<-table.row.end(a)
for (j in 1:length(win[,1])) {
a<-table.row.start(a)
mylabel <- paste('Winsorized Mean (',j)
mylabel <- paste(mylabel,'/')
mylabel <- paste(mylabel,length(win[,1]))
mylabel <- paste(mylabel,')')
a<-table.element(a,hyperlink('winsorized_mean.htm', mylabel, 'click to view the definition of the Winsorized Mean'),header=TRUE)
a<-table.element(a,win[j,1])
a<-table.element(a,win[j,2])
a<-table.element(a,win[j,1]/win[j,2])
a<-table.row.end(a)
}
for (j in 1:length(tri[,1])) {
a<-table.row.start(a)
mylabel <- paste('Trimmed Mean (',j)
mylabel <- paste(mylabel,'/')
mylabel <- paste(mylabel,length(tri[,1]))
mylabel <- paste(mylabel,')')
a<-table.element(a,hyperlink('arithmetic_mean.htm', mylabel, 'click to view the definition of the Trimmed Mean'),header=TRUE)
a<-table.element(a,tri[j,1])
a<-table.element(a,tri[j,2])
a<-table.element(a,tri[j,1]/tri[j,2])
a<-table.row.end(a)
}
a<-table.row.start(a)
a<-table.element(a,hyperlink('median_1.htm', 'Median', 'click to view the definition of the Median'),header=TRUE)
a<-table.element(a,median(x))
a<-table.element(a,'')
a<-table.row.end(a)
a<-table.row.start(a)
a<-table.element(a,hyperlink('midrange.htm', 'Midrange', 'click to view the definition of the Midrange'),header=TRUE)
a<-table.element(a,midr)
a<-table.element(a,'')
a<-table.row.end(a)
a<-table.row.start(a)
mymid <- hyperlink('midmean.htm', 'Midmean', 'click to view the definition of the Midmean')
mylabel <- paste(mymid,hyperlink('method_1.htm','Weighted Average at Xnp',''),sep=' - ')
a<-table.element(a,mylabel,header=TRUE)
a<-table.element(a,midm[1])
a<-table.element(a,'')
a<-table.row.end(a)
a<-table.row.start(a)
mymid <- hyperlink('midmean.htm', 'Midmean', 'click to view the definition of the Midmean')
mylabel <- paste(mymid,hyperlink('method_2.htm','Weighted Average at X(n+1)p',''),sep=' - ')
a<-table.element(a,mylabel,header=TRUE)
a<-table.element(a,midm[2])
a<-table.element(a,'')
a<-table.row.end(a)
a<-table.row.start(a)
mymid <- hyperlink('midmean.htm', 'Midmean', 'click to view the definition of the Midmean')
mylabel <- paste(mymid,hyperlink('method_3.htm','Empirical Distribution Function',''),sep=' - ')
a<-table.element(a,mylabel,header=TRUE)
a<-table.element(a,midm[3])
a<-table.element(a,'')
a<-table.row.end(a)
a<-table.row.start(a)
mymid <- hyperlink('midmean.htm', 'Midmean', 'click to view the definition of the Midmean')
mylabel <- paste(mymid,hyperlink('method_4.htm','Empirical Distribution Function - Averaging',''),sep=' - ')
a<-table.element(a,mylabel,header=TRUE)
a<-table.element(a,midm[4])
a<-table.element(a,'')
a<-table.row.end(a)
a<-table.row.start(a)
mymid <- hyperlink('midmean.htm', 'Midmean', 'click to view the definition of the Midmean')
mylabel <- paste(mymid,hyperlink('method_5.htm','Empirical Distribution Function - Interpolation',''),sep=' - ')
a<-table.element(a,mylabel,header=TRUE)
a<-table.element(a,midm[5])
a<-table.element(a,'')
a<-table.row.end(a)
a<-table.row.start(a)
mymid <- hyperlink('midmean.htm', 'Midmean', 'click to view the definition of the Midmean')
mylabel <- paste(mymid,hyperlink('method_6.htm','Closest Observation',''),sep=' - ')
a<-table.element(a,mylabel,header=TRUE)
a<-table.element(a,midm[6])
a<-table.element(a,'')
a<-table.row.end(a)
a<-table.row.start(a)
mymid <- hyperlink('midmean.htm', 'Midmean', 'click to view the definition of the Midmean')
mylabel <- paste(mymid,hyperlink('method_7.htm','True Basic - Statistics Graphics Toolkit',''),sep=' - ')
a<-table.element(a,mylabel,header=TRUE)
a<-table.element(a,midm[7])
a<-table.element(a,'')
a<-table.row.end(a)
a<-table.row.start(a)
mymid <- hyperlink('midmean.htm', 'Midmean', 'click to view the definition of the Midmean')
mylabel <- paste(mymid,hyperlink('method_8.htm','MS Excel (old versions)',''),sep=' - ')
a<-table.element(a,mylabel,header=TRUE)
a<-table.element(a,midm[8])
a<-table.element(a,'')
a<-table.row.end(a)
a<-table.row.start(a)
a<-table.element(a,'Number of observations',header=TRUE)
a<-table.element(a,length(x))
a<-table.element(a,'')
a<-table.row.end(a)
a<-table.end(a)
table.save(a,file='mytable.tab')