Free Statistics

of Irreproducible Research!

Author's title

Author*The author of this computation has been verified*
R Software Modulerwasp_notchedbox1.wasp
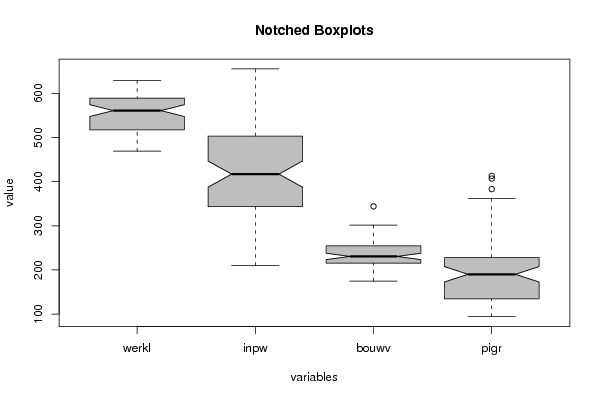
Title produced by softwareNotched Boxplots
Date of computationFri, 13 Nov 2009 07:05:10 -0700
Cite this page as followsStatistical Computations at FreeStatistics.org, Office for Research Development and Education, URL https://freestatistics.org/blog/index.php?v=date/2009/Nov/13/t1258121621q7xcmh87n84213r.htm/, Retrieved Sun, 05 May 2024 08:50:42 +0000
Statistical Computations at FreeStatistics.org, Office for Research Development and Education, URL https://freestatistics.org/blog/index.php?pk=56660, Retrieved Sun, 05 May 2024 08:50:42 +0000
QR Codes:

Original text written by user:
IsPrivate?No (this computation is public)
User-defined keywords
Estimated Impact135
Family? (F = Feedback message, R = changed R code, M = changed R Module, P = changed Parameters, D = changed Data)
-     [Notched Boxplots] [3/11/2009] [2009-11-02 21:10:41] [b98453cac15ba1066b407e146608df68]
-    D    [Notched Boxplots] [notched boxplots] [2009-11-13 14:05:10] [479db4778e5b462dda1f74ecdd6ccff3] [Current]
Feedback Forum

Post a new message
Dataseries X:
519	505.56	195.4	104
517	439.01	182.8	110
510	485.72	225.1	104
509	438.99	227.7	94
501	375.32	208.5	95
507	403.57	228.2	99
569	354.89	226.6	101
580	290.27	187.8	104
578	344.85	226.7	99
565	425.98	206.9	105
547	303.06	174.6	107
555	264.51	229.9	110
562	474.60	236.0	117
561	501.04	221.4	118
555	614.65	282.5	126
544	537.26	235.5	127
537	394.77	233.3	134
543	438.95	301.6	131
594	314.81	215.5	135
611	298.96	217.2	142
613	338.42	215.0	141
611	391.20	253.3	153
594	337.02	205.8	145
595	250.94	216.0	137
591	514.42	226.0	148
589	455.94	249.8	152
584	525.18	269.5	169
573	485.64	279.9	168
567	417.45	294.6	161
569	495.85	293.0	174
621	327.47	231.8	179
629	333.79	254.0	190
628	356.45	257.0	190
612	370.34	266.9	181
595	356.81	245.0	174
597	209.72	284.2	180
593	585.52	344.0	196
590	549.55	267.8	193
580	655.40	298.1	197
574	515.70	226.0	216
573	511.45	284.4	221
573	466.41	254.6	217
620	357.04	245.6	229
626	332.53	229.5	227
620	351.93	237.9	204
588	416.68	247.9	196
566	348.65	205.7	198
557	212.10	228.0	207
561	561.26	235.1	190
549	492.31	227.6	201
532	597.23	254.8	210
526	481.03	231.1	223
511	474.72	220.1	223
499	504.97	272.5	231
555	400.59	240.8	244
565	341.49	213.9	234
542	368.60	189.8	250
527	463.56	253.7	265
510	365.77	206.8	287
514	238.72	206.3	283
517	572.76	252.0	295
508	563.89	243.4	312
493	576.57	219.0	333
490	623.00	279.4	347
469	489.29	207.0	383
478	511.68	261.5	407
528	396.36	226.5	413
534	332.13	213.9	362
518	381.27	242.8	321
506	432.91	213.7	239
502	306.00	182.3	191
516	219.56	206.3	159


Summary of computational transaction
Raw Inputview raw input (R code)
Raw Outputview raw output of R engine
Computing time0 seconds
R Server'Gwilym Jenkins' @ 72.249.127.135

\begin{tabular}{lllllllll}
\hline
Summary of computational transaction \tabularnewline
Raw Input & view raw input (R code)  \tabularnewline
Raw Output & view raw output of R engine  \tabularnewline
Computing time & 0 seconds \tabularnewline
R Server & 'Gwilym Jenkins' @ 72.249.127.135 \tabularnewline
\hline
\end{tabular}
%Source: https://freestatistics.org/blog/index.php?pk=56660&T=0

[TABLE]
[ROW][C]Summary of computational transaction[/C][/ROW]
[ROW][C]Raw Input[/C][C]view raw input (R code) [/C][/ROW]
[ROW][C]Raw Output[/C][C]view raw output of R engine [/C][/ROW]
[ROW][C]Computing time[/C][C]0 seconds[/C][/ROW]
[ROW][C]R Server[/C][C]'Gwilym Jenkins' @ 72.249.127.135[/C][/ROW]
[/TABLE]
Source: https://freestatistics.org/blog/index.php?pk=56660&T=0

Globally Unique Identifier (entire table): ba.freestatistics.org/blog/index.php?pk=56660&T=0

As an alternative you can also use a QR Code:  

The GUIDs for individual cells are displayed in the table below:

Summary of computational transaction
Raw Inputview raw input (R code)
Raw Outputview raw output of R engine
Computing time0 seconds
R Server'Gwilym Jenkins' @ 72.249.127.135


Boxplot statistics
Variablelower whiskerlower hingemedianupper hingeupper whisker
werkl469517.5561589.5629
inpw209.72343.17417.065503.005655.4
bouwv174.6215.25230.5254.3301.6
pigr94134.5190228362

\begin{tabular}{lllllllll}
\hline
Boxplot statistics \tabularnewline
Variable & lower whisker & lower hinge & median & upper hinge & upper whisker \tabularnewline
werkl & 469 & 517.5 & 561 & 589.5 & 629 \tabularnewline
inpw & 209.72 & 343.17 & 417.065 & 503.005 & 655.4 \tabularnewline
bouwv & 174.6 & 215.25 & 230.5 & 254.3 & 301.6 \tabularnewline
pigr & 94 & 134.5 & 190 & 228 & 362 \tabularnewline
\hline
\end{tabular}
%Source: https://freestatistics.org/blog/index.php?pk=56660&T=1

[TABLE]
[ROW][C]Boxplot statistics[/C][/ROW]
[ROW][C]Variable[/C][C]lower whisker[/C][C]lower hinge[/C][C]median[/C][C]upper hinge[/C][C]upper whisker[/C][/ROW]
[ROW][C]werkl[/C][C]469[/C][C]517.5[/C][C]561[/C][C]589.5[/C][C]629[/C][/ROW]
[ROW][C]inpw[/C][C]209.72[/C][C]343.17[/C][C]417.065[/C][C]503.005[/C][C]655.4[/C][/ROW]
[ROW][C]bouwv[/C][C]174.6[/C][C]215.25[/C][C]230.5[/C][C]254.3[/C][C]301.6[/C][/ROW]
[ROW][C]pigr[/C][C]94[/C][C]134.5[/C][C]190[/C][C]228[/C][C]362[/C][/ROW]
[/TABLE]
Source: https://freestatistics.org/blog/index.php?pk=56660&T=1

Globally Unique Identifier (entire table): ba.freestatistics.org/blog/index.php?pk=56660&T=1

As an alternative you can also use a QR Code:  

The GUIDs for individual cells are displayed in the table below:

Boxplot statistics
Variablelower whiskerlower hingemedianupper hingeupper whisker
werkl469517.5561589.5629
inpw209.72343.17417.065503.005655.4
bouwv174.6215.25230.5254.3301.6
pigr94134.5190228362


Boxplot Notches
Variablelower boundmedianupper bound
werkl547.593255428703561574.406744571297
inpw387.302958075649417.065446.827041924351
bouwv223.228703117929230.5237.771296882071
pigr172.589852535885190207.410147464115

\begin{tabular}{lllllllll}
\hline
Boxplot Notches \tabularnewline
Variable & lower bound & median & upper bound \tabularnewline
werkl & 547.593255428703 & 561 & 574.406744571297 \tabularnewline
inpw & 387.302958075649 & 417.065 & 446.827041924351 \tabularnewline
bouwv & 223.228703117929 & 230.5 & 237.771296882071 \tabularnewline
pigr & 172.589852535885 & 190 & 207.410147464115 \tabularnewline
\hline
\end{tabular}
%Source: https://freestatistics.org/blog/index.php?pk=56660&T=2

[TABLE]
[ROW][C]Boxplot Notches[/C][/ROW]
[ROW][C]Variable[/C][C]lower bound[/C][C]median[/C][C]upper bound[/C][/ROW]
[ROW][C]werkl[/C][C]547.593255428703[/C][C]561[/C][C]574.406744571297[/C][/ROW]
[ROW][C]inpw[/C][C]387.302958075649[/C][C]417.065[/C][C]446.827041924351[/C][/ROW]
[ROW][C]bouwv[/C][C]223.228703117929[/C][C]230.5[/C][C]237.771296882071[/C][/ROW]
[ROW][C]pigr[/C][C]172.589852535885[/C][C]190[/C][C]207.410147464115[/C][/ROW]
[/TABLE]
Source: https://freestatistics.org/blog/index.php?pk=56660&T=2

Globally Unique Identifier (entire table): ba.freestatistics.org/blog/index.php?pk=56660&T=2

As an alternative you can also use a QR Code:  

The GUIDs for individual cells are displayed in the table below:

Boxplot Notches
Variablelower boundmedianupper bound
werkl547.593255428703561574.406744571297
inpw387.302958075649417.065446.827041924351
bouwv223.228703117929230.5237.771296882071
pigr172.589852535885190207.410147464115


Parameters (Session):
par1 = grey ;
Parameters (R input):
par1 = grey ;
R code (references can be found in the software module):
z <- as.data.frame(t(y))
bitmap(file='test1.png')
(r<-boxplot(z ,xlab=xlab,ylab=ylab,main=main,notch=TRUE,col=par1))
dev.off()
load(file='createtable')
a<-table.start()
a<-table.row.start(a)
a<-table.element(a,hyperlink('overview.htm','Boxplot statistics','Boxplot overview'),6,TRUE)
a<-table.row.end(a)
a<-table.row.start(a)
a<-table.element(a,'Variable',1,TRUE)
a<-table.element(a,hyperlink('lower_whisker.htm','lower whisker','definition of lower whisker'),1,TRUE)
a<-table.element(a,hyperlink('lower_hinge.htm','lower hinge','definition of lower hinge'),1,TRUE)
a<-table.element(a,hyperlink('central_tendency.htm','median','definitions about measures of central tendency'),1,TRUE)
a<-table.element(a,hyperlink('upper_hinge.htm','upper hinge','definition of upper hinge'),1,TRUE)
a<-table.element(a,hyperlink('upper_whisker.htm','upper whisker','definition of upper whisker'),1,TRUE)
a<-table.row.end(a)
for (i in 1:length(y[,1]))
{
a<-table.row.start(a)
a<-table.element(a,dimnames(t(x))[[2]][i],1,TRUE)
for (j in 1:5)
{
a<-table.element(a,r$stats[j,i])
}
a<-table.row.end(a)
}
a<-table.end(a)
table.save(a,file='mytable.tab')
a<-table.start()
a<-table.row.start(a)
a<-table.element(a,'Boxplot Notches',4,TRUE)
a<-table.row.end(a)
a<-table.row.start(a)
a<-table.element(a,'Variable',1,TRUE)
a<-table.element(a,'lower bound',1,TRUE)
a<-table.element(a,'median',1,TRUE)
a<-table.element(a,'upper bound',1,TRUE)
a<-table.row.end(a)
for (i in 1:length(y[,1]))
{
a<-table.row.start(a)
a<-table.element(a,dimnames(t(x))[[2]][i],1,TRUE)
a<-table.element(a,r$conf[1,i])
a<-table.element(a,r$stats[3,i])
a<-table.element(a,r$conf[2,i])
a<-table.row.end(a)
}
a<-table.end(a)
table.save(a,file='mytable1.tab')