Free Statistics

of Irreproducible Research!

Author's title

Author*Unverified author*
R Software Modulerwasp_autocorrelation.wasp
Title produced by software(Partial) Autocorrelation Function
Date of computationThu, 14 May 2009 08:00:09 -0600
Cite this page as followsStatistical Computations at FreeStatistics.org, Office for Research Development and Education, URL https://freestatistics.org/blog/index.php?v=date/2009/May/14/t1242310028f6zyp0ywieg4z6g.htm/, Retrieved Sun, 28 Apr 2024 21:12:58 +0000
Statistical Computations at FreeStatistics.org, Office for Research Development and Education, URL https://freestatistics.org/blog/index.php?pk=40002, Retrieved Sun, 28 Apr 2024 21:12:58 +0000
QR Codes:

Original text written by user:
IsPrivate?No (this computation is public)
User-defined keywords
Estimated Impact109
Family? (F = Feedback message, R = changed R code, M = changed R Module, P = changed Parameters, D = changed Data)
-     [(Partial) Autocorrelation Function] [opgave 6bis- oefe...] [2008-12-08 20:23:30] [ca4e42c3236d1c0cb4de680f9dd82ba0]
-    D    [(Partial) Autocorrelation Function] [Kristof Nollekens...] [2009-05-14 14:00:09] [d41d8cd98f00b204e9800998ecf8427e] [Current]
Feedback Forum

Post a new message
Dataseries X:
4000
3600
1600
2500
3800
3500
4100
2000
3300
4000
4100
4200
1100
1900
4800
4000
3250
1200
3600
3400
3600
3300
1300
2500
3800
3800
3000
1600
2100
3900
4000
3900
2300
3600
3600
4200
4400
1900
2700
3600
4100
5250
1200
3000
4000
5200
2100
3400
5200
6900
2300
4100
4300
4500
4700
2200
2900
4400
5100
2300
3500
4100
4700
5400
2500
3500
3900
4100
4500
1800
4900
4500
3700
3100
1700
4000
4200
4300
3600
2600
4600
4000
2900
1800
3000
4200
4400
4900
2300
2400
3600
3900
2800
3800
4400
4200
5400
2300
3500
3800
4400
4400
2500
3700
3500
3300
3700
2200
3200
3100
4800
4400
2500
3100
4700
4300
4600
3100
3200
4300
4000
4500
2600
3600
4700
3800
4100
1700
3200
4000
3700
3600
2500
3800
4500
3500
4100
2300
3400
4800
4900
2600
3300
3900
3800
5000
1700
2700
4000
3300
4000
2500
3600
3800
5900
3600
3300
4000
4200
4300
2900
3900
5200
4000
4700
2200
2400
3700
3700
3000
2100
3500
6300
5200
7800
2700
3400
5000
5500
4500
2600
3900
3800
4400
4300
3300
3600
5300
3700
3800
4000
5200
5100
5100
5200
3800
6700
5200
4900
5700
2700
6300
5200
4500
6400
4000
3500
4700
4700
5000
2300
5200
5100
5400
4400
2600
4700
6100
6100
3500
4900
5500
5300
6300
2800
5900
5500
5200
6400
3100
5100
5400
5400
5100
2400
5500
5300
5000
4500
2000
3800
4900
5000
4000
1900
5200
5400
3200
800
3800
4300
2700


Summary of computational transaction
Raw Inputview raw input (R code)
Raw Outputview raw output of R engine
Computing time1 seconds
R Server'Gwilym Jenkins' @ 72.249.127.135

\begin{tabular}{lllllllll}
\hline
Summary of computational transaction \tabularnewline
Raw Input & view raw input (R code)  \tabularnewline
Raw Output & view raw output of R engine  \tabularnewline
Computing time & 1 seconds \tabularnewline
R Server & 'Gwilym Jenkins' @ 72.249.127.135 \tabularnewline
\hline
\end{tabular}
%Source: https://freestatistics.org/blog/index.php?pk=40002&T=0

[TABLE]
[ROW][C]Summary of computational transaction[/C][/ROW]
[ROW][C]Raw Input[/C][C]view raw input (R code) [/C][/ROW]
[ROW][C]Raw Output[/C][C]view raw output of R engine [/C][/ROW]
[ROW][C]Computing time[/C][C]1 seconds[/C][/ROW]
[ROW][C]R Server[/C][C]'Gwilym Jenkins' @ 72.249.127.135[/C][/ROW]
[/TABLE]
Source: https://freestatistics.org/blog/index.php?pk=40002&T=0

Globally Unique Identifier (entire table): ba.freestatistics.org/blog/index.php?pk=40002&T=0

As an alternative you can also use a QR Code:  

The GUIDs for individual cells are displayed in the table below:

Summary of computational transaction
Raw Inputview raw input (R code)
Raw Outputview raw output of R engine
Computing time1 seconds
R Server'Gwilym Jenkins' @ 72.249.127.135


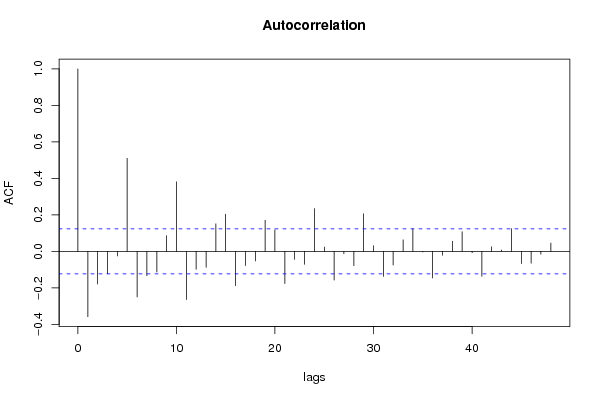
Autocorrelation Function
Time lag kACF(k)T-STATP-value
1-0.358209-5.67510
2-0.178677-2.83080.00251
3-0.12244-1.93980.026761
4-0.025636-0.40620.342488
50.5097758.07640
6-0.250266-3.9654.8e-05
7-0.133745-2.11890.01754
8-0.113498-1.79810.036678
90.085771.35890.087706
100.3811446.03850
11-0.264704-4.19371.9e-05
12-0.09876-1.56460.059463
13-0.087937-1.39320.082399
140.1507052.38760.008849
150.2038193.22910.000704
16-0.18823-2.98210.001572
17-0.077825-1.2330.109368
18-0.052884-0.83780.201458
190.1699482.69250.003785
200.1180621.87040.031293
21-0.176933-2.80320.002728
22-0.04409-0.69850.24275
23-0.07126-1.1290.129996
240.2345083.71530.000125
250.0231010.3660.357343
26-0.157865-2.50110.00651
27-0.012988-0.20580.418572
28-0.078803-1.24850.106511
290.2053943.25410.000647
300.0309560.49040.312128
31-0.137708-2.18170.01503
32-0.075593-1.19760.116096
330.0631210.159136
340.1236141.95840.025644
35-0.003095-0.0490.480466
36-0.145867-2.3110.010823
37-0.020859-0.33050.370658
380.0556360.88140.18946
390.1079941.7110.044163
40-0.007788-0.12340.450947
41-0.136956-2.16980.015481
420.0250570.3970.34586
430.007040.11150.455643
440.1239691.9640.025314
45-0.067313-1.06640.143625
46-0.065178-1.03260.151389
47-0.015958-0.25280.400308
480.0455070.7210.2358

\begin{tabular}{lllllllll}
\hline
Autocorrelation Function \tabularnewline
Time lag k & ACF(k) & T-STAT & P-value \tabularnewline
1 & -0.358209 & -5.6751 & 0 \tabularnewline
2 & -0.178677 & -2.8308 & 0.00251 \tabularnewline
3 & -0.12244 & -1.9398 & 0.026761 \tabularnewline
4 & -0.025636 & -0.4062 & 0.342488 \tabularnewline
5 & 0.509775 & 8.0764 & 0 \tabularnewline
6 & -0.250266 & -3.965 & 4.8e-05 \tabularnewline
7 & -0.133745 & -2.1189 & 0.01754 \tabularnewline
8 & -0.113498 & -1.7981 & 0.036678 \tabularnewline
9 & 0.08577 & 1.3589 & 0.087706 \tabularnewline
10 & 0.381144 & 6.0385 & 0 \tabularnewline
11 & -0.264704 & -4.1937 & 1.9e-05 \tabularnewline
12 & -0.09876 & -1.5646 & 0.059463 \tabularnewline
13 & -0.087937 & -1.3932 & 0.082399 \tabularnewline
14 & 0.150705 & 2.3876 & 0.008849 \tabularnewline
15 & 0.203819 & 3.2291 & 0.000704 \tabularnewline
16 & -0.18823 & -2.9821 & 0.001572 \tabularnewline
17 & -0.077825 & -1.233 & 0.109368 \tabularnewline
18 & -0.052884 & -0.8378 & 0.201458 \tabularnewline
19 & 0.169948 & 2.6925 & 0.003785 \tabularnewline
20 & 0.118062 & 1.8704 & 0.031293 \tabularnewline
21 & -0.176933 & -2.8032 & 0.002728 \tabularnewline
22 & -0.04409 & -0.6985 & 0.24275 \tabularnewline
23 & -0.07126 & -1.129 & 0.129996 \tabularnewline
24 & 0.234508 & 3.7153 & 0.000125 \tabularnewline
25 & 0.023101 & 0.366 & 0.357343 \tabularnewline
26 & -0.157865 & -2.5011 & 0.00651 \tabularnewline
27 & -0.012988 & -0.2058 & 0.418572 \tabularnewline
28 & -0.078803 & -1.2485 & 0.106511 \tabularnewline
29 & 0.205394 & 3.2541 & 0.000647 \tabularnewline
30 & 0.030956 & 0.4904 & 0.312128 \tabularnewline
31 & -0.137708 & -2.1817 & 0.01503 \tabularnewline
32 & -0.075593 & -1.1976 & 0.116096 \tabularnewline
33 & 0.06312 & 1 & 0.159136 \tabularnewline
34 & 0.123614 & 1.9584 & 0.025644 \tabularnewline
35 & -0.003095 & -0.049 & 0.480466 \tabularnewline
36 & -0.145867 & -2.311 & 0.010823 \tabularnewline
37 & -0.020859 & -0.3305 & 0.370658 \tabularnewline
38 & 0.055636 & 0.8814 & 0.18946 \tabularnewline
39 & 0.107994 & 1.711 & 0.044163 \tabularnewline
40 & -0.007788 & -0.1234 & 0.450947 \tabularnewline
41 & -0.136956 & -2.1698 & 0.015481 \tabularnewline
42 & 0.025057 & 0.397 & 0.34586 \tabularnewline
43 & 0.00704 & 0.1115 & 0.455643 \tabularnewline
44 & 0.123969 & 1.964 & 0.025314 \tabularnewline
45 & -0.067313 & -1.0664 & 0.143625 \tabularnewline
46 & -0.065178 & -1.0326 & 0.151389 \tabularnewline
47 & -0.015958 & -0.2528 & 0.400308 \tabularnewline
48 & 0.045507 & 0.721 & 0.2358 \tabularnewline
\hline
\end{tabular}
%Source: https://freestatistics.org/blog/index.php?pk=40002&T=1

[TABLE]
[ROW][C]Autocorrelation Function[/C][/ROW]
[ROW][C]Time lag k[/C][C]ACF(k)[/C][C]T-STAT[/C][C]P-value[/C][/ROW]
[ROW][C]1[/C][C]-0.358209[/C][C]-5.6751[/C][C]0[/C][/ROW]
[ROW][C]2[/C][C]-0.178677[/C][C]-2.8308[/C][C]0.00251[/C][/ROW]
[ROW][C]3[/C][C]-0.12244[/C][C]-1.9398[/C][C]0.026761[/C][/ROW]
[ROW][C]4[/C][C]-0.025636[/C][C]-0.4062[/C][C]0.342488[/C][/ROW]
[ROW][C]5[/C][C]0.509775[/C][C]8.0764[/C][C]0[/C][/ROW]
[ROW][C]6[/C][C]-0.250266[/C][C]-3.965[/C][C]4.8e-05[/C][/ROW]
[ROW][C]7[/C][C]-0.133745[/C][C]-2.1189[/C][C]0.01754[/C][/ROW]
[ROW][C]8[/C][C]-0.113498[/C][C]-1.7981[/C][C]0.036678[/C][/ROW]
[ROW][C]9[/C][C]0.08577[/C][C]1.3589[/C][C]0.087706[/C][/ROW]
[ROW][C]10[/C][C]0.381144[/C][C]6.0385[/C][C]0[/C][/ROW]
[ROW][C]11[/C][C]-0.264704[/C][C]-4.1937[/C][C]1.9e-05[/C][/ROW]
[ROW][C]12[/C][C]-0.09876[/C][C]-1.5646[/C][C]0.059463[/C][/ROW]
[ROW][C]13[/C][C]-0.087937[/C][C]-1.3932[/C][C]0.082399[/C][/ROW]
[ROW][C]14[/C][C]0.150705[/C][C]2.3876[/C][C]0.008849[/C][/ROW]
[ROW][C]15[/C][C]0.203819[/C][C]3.2291[/C][C]0.000704[/C][/ROW]
[ROW][C]16[/C][C]-0.18823[/C][C]-2.9821[/C][C]0.001572[/C][/ROW]
[ROW][C]17[/C][C]-0.077825[/C][C]-1.233[/C][C]0.109368[/C][/ROW]
[ROW][C]18[/C][C]-0.052884[/C][C]-0.8378[/C][C]0.201458[/C][/ROW]
[ROW][C]19[/C][C]0.169948[/C][C]2.6925[/C][C]0.003785[/C][/ROW]
[ROW][C]20[/C][C]0.118062[/C][C]1.8704[/C][C]0.031293[/C][/ROW]
[ROW][C]21[/C][C]-0.176933[/C][C]-2.8032[/C][C]0.002728[/C][/ROW]
[ROW][C]22[/C][C]-0.04409[/C][C]-0.6985[/C][C]0.24275[/C][/ROW]
[ROW][C]23[/C][C]-0.07126[/C][C]-1.129[/C][C]0.129996[/C][/ROW]
[ROW][C]24[/C][C]0.234508[/C][C]3.7153[/C][C]0.000125[/C][/ROW]
[ROW][C]25[/C][C]0.023101[/C][C]0.366[/C][C]0.357343[/C][/ROW]
[ROW][C]26[/C][C]-0.157865[/C][C]-2.5011[/C][C]0.00651[/C][/ROW]
[ROW][C]27[/C][C]-0.012988[/C][C]-0.2058[/C][C]0.418572[/C][/ROW]
[ROW][C]28[/C][C]-0.078803[/C][C]-1.2485[/C][C]0.106511[/C][/ROW]
[ROW][C]29[/C][C]0.205394[/C][C]3.2541[/C][C]0.000647[/C][/ROW]
[ROW][C]30[/C][C]0.030956[/C][C]0.4904[/C][C]0.312128[/C][/ROW]
[ROW][C]31[/C][C]-0.137708[/C][C]-2.1817[/C][C]0.01503[/C][/ROW]
[ROW][C]32[/C][C]-0.075593[/C][C]-1.1976[/C][C]0.116096[/C][/ROW]
[ROW][C]33[/C][C]0.06312[/C][C]1[/C][C]0.159136[/C][/ROW]
[ROW][C]34[/C][C]0.123614[/C][C]1.9584[/C][C]0.025644[/C][/ROW]
[ROW][C]35[/C][C]-0.003095[/C][C]-0.049[/C][C]0.480466[/C][/ROW]
[ROW][C]36[/C][C]-0.145867[/C][C]-2.311[/C][C]0.010823[/C][/ROW]
[ROW][C]37[/C][C]-0.020859[/C][C]-0.3305[/C][C]0.370658[/C][/ROW]
[ROW][C]38[/C][C]0.055636[/C][C]0.8814[/C][C]0.18946[/C][/ROW]
[ROW][C]39[/C][C]0.107994[/C][C]1.711[/C][C]0.044163[/C][/ROW]
[ROW][C]40[/C][C]-0.007788[/C][C]-0.1234[/C][C]0.450947[/C][/ROW]
[ROW][C]41[/C][C]-0.136956[/C][C]-2.1698[/C][C]0.015481[/C][/ROW]
[ROW][C]42[/C][C]0.025057[/C][C]0.397[/C][C]0.34586[/C][/ROW]
[ROW][C]43[/C][C]0.00704[/C][C]0.1115[/C][C]0.455643[/C][/ROW]
[ROW][C]44[/C][C]0.123969[/C][C]1.964[/C][C]0.025314[/C][/ROW]
[ROW][C]45[/C][C]-0.067313[/C][C]-1.0664[/C][C]0.143625[/C][/ROW]
[ROW][C]46[/C][C]-0.065178[/C][C]-1.0326[/C][C]0.151389[/C][/ROW]
[ROW][C]47[/C][C]-0.015958[/C][C]-0.2528[/C][C]0.400308[/C][/ROW]
[ROW][C]48[/C][C]0.045507[/C][C]0.721[/C][C]0.2358[/C][/ROW]
[/TABLE]
Source: https://freestatistics.org/blog/index.php?pk=40002&T=1

Globally Unique Identifier (entire table): ba.freestatistics.org/blog/index.php?pk=40002&T=1

As an alternative you can also use a QR Code:  

The GUIDs for individual cells are displayed in the table below:

Autocorrelation Function
Time lag kACF(k)T-STATP-value
1-0.358209-5.67510
2-0.178677-2.83080.00251
3-0.12244-1.93980.026761
4-0.025636-0.40620.342488
50.5097758.07640
6-0.250266-3.9654.8e-05
7-0.133745-2.11890.01754
8-0.113498-1.79810.036678
90.085771.35890.087706
100.3811446.03850
11-0.264704-4.19371.9e-05
12-0.09876-1.56460.059463
13-0.087937-1.39320.082399
140.1507052.38760.008849
150.2038193.22910.000704
16-0.18823-2.98210.001572
17-0.077825-1.2330.109368
18-0.052884-0.83780.201458
190.1699482.69250.003785
200.1180621.87040.031293
21-0.176933-2.80320.002728
22-0.04409-0.69850.24275
23-0.07126-1.1290.129996
240.2345083.71530.000125
250.0231010.3660.357343
26-0.157865-2.50110.00651
27-0.012988-0.20580.418572
28-0.078803-1.24850.106511
290.2053943.25410.000647
300.0309560.49040.312128
31-0.137708-2.18170.01503
32-0.075593-1.19760.116096
330.0631210.159136
340.1236141.95840.025644
35-0.003095-0.0490.480466
36-0.145867-2.3110.010823
37-0.020859-0.33050.370658
380.0556360.88140.18946
390.1079941.7110.044163
40-0.007788-0.12340.450947
41-0.136956-2.16980.015481
420.0250570.3970.34586
430.007040.11150.455643
440.1239691.9640.025314
45-0.067313-1.06640.143625
46-0.065178-1.03260.151389
47-0.015958-0.25280.400308
480.0455070.7210.2358


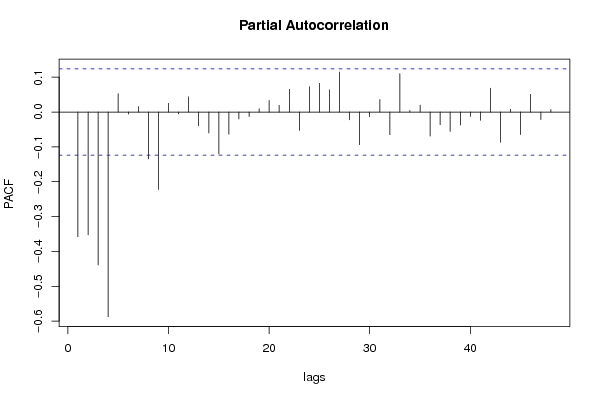
Partial Autocorrelation Function
Time lag kPACF(k)T-STATP-value
1-0.358209-5.67510
2-0.35218-5.57960
3-0.43891-6.95360
4-0.587212-9.30320
50.052550.83250.202947
6-0.005883-0.09320.46291
70.0155880.2470.402573
8-0.134527-2.13130.017018
9-0.222152-3.51950.000257
100.0249710.39560.346361
11-0.004955-0.07850.468745
120.0435880.69060.245239
13-0.039419-0.62450.266428
14-0.05993-0.94950.171649
15-0.120269-1.90540.028935
16-0.063689-1.0090.156966
17-0.019884-0.3150.376503
18-0.013097-0.20750.417898
190.0094820.15020.440354
200.0332370.52660.299476
210.0193380.30640.379791
220.0652171.03320.151245
23-0.052569-0.83280.202862
240.0726321.15070.125474
250.0825481.30780.096067
260.0637371.00980.156786
270.1146721.81670.035225
28-0.022309-0.35340.362029
29-0.093808-1.48620.069241
30-0.01324-0.20980.417013
310.0357070.56570.286052
32-0.065052-1.03060.151857
330.1100531.74360.04123
340.0041660.0660.473714
350.0197090.31220.377557
36-0.068747-1.08920.138563
37-0.036264-0.57450.283064
38-0.055603-0.88090.189605
39-0.037278-0.59060.277659
40-0.012682-0.20090.420461
41-0.02375-0.37630.353515
420.0683961.08360.139791
43-0.086807-1.37530.085136
440.0078850.12490.450345
45-0.064711-1.02520.153124
460.0509460.80710.210176
47-0.021422-0.33940.367303
480.0074230.11760.453241

\begin{tabular}{lllllllll}
\hline
Partial Autocorrelation Function \tabularnewline
Time lag k & PACF(k) & T-STAT & P-value \tabularnewline
1 & -0.358209 & -5.6751 & 0 \tabularnewline
2 & -0.35218 & -5.5796 & 0 \tabularnewline
3 & -0.43891 & -6.9536 & 0 \tabularnewline
4 & -0.587212 & -9.3032 & 0 \tabularnewline
5 & 0.05255 & 0.8325 & 0.202947 \tabularnewline
6 & -0.005883 & -0.0932 & 0.46291 \tabularnewline
7 & 0.015588 & 0.247 & 0.402573 \tabularnewline
8 & -0.134527 & -2.1313 & 0.017018 \tabularnewline
9 & -0.222152 & -3.5195 & 0.000257 \tabularnewline
10 & 0.024971 & 0.3956 & 0.346361 \tabularnewline
11 & -0.004955 & -0.0785 & 0.468745 \tabularnewline
12 & 0.043588 & 0.6906 & 0.245239 \tabularnewline
13 & -0.039419 & -0.6245 & 0.266428 \tabularnewline
14 & -0.05993 & -0.9495 & 0.171649 \tabularnewline
15 & -0.120269 & -1.9054 & 0.028935 \tabularnewline
16 & -0.063689 & -1.009 & 0.156966 \tabularnewline
17 & -0.019884 & -0.315 & 0.376503 \tabularnewline
18 & -0.013097 & -0.2075 & 0.417898 \tabularnewline
19 & 0.009482 & 0.1502 & 0.440354 \tabularnewline
20 & 0.033237 & 0.5266 & 0.299476 \tabularnewline
21 & 0.019338 & 0.3064 & 0.379791 \tabularnewline
22 & 0.065217 & 1.0332 & 0.151245 \tabularnewline
23 & -0.052569 & -0.8328 & 0.202862 \tabularnewline
24 & 0.072632 & 1.1507 & 0.125474 \tabularnewline
25 & 0.082548 & 1.3078 & 0.096067 \tabularnewline
26 & 0.063737 & 1.0098 & 0.156786 \tabularnewline
27 & 0.114672 & 1.8167 & 0.035225 \tabularnewline
28 & -0.022309 & -0.3534 & 0.362029 \tabularnewline
29 & -0.093808 & -1.4862 & 0.069241 \tabularnewline
30 & -0.01324 & -0.2098 & 0.417013 \tabularnewline
31 & 0.035707 & 0.5657 & 0.286052 \tabularnewline
32 & -0.065052 & -1.0306 & 0.151857 \tabularnewline
33 & 0.110053 & 1.7436 & 0.04123 \tabularnewline
34 & 0.004166 & 0.066 & 0.473714 \tabularnewline
35 & 0.019709 & 0.3122 & 0.377557 \tabularnewline
36 & -0.068747 & -1.0892 & 0.138563 \tabularnewline
37 & -0.036264 & -0.5745 & 0.283064 \tabularnewline
38 & -0.055603 & -0.8809 & 0.189605 \tabularnewline
39 & -0.037278 & -0.5906 & 0.277659 \tabularnewline
40 & -0.012682 & -0.2009 & 0.420461 \tabularnewline
41 & -0.02375 & -0.3763 & 0.353515 \tabularnewline
42 & 0.068396 & 1.0836 & 0.139791 \tabularnewline
43 & -0.086807 & -1.3753 & 0.085136 \tabularnewline
44 & 0.007885 & 0.1249 & 0.450345 \tabularnewline
45 & -0.064711 & -1.0252 & 0.153124 \tabularnewline
46 & 0.050946 & 0.8071 & 0.210176 \tabularnewline
47 & -0.021422 & -0.3394 & 0.367303 \tabularnewline
48 & 0.007423 & 0.1176 & 0.453241 \tabularnewline
\hline
\end{tabular}
%Source: https://freestatistics.org/blog/index.php?pk=40002&T=2

[TABLE]
[ROW][C]Partial Autocorrelation Function[/C][/ROW]
[ROW][C]Time lag k[/C][C]PACF(k)[/C][C]T-STAT[/C][C]P-value[/C][/ROW]
[ROW][C]1[/C][C]-0.358209[/C][C]-5.6751[/C][C]0[/C][/ROW]
[ROW][C]2[/C][C]-0.35218[/C][C]-5.5796[/C][C]0[/C][/ROW]
[ROW][C]3[/C][C]-0.43891[/C][C]-6.9536[/C][C]0[/C][/ROW]
[ROW][C]4[/C][C]-0.587212[/C][C]-9.3032[/C][C]0[/C][/ROW]
[ROW][C]5[/C][C]0.05255[/C][C]0.8325[/C][C]0.202947[/C][/ROW]
[ROW][C]6[/C][C]-0.005883[/C][C]-0.0932[/C][C]0.46291[/C][/ROW]
[ROW][C]7[/C][C]0.015588[/C][C]0.247[/C][C]0.402573[/C][/ROW]
[ROW][C]8[/C][C]-0.134527[/C][C]-2.1313[/C][C]0.017018[/C][/ROW]
[ROW][C]9[/C][C]-0.222152[/C][C]-3.5195[/C][C]0.000257[/C][/ROW]
[ROW][C]10[/C][C]0.024971[/C][C]0.3956[/C][C]0.346361[/C][/ROW]
[ROW][C]11[/C][C]-0.004955[/C][C]-0.0785[/C][C]0.468745[/C][/ROW]
[ROW][C]12[/C][C]0.043588[/C][C]0.6906[/C][C]0.245239[/C][/ROW]
[ROW][C]13[/C][C]-0.039419[/C][C]-0.6245[/C][C]0.266428[/C][/ROW]
[ROW][C]14[/C][C]-0.05993[/C][C]-0.9495[/C][C]0.171649[/C][/ROW]
[ROW][C]15[/C][C]-0.120269[/C][C]-1.9054[/C][C]0.028935[/C][/ROW]
[ROW][C]16[/C][C]-0.063689[/C][C]-1.009[/C][C]0.156966[/C][/ROW]
[ROW][C]17[/C][C]-0.019884[/C][C]-0.315[/C][C]0.376503[/C][/ROW]
[ROW][C]18[/C][C]-0.013097[/C][C]-0.2075[/C][C]0.417898[/C][/ROW]
[ROW][C]19[/C][C]0.009482[/C][C]0.1502[/C][C]0.440354[/C][/ROW]
[ROW][C]20[/C][C]0.033237[/C][C]0.5266[/C][C]0.299476[/C][/ROW]
[ROW][C]21[/C][C]0.019338[/C][C]0.3064[/C][C]0.379791[/C][/ROW]
[ROW][C]22[/C][C]0.065217[/C][C]1.0332[/C][C]0.151245[/C][/ROW]
[ROW][C]23[/C][C]-0.052569[/C][C]-0.8328[/C][C]0.202862[/C][/ROW]
[ROW][C]24[/C][C]0.072632[/C][C]1.1507[/C][C]0.125474[/C][/ROW]
[ROW][C]25[/C][C]0.082548[/C][C]1.3078[/C][C]0.096067[/C][/ROW]
[ROW][C]26[/C][C]0.063737[/C][C]1.0098[/C][C]0.156786[/C][/ROW]
[ROW][C]27[/C][C]0.114672[/C][C]1.8167[/C][C]0.035225[/C][/ROW]
[ROW][C]28[/C][C]-0.022309[/C][C]-0.3534[/C][C]0.362029[/C][/ROW]
[ROW][C]29[/C][C]-0.093808[/C][C]-1.4862[/C][C]0.069241[/C][/ROW]
[ROW][C]30[/C][C]-0.01324[/C][C]-0.2098[/C][C]0.417013[/C][/ROW]
[ROW][C]31[/C][C]0.035707[/C][C]0.5657[/C][C]0.286052[/C][/ROW]
[ROW][C]32[/C][C]-0.065052[/C][C]-1.0306[/C][C]0.151857[/C][/ROW]
[ROW][C]33[/C][C]0.110053[/C][C]1.7436[/C][C]0.04123[/C][/ROW]
[ROW][C]34[/C][C]0.004166[/C][C]0.066[/C][C]0.473714[/C][/ROW]
[ROW][C]35[/C][C]0.019709[/C][C]0.3122[/C][C]0.377557[/C][/ROW]
[ROW][C]36[/C][C]-0.068747[/C][C]-1.0892[/C][C]0.138563[/C][/ROW]
[ROW][C]37[/C][C]-0.036264[/C][C]-0.5745[/C][C]0.283064[/C][/ROW]
[ROW][C]38[/C][C]-0.055603[/C][C]-0.8809[/C][C]0.189605[/C][/ROW]
[ROW][C]39[/C][C]-0.037278[/C][C]-0.5906[/C][C]0.277659[/C][/ROW]
[ROW][C]40[/C][C]-0.012682[/C][C]-0.2009[/C][C]0.420461[/C][/ROW]
[ROW][C]41[/C][C]-0.02375[/C][C]-0.3763[/C][C]0.353515[/C][/ROW]
[ROW][C]42[/C][C]0.068396[/C][C]1.0836[/C][C]0.139791[/C][/ROW]
[ROW][C]43[/C][C]-0.086807[/C][C]-1.3753[/C][C]0.085136[/C][/ROW]
[ROW][C]44[/C][C]0.007885[/C][C]0.1249[/C][C]0.450345[/C][/ROW]
[ROW][C]45[/C][C]-0.064711[/C][C]-1.0252[/C][C]0.153124[/C][/ROW]
[ROW][C]46[/C][C]0.050946[/C][C]0.8071[/C][C]0.210176[/C][/ROW]
[ROW][C]47[/C][C]-0.021422[/C][C]-0.3394[/C][C]0.367303[/C][/ROW]
[ROW][C]48[/C][C]0.007423[/C][C]0.1176[/C][C]0.453241[/C][/ROW]
[/TABLE]
Source: https://freestatistics.org/blog/index.php?pk=40002&T=2

Globally Unique Identifier (entire table): ba.freestatistics.org/blog/index.php?pk=40002&T=2

As an alternative you can also use a QR Code:  

The GUIDs for individual cells are displayed in the table below:

Partial Autocorrelation Function
Time lag kPACF(k)T-STATP-value
1-0.358209-5.67510
2-0.35218-5.57960
3-0.43891-6.95360
4-0.587212-9.30320
50.052550.83250.202947
6-0.005883-0.09320.46291
70.0155880.2470.402573
8-0.134527-2.13130.017018
9-0.222152-3.51950.000257
100.0249710.39560.346361
11-0.004955-0.07850.468745
120.0435880.69060.245239
13-0.039419-0.62450.266428
14-0.05993-0.94950.171649
15-0.120269-1.90540.028935
16-0.063689-1.0090.156966
17-0.019884-0.3150.376503
18-0.013097-0.20750.417898
190.0094820.15020.440354
200.0332370.52660.299476
210.0193380.30640.379791
220.0652171.03320.151245
23-0.052569-0.83280.202862
240.0726321.15070.125474
250.0825481.30780.096067
260.0637371.00980.156786
270.1146721.81670.035225
28-0.022309-0.35340.362029
29-0.093808-1.48620.069241
30-0.01324-0.20980.417013
310.0357070.56570.286052
32-0.065052-1.03060.151857
330.1100531.74360.04123
340.0041660.0660.473714
350.0197090.31220.377557
36-0.068747-1.08920.138563
37-0.036264-0.57450.283064
38-0.055603-0.88090.189605
39-0.037278-0.59060.277659
40-0.012682-0.20090.420461
41-0.02375-0.37630.353515
420.0683961.08360.139791
43-0.086807-1.37530.085136
440.0078850.12490.450345
45-0.064711-1.02520.153124
460.0509460.80710.210176
47-0.021422-0.33940.367303
480.0074230.11760.453241


Parameters (Session):
par1 = 48 ; par2 = 1 ; par3 = 1 ; par4 = 0 ; par5 = 12 ;
Parameters (R input):
par1 = 48 ; par2 = 1 ; par3 = 1 ; par4 = 0 ; par5 = 12 ;
R code (references can be found in the software module):
if (par1 == 'Default') {
par1 = 10*log10(length(x))
} else {
par1 <- as.numeric(par1)
}
par2 <- as.numeric(par2)
par3 <- as.numeric(par3)
par4 <- as.numeric(par4)
par5 <- as.numeric(par5)
if (par2 == 0) {
x <- log(x)
} else {
x <- (x ^ par2 - 1) / par2
}
if (par3 > 0) x <- diff(x,lag=1,difference=par3)
if (par4 > 0) x <- diff(x,lag=par5,difference=par4)
bitmap(file='pic1.png')
racf <- acf(x,par1,main='Autocorrelation',xlab='lags',ylab='ACF')
dev.off()
bitmap(file='pic2.png')
rpacf <- pacf(x,par1,main='Partial Autocorrelation',xlab='lags',ylab='PACF')
dev.off()
(myacf <- c(racf$acf))
(mypacf <- c(rpacf$acf))
lengthx <- length(x)
sqrtn <- sqrt(lengthx)
load(file='createtable')
a<-table.start()
a<-table.row.start(a)
a<-table.element(a,'Autocorrelation Function',4,TRUE)
a<-table.row.end(a)
a<-table.row.start(a)
a<-table.element(a,'Time lag k',header=TRUE)
a<-table.element(a,hyperlink('basics.htm','ACF(k)','click here for more information about the Autocorrelation Function'),header=TRUE)
a<-table.element(a,'T-STAT',header=TRUE)
a<-table.element(a,'P-value',header=TRUE)
a<-table.row.end(a)
for (i in 2:(par1+1)) {
a<-table.row.start(a)
a<-table.element(a,i-1,header=TRUE)
a<-table.element(a,round(myacf[i],6))
mytstat <- myacf[i]*sqrtn
a<-table.element(a,round(mytstat,4))
a<-table.element(a,round(1-pt(abs(mytstat),lengthx),6))
a<-table.row.end(a)
}
a<-table.end(a)
table.save(a,file='mytable.tab')
a<-table.start()
a<-table.row.start(a)
a<-table.element(a,'Partial Autocorrelation Function',4,TRUE)
a<-table.row.end(a)
a<-table.row.start(a)
a<-table.element(a,'Time lag k',header=TRUE)
a<-table.element(a,hyperlink('basics.htm','PACF(k)','click here for more information about the Partial Autocorrelation Function'),header=TRUE)
a<-table.element(a,'T-STAT',header=TRUE)
a<-table.element(a,'P-value',header=TRUE)
a<-table.row.end(a)
for (i in 1:par1) {
a<-table.row.start(a)
a<-table.element(a,i,header=TRUE)
a<-table.element(a,round(mypacf[i],6))
mytstat <- mypacf[i]*sqrtn
a<-table.element(a,round(mytstat,4))
a<-table.element(a,round(1-pt(abs(mytstat),lengthx),6))
a<-table.row.end(a)
}
a<-table.end(a)
table.save(a,file='mytable1.tab')