Free Statistics

of Irreproducible Research!

Author's title

Author*Unverified author*
R Software Modulerwasp_autocorrelation.wasp
Title produced by software(Partial) Autocorrelation Function
Date of computationMon, 08 Dec 2008 13:23:30 -0700
Cite this page as followsStatistical Computations at FreeStatistics.org, Office for Research Development and Education, URL https://freestatistics.org/blog/index.php?v=date/2008/Dec/08/t1228767941q73c1yhgq84jo5d.htm/, Retrieved Tue, 14 May 2024 12:18:08 +0000
Statistical Computations at FreeStatistics.org, Office for Research Development and Education, URL https://freestatistics.org/blog/index.php?pk=30956, Retrieved Tue, 14 May 2024 12:18:08 +0000
QR Codes:

Original text written by user:
IsPrivate?No (this computation is public)
User-defined keywords
Estimated Impact149
Family? (F = Feedback message, R = changed R code, M = changed R Module, P = changed Parameters, D = changed Data)
-       [(Partial) Autocorrelation Function] [opgave 6bis- oefe...] [2008-12-08 20:23:30] [59eb7d50a05a673a4523845c066501a9] [Current]
-    D    [(Partial) Autocorrelation Function] [Kristof Nollekens...] [2009-05-14 14:00:09] [74be16979710d4c4e7c6647856088456]
Feedback Forum

Post a new message
Dataseries X:
101.6
101.8
102.1
102.1
101.9
102.1
102
102.1
102.2
102.3
102.7
102.8
103.1
103.1
103.3
103.5
103.3
103.5
103.8
103.9
103.9
104.2
104.6
104.9
105.2
105.2
105.6
105.6
106.2
106.3
106.4
106.9
107.2
107.3
107.3
107.4
107.55
107.87
108.37
108.38
107.92
108.03
108.14
108.3
108.64
108.66
109.04
109.03
109.03
109.54
109.75
109.83
109.65
109.82
109.95
110.12
110.15
110.2
109.99
110.14
110.14
110.81
110.97
110.99
109.73
109.81
110.02
110.18
110.21
110.25
110.36
110.51
110.64
110.95
111.18
111.19
111.69
111.7
111.83
111.77
111.73
112.01
111.86
112.04


Summary of computational transaction
Raw Inputview raw input (R code)
Raw Outputview raw output of R engine
Computing time3 seconds
R Server'Sir Ronald Aylmer Fisher' @ 193.190.124.24

\begin{tabular}{lllllllll}
\hline
Summary of computational transaction \tabularnewline
Raw Input & view raw input (R code)  \tabularnewline
Raw Output & view raw output of R engine  \tabularnewline
Computing time & 3 seconds \tabularnewline
R Server & 'Sir Ronald Aylmer Fisher' @ 193.190.124.24 \tabularnewline
\hline
\end{tabular}
%Source: https://freestatistics.org/blog/index.php?pk=30956&T=0

[TABLE]
[ROW][C]Summary of computational transaction[/C][/ROW]
[ROW][C]Raw Input[/C][C]view raw input (R code) [/C][/ROW]
[ROW][C]Raw Output[/C][C]view raw output of R engine [/C][/ROW]
[ROW][C]Computing time[/C][C]3 seconds[/C][/ROW]
[ROW][C]R Server[/C][C]'Sir Ronald Aylmer Fisher' @ 193.190.124.24[/C][/ROW]
[/TABLE]
Source: https://freestatistics.org/blog/index.php?pk=30956&T=0

Globally Unique Identifier (entire table): ba.freestatistics.org/blog/index.php?pk=30956&T=0

As an alternative you can also use a QR Code:  

The GUIDs for individual cells are displayed in the table below:

Summary of computational transaction
Raw Inputview raw input (R code)
Raw Outputview raw output of R engine
Computing time3 seconds
R Server'Sir Ronald Aylmer Fisher' @ 193.190.124.24


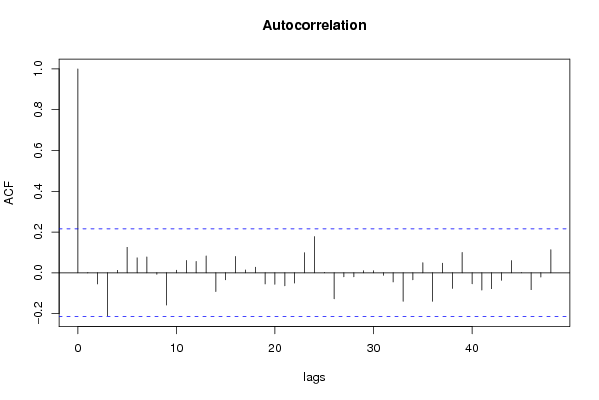
Autocorrelation Function
Time lag kACF(k)T-STATP-value
1-0.001057-0.00960.496169
2-0.054457-0.49610.310558
3-0.210477-1.91750.029305
40.0119820.10920.456669
50.1248361.13730.12934
60.0733280.66810.252976
70.0772550.70380.241754
8-0.007454-0.06790.473012
9-0.158163-1.44090.076682
100.0124170.11310.455102
110.0605710.55180.291275
120.0552570.50340.308002
130.0829570.75580.225961
14-0.091548-0.8340.203325
15-0.033795-0.30790.379469
160.0799150.72810.234314
170.0137290.12510.450381
180.0274180.24980.401684
19-0.054451-0.49610.310578
20-0.056221-0.51220.304936
21-0.06329-0.57660.282884
22-0.049828-0.4540.325524
230.0986260.89850.185752
240.1776551.61850.054673
250.0017210.01570.493765
26-0.12771-1.16350.123981
27-0.019109-0.17410.431108
28-0.019715-0.17960.428949
290.0104440.09520.462212
300.0104460.09520.462206
31-0.012517-0.1140.454742
32-0.044564-0.4060.342894
33-0.139485-1.27080.10368
34-0.033827-0.30820.37936
350.0493280.44940.327158
36-0.139862-1.27420.103074
370.0473390.43130.333692
38-0.076503-0.6970.243882
390.0994710.90620.18372
40-0.053583-0.48820.313361
41-0.084437-0.76930.221962
42-0.077819-0.7090.240166
43-0.036519-0.33270.370099
440.0597650.54450.293783
45-9.9e-05-9e-040.499642
46-0.082649-0.7530.2268
47-0.020828-0.18980.424982
480.1131621.0310.152779

\begin{tabular}{lllllllll}
\hline
Autocorrelation Function \tabularnewline
Time lag k & ACF(k) & T-STAT & P-value \tabularnewline
1 & -0.001057 & -0.0096 & 0.496169 \tabularnewline
2 & -0.054457 & -0.4961 & 0.310558 \tabularnewline
3 & -0.210477 & -1.9175 & 0.029305 \tabularnewline
4 & 0.011982 & 0.1092 & 0.456669 \tabularnewline
5 & 0.124836 & 1.1373 & 0.12934 \tabularnewline
6 & 0.073328 & 0.6681 & 0.252976 \tabularnewline
7 & 0.077255 & 0.7038 & 0.241754 \tabularnewline
8 & -0.007454 & -0.0679 & 0.473012 \tabularnewline
9 & -0.158163 & -1.4409 & 0.076682 \tabularnewline
10 & 0.012417 & 0.1131 & 0.455102 \tabularnewline
11 & 0.060571 & 0.5518 & 0.291275 \tabularnewline
12 & 0.055257 & 0.5034 & 0.308002 \tabularnewline
13 & 0.082957 & 0.7558 & 0.225961 \tabularnewline
14 & -0.091548 & -0.834 & 0.203325 \tabularnewline
15 & -0.033795 & -0.3079 & 0.379469 \tabularnewline
16 & 0.079915 & 0.7281 & 0.234314 \tabularnewline
17 & 0.013729 & 0.1251 & 0.450381 \tabularnewline
18 & 0.027418 & 0.2498 & 0.401684 \tabularnewline
19 & -0.054451 & -0.4961 & 0.310578 \tabularnewline
20 & -0.056221 & -0.5122 & 0.304936 \tabularnewline
21 & -0.06329 & -0.5766 & 0.282884 \tabularnewline
22 & -0.049828 & -0.454 & 0.325524 \tabularnewline
23 & 0.098626 & 0.8985 & 0.185752 \tabularnewline
24 & 0.177655 & 1.6185 & 0.054673 \tabularnewline
25 & 0.001721 & 0.0157 & 0.493765 \tabularnewline
26 & -0.12771 & -1.1635 & 0.123981 \tabularnewline
27 & -0.019109 & -0.1741 & 0.431108 \tabularnewline
28 & -0.019715 & -0.1796 & 0.428949 \tabularnewline
29 & 0.010444 & 0.0952 & 0.462212 \tabularnewline
30 & 0.010446 & 0.0952 & 0.462206 \tabularnewline
31 & -0.012517 & -0.114 & 0.454742 \tabularnewline
32 & -0.044564 & -0.406 & 0.342894 \tabularnewline
33 & -0.139485 & -1.2708 & 0.10368 \tabularnewline
34 & -0.033827 & -0.3082 & 0.37936 \tabularnewline
35 & 0.049328 & 0.4494 & 0.327158 \tabularnewline
36 & -0.139862 & -1.2742 & 0.103074 \tabularnewline
37 & 0.047339 & 0.4313 & 0.333692 \tabularnewline
38 & -0.076503 & -0.697 & 0.243882 \tabularnewline
39 & 0.099471 & 0.9062 & 0.18372 \tabularnewline
40 & -0.053583 & -0.4882 & 0.313361 \tabularnewline
41 & -0.084437 & -0.7693 & 0.221962 \tabularnewline
42 & -0.077819 & -0.709 & 0.240166 \tabularnewline
43 & -0.036519 & -0.3327 & 0.370099 \tabularnewline
44 & 0.059765 & 0.5445 & 0.293783 \tabularnewline
45 & -9.9e-05 & -9e-04 & 0.499642 \tabularnewline
46 & -0.082649 & -0.753 & 0.2268 \tabularnewline
47 & -0.020828 & -0.1898 & 0.424982 \tabularnewline
48 & 0.113162 & 1.031 & 0.152779 \tabularnewline
\hline
\end{tabular}
%Source: https://freestatistics.org/blog/index.php?pk=30956&T=1

[TABLE]
[ROW][C]Autocorrelation Function[/C][/ROW]
[ROW][C]Time lag k[/C][C]ACF(k)[/C][C]T-STAT[/C][C]P-value[/C][/ROW]
[ROW][C]1[/C][C]-0.001057[/C][C]-0.0096[/C][C]0.496169[/C][/ROW]
[ROW][C]2[/C][C]-0.054457[/C][C]-0.4961[/C][C]0.310558[/C][/ROW]
[ROW][C]3[/C][C]-0.210477[/C][C]-1.9175[/C][C]0.029305[/C][/ROW]
[ROW][C]4[/C][C]0.011982[/C][C]0.1092[/C][C]0.456669[/C][/ROW]
[ROW][C]5[/C][C]0.124836[/C][C]1.1373[/C][C]0.12934[/C][/ROW]
[ROW][C]6[/C][C]0.073328[/C][C]0.6681[/C][C]0.252976[/C][/ROW]
[ROW][C]7[/C][C]0.077255[/C][C]0.7038[/C][C]0.241754[/C][/ROW]
[ROW][C]8[/C][C]-0.007454[/C][C]-0.0679[/C][C]0.473012[/C][/ROW]
[ROW][C]9[/C][C]-0.158163[/C][C]-1.4409[/C][C]0.076682[/C][/ROW]
[ROW][C]10[/C][C]0.012417[/C][C]0.1131[/C][C]0.455102[/C][/ROW]
[ROW][C]11[/C][C]0.060571[/C][C]0.5518[/C][C]0.291275[/C][/ROW]
[ROW][C]12[/C][C]0.055257[/C][C]0.5034[/C][C]0.308002[/C][/ROW]
[ROW][C]13[/C][C]0.082957[/C][C]0.7558[/C][C]0.225961[/C][/ROW]
[ROW][C]14[/C][C]-0.091548[/C][C]-0.834[/C][C]0.203325[/C][/ROW]
[ROW][C]15[/C][C]-0.033795[/C][C]-0.3079[/C][C]0.379469[/C][/ROW]
[ROW][C]16[/C][C]0.079915[/C][C]0.7281[/C][C]0.234314[/C][/ROW]
[ROW][C]17[/C][C]0.013729[/C][C]0.1251[/C][C]0.450381[/C][/ROW]
[ROW][C]18[/C][C]0.027418[/C][C]0.2498[/C][C]0.401684[/C][/ROW]
[ROW][C]19[/C][C]-0.054451[/C][C]-0.4961[/C][C]0.310578[/C][/ROW]
[ROW][C]20[/C][C]-0.056221[/C][C]-0.5122[/C][C]0.304936[/C][/ROW]
[ROW][C]21[/C][C]-0.06329[/C][C]-0.5766[/C][C]0.282884[/C][/ROW]
[ROW][C]22[/C][C]-0.049828[/C][C]-0.454[/C][C]0.325524[/C][/ROW]
[ROW][C]23[/C][C]0.098626[/C][C]0.8985[/C][C]0.185752[/C][/ROW]
[ROW][C]24[/C][C]0.177655[/C][C]1.6185[/C][C]0.054673[/C][/ROW]
[ROW][C]25[/C][C]0.001721[/C][C]0.0157[/C][C]0.493765[/C][/ROW]
[ROW][C]26[/C][C]-0.12771[/C][C]-1.1635[/C][C]0.123981[/C][/ROW]
[ROW][C]27[/C][C]-0.019109[/C][C]-0.1741[/C][C]0.431108[/C][/ROW]
[ROW][C]28[/C][C]-0.019715[/C][C]-0.1796[/C][C]0.428949[/C][/ROW]
[ROW][C]29[/C][C]0.010444[/C][C]0.0952[/C][C]0.462212[/C][/ROW]
[ROW][C]30[/C][C]0.010446[/C][C]0.0952[/C][C]0.462206[/C][/ROW]
[ROW][C]31[/C][C]-0.012517[/C][C]-0.114[/C][C]0.454742[/C][/ROW]
[ROW][C]32[/C][C]-0.044564[/C][C]-0.406[/C][C]0.342894[/C][/ROW]
[ROW][C]33[/C][C]-0.139485[/C][C]-1.2708[/C][C]0.10368[/C][/ROW]
[ROW][C]34[/C][C]-0.033827[/C][C]-0.3082[/C][C]0.37936[/C][/ROW]
[ROW][C]35[/C][C]0.049328[/C][C]0.4494[/C][C]0.327158[/C][/ROW]
[ROW][C]36[/C][C]-0.139862[/C][C]-1.2742[/C][C]0.103074[/C][/ROW]
[ROW][C]37[/C][C]0.047339[/C][C]0.4313[/C][C]0.333692[/C][/ROW]
[ROW][C]38[/C][C]-0.076503[/C][C]-0.697[/C][C]0.243882[/C][/ROW]
[ROW][C]39[/C][C]0.099471[/C][C]0.9062[/C][C]0.18372[/C][/ROW]
[ROW][C]40[/C][C]-0.053583[/C][C]-0.4882[/C][C]0.313361[/C][/ROW]
[ROW][C]41[/C][C]-0.084437[/C][C]-0.7693[/C][C]0.221962[/C][/ROW]
[ROW][C]42[/C][C]-0.077819[/C][C]-0.709[/C][C]0.240166[/C][/ROW]
[ROW][C]43[/C][C]-0.036519[/C][C]-0.3327[/C][C]0.370099[/C][/ROW]
[ROW][C]44[/C][C]0.059765[/C][C]0.5445[/C][C]0.293783[/C][/ROW]
[ROW][C]45[/C][C]-9.9e-05[/C][C]-9e-04[/C][C]0.499642[/C][/ROW]
[ROW][C]46[/C][C]-0.082649[/C][C]-0.753[/C][C]0.2268[/C][/ROW]
[ROW][C]47[/C][C]-0.020828[/C][C]-0.1898[/C][C]0.424982[/C][/ROW]
[ROW][C]48[/C][C]0.113162[/C][C]1.031[/C][C]0.152779[/C][/ROW]
[/TABLE]
Source: https://freestatistics.org/blog/index.php?pk=30956&T=1

Globally Unique Identifier (entire table): ba.freestatistics.org/blog/index.php?pk=30956&T=1

As an alternative you can also use a QR Code:  

The GUIDs for individual cells are displayed in the table below:

Autocorrelation Function
Time lag kACF(k)T-STATP-value
1-0.001057-0.00960.496169
2-0.054457-0.49610.310558
3-0.210477-1.91750.029305
40.0119820.10920.456669
50.1248361.13730.12934
60.0733280.66810.252976
70.0772550.70380.241754
8-0.007454-0.06790.473012
9-0.158163-1.44090.076682
100.0124170.11310.455102
110.0605710.55180.291275
120.0552570.50340.308002
130.0829570.75580.225961
14-0.091548-0.8340.203325
15-0.033795-0.30790.379469
160.0799150.72810.234314
170.0137290.12510.450381
180.0274180.24980.401684
19-0.054451-0.49610.310578
20-0.056221-0.51220.304936
21-0.06329-0.57660.282884
22-0.049828-0.4540.325524
230.0986260.89850.185752
240.1776551.61850.054673
250.0017210.01570.493765
26-0.12771-1.16350.123981
27-0.019109-0.17410.431108
28-0.019715-0.17960.428949
290.0104440.09520.462212
300.0104460.09520.462206
31-0.012517-0.1140.454742
32-0.044564-0.4060.342894
33-0.139485-1.27080.10368
34-0.033827-0.30820.37936
350.0493280.44940.327158
36-0.139862-1.27420.103074
370.0473390.43130.333692
38-0.076503-0.6970.243882
390.0994710.90620.18372
40-0.053583-0.48820.313361
41-0.084437-0.76930.221962
42-0.077819-0.7090.240166
43-0.036519-0.33270.370099
440.0597650.54450.293783
45-9.9e-05-9e-040.499642
46-0.082649-0.7530.2268
47-0.020828-0.18980.424982
480.1131621.0310.152779


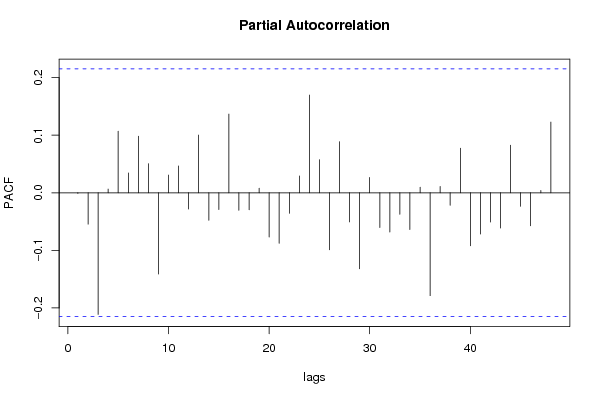
Partial Autocorrelation Function
Time lag kPACF(k)T-STATP-value
1-0.001057-0.00960.496169
2-0.054458-0.49610.310554
3-0.211222-1.92430.028871
40.006430.05860.476715
50.107130.9760.165951
60.0345320.31460.376928
70.0983580.89610.186399
80.0504850.45990.323381
9-0.14122-1.28660.10091
100.0308020.28060.389849
110.0464710.42340.336561
12-0.028038-0.25540.399508
130.1001890.91280.182005
14-0.047697-0.43450.332511
15-0.028934-0.26360.396369
160.1367171.24550.108217
17-0.030328-0.27630.391501
18-0.029444-0.26820.394588
190.0080340.07320.470913
20-0.076839-0.70.242931
21-0.087712-0.79910.213258
22-0.0357-0.32520.372909
230.0292750.26670.395179
240.1696751.54580.062977
250.0575460.52430.300743
26-0.09888-0.90080.185139
270.0886950.8080.210686
28-0.050549-0.46050.323171
29-0.131862-1.20130.116522
300.0265970.24230.40457
31-0.060409-0.55040.291778
32-0.068201-0.62130.268039
33-0.037263-0.33950.367554
34-0.063934-0.58250.280916
350.0095460.0870.465452
36-0.178686-1.62790.053667
370.0109490.09980.460391
38-0.021752-0.19820.421697
390.0773160.70440.241583
40-0.091927-0.83750.20236
41-0.071643-0.65270.257878
42-0.050764-0.46250.322473
43-0.061121-0.55680.289568
440.0825590.75210.227045
45-0.023547-0.21450.415332
46-0.057165-0.52080.301948
470.0040540.03690.485315
480.1228161.11890.133205

\begin{tabular}{lllllllll}
\hline
Partial Autocorrelation Function \tabularnewline
Time lag k & PACF(k) & T-STAT & P-value \tabularnewline
1 & -0.001057 & -0.0096 & 0.496169 \tabularnewline
2 & -0.054458 & -0.4961 & 0.310554 \tabularnewline
3 & -0.211222 & -1.9243 & 0.028871 \tabularnewline
4 & 0.00643 & 0.0586 & 0.476715 \tabularnewline
5 & 0.10713 & 0.976 & 0.165951 \tabularnewline
6 & 0.034532 & 0.3146 & 0.376928 \tabularnewline
7 & 0.098358 & 0.8961 & 0.186399 \tabularnewline
8 & 0.050485 & 0.4599 & 0.323381 \tabularnewline
9 & -0.14122 & -1.2866 & 0.10091 \tabularnewline
10 & 0.030802 & 0.2806 & 0.389849 \tabularnewline
11 & 0.046471 & 0.4234 & 0.336561 \tabularnewline
12 & -0.028038 & -0.2554 & 0.399508 \tabularnewline
13 & 0.100189 & 0.9128 & 0.182005 \tabularnewline
14 & -0.047697 & -0.4345 & 0.332511 \tabularnewline
15 & -0.028934 & -0.2636 & 0.396369 \tabularnewline
16 & 0.136717 & 1.2455 & 0.108217 \tabularnewline
17 & -0.030328 & -0.2763 & 0.391501 \tabularnewline
18 & -0.029444 & -0.2682 & 0.394588 \tabularnewline
19 & 0.008034 & 0.0732 & 0.470913 \tabularnewline
20 & -0.076839 & -0.7 & 0.242931 \tabularnewline
21 & -0.087712 & -0.7991 & 0.213258 \tabularnewline
22 & -0.0357 & -0.3252 & 0.372909 \tabularnewline
23 & 0.029275 & 0.2667 & 0.395179 \tabularnewline
24 & 0.169675 & 1.5458 & 0.062977 \tabularnewline
25 & 0.057546 & 0.5243 & 0.300743 \tabularnewline
26 & -0.09888 & -0.9008 & 0.185139 \tabularnewline
27 & 0.088695 & 0.808 & 0.210686 \tabularnewline
28 & -0.050549 & -0.4605 & 0.323171 \tabularnewline
29 & -0.131862 & -1.2013 & 0.116522 \tabularnewline
30 & 0.026597 & 0.2423 & 0.40457 \tabularnewline
31 & -0.060409 & -0.5504 & 0.291778 \tabularnewline
32 & -0.068201 & -0.6213 & 0.268039 \tabularnewline
33 & -0.037263 & -0.3395 & 0.367554 \tabularnewline
34 & -0.063934 & -0.5825 & 0.280916 \tabularnewline
35 & 0.009546 & 0.087 & 0.465452 \tabularnewline
36 & -0.178686 & -1.6279 & 0.053667 \tabularnewline
37 & 0.010949 & 0.0998 & 0.460391 \tabularnewline
38 & -0.021752 & -0.1982 & 0.421697 \tabularnewline
39 & 0.077316 & 0.7044 & 0.241583 \tabularnewline
40 & -0.091927 & -0.8375 & 0.20236 \tabularnewline
41 & -0.071643 & -0.6527 & 0.257878 \tabularnewline
42 & -0.050764 & -0.4625 & 0.322473 \tabularnewline
43 & -0.061121 & -0.5568 & 0.289568 \tabularnewline
44 & 0.082559 & 0.7521 & 0.227045 \tabularnewline
45 & -0.023547 & -0.2145 & 0.415332 \tabularnewline
46 & -0.057165 & -0.5208 & 0.301948 \tabularnewline
47 & 0.004054 & 0.0369 & 0.485315 \tabularnewline
48 & 0.122816 & 1.1189 & 0.133205 \tabularnewline
\hline
\end{tabular}
%Source: https://freestatistics.org/blog/index.php?pk=30956&T=2

[TABLE]
[ROW][C]Partial Autocorrelation Function[/C][/ROW]
[ROW][C]Time lag k[/C][C]PACF(k)[/C][C]T-STAT[/C][C]P-value[/C][/ROW]
[ROW][C]1[/C][C]-0.001057[/C][C]-0.0096[/C][C]0.496169[/C][/ROW]
[ROW][C]2[/C][C]-0.054458[/C][C]-0.4961[/C][C]0.310554[/C][/ROW]
[ROW][C]3[/C][C]-0.211222[/C][C]-1.9243[/C][C]0.028871[/C][/ROW]
[ROW][C]4[/C][C]0.00643[/C][C]0.0586[/C][C]0.476715[/C][/ROW]
[ROW][C]5[/C][C]0.10713[/C][C]0.976[/C][C]0.165951[/C][/ROW]
[ROW][C]6[/C][C]0.034532[/C][C]0.3146[/C][C]0.376928[/C][/ROW]
[ROW][C]7[/C][C]0.098358[/C][C]0.8961[/C][C]0.186399[/C][/ROW]
[ROW][C]8[/C][C]0.050485[/C][C]0.4599[/C][C]0.323381[/C][/ROW]
[ROW][C]9[/C][C]-0.14122[/C][C]-1.2866[/C][C]0.10091[/C][/ROW]
[ROW][C]10[/C][C]0.030802[/C][C]0.2806[/C][C]0.389849[/C][/ROW]
[ROW][C]11[/C][C]0.046471[/C][C]0.4234[/C][C]0.336561[/C][/ROW]
[ROW][C]12[/C][C]-0.028038[/C][C]-0.2554[/C][C]0.399508[/C][/ROW]
[ROW][C]13[/C][C]0.100189[/C][C]0.9128[/C][C]0.182005[/C][/ROW]
[ROW][C]14[/C][C]-0.047697[/C][C]-0.4345[/C][C]0.332511[/C][/ROW]
[ROW][C]15[/C][C]-0.028934[/C][C]-0.2636[/C][C]0.396369[/C][/ROW]
[ROW][C]16[/C][C]0.136717[/C][C]1.2455[/C][C]0.108217[/C][/ROW]
[ROW][C]17[/C][C]-0.030328[/C][C]-0.2763[/C][C]0.391501[/C][/ROW]
[ROW][C]18[/C][C]-0.029444[/C][C]-0.2682[/C][C]0.394588[/C][/ROW]
[ROW][C]19[/C][C]0.008034[/C][C]0.0732[/C][C]0.470913[/C][/ROW]
[ROW][C]20[/C][C]-0.076839[/C][C]-0.7[/C][C]0.242931[/C][/ROW]
[ROW][C]21[/C][C]-0.087712[/C][C]-0.7991[/C][C]0.213258[/C][/ROW]
[ROW][C]22[/C][C]-0.0357[/C][C]-0.3252[/C][C]0.372909[/C][/ROW]
[ROW][C]23[/C][C]0.029275[/C][C]0.2667[/C][C]0.395179[/C][/ROW]
[ROW][C]24[/C][C]0.169675[/C][C]1.5458[/C][C]0.062977[/C][/ROW]
[ROW][C]25[/C][C]0.057546[/C][C]0.5243[/C][C]0.300743[/C][/ROW]
[ROW][C]26[/C][C]-0.09888[/C][C]-0.9008[/C][C]0.185139[/C][/ROW]
[ROW][C]27[/C][C]0.088695[/C][C]0.808[/C][C]0.210686[/C][/ROW]
[ROW][C]28[/C][C]-0.050549[/C][C]-0.4605[/C][C]0.323171[/C][/ROW]
[ROW][C]29[/C][C]-0.131862[/C][C]-1.2013[/C][C]0.116522[/C][/ROW]
[ROW][C]30[/C][C]0.026597[/C][C]0.2423[/C][C]0.40457[/C][/ROW]
[ROW][C]31[/C][C]-0.060409[/C][C]-0.5504[/C][C]0.291778[/C][/ROW]
[ROW][C]32[/C][C]-0.068201[/C][C]-0.6213[/C][C]0.268039[/C][/ROW]
[ROW][C]33[/C][C]-0.037263[/C][C]-0.3395[/C][C]0.367554[/C][/ROW]
[ROW][C]34[/C][C]-0.063934[/C][C]-0.5825[/C][C]0.280916[/C][/ROW]
[ROW][C]35[/C][C]0.009546[/C][C]0.087[/C][C]0.465452[/C][/ROW]
[ROW][C]36[/C][C]-0.178686[/C][C]-1.6279[/C][C]0.053667[/C][/ROW]
[ROW][C]37[/C][C]0.010949[/C][C]0.0998[/C][C]0.460391[/C][/ROW]
[ROW][C]38[/C][C]-0.021752[/C][C]-0.1982[/C][C]0.421697[/C][/ROW]
[ROW][C]39[/C][C]0.077316[/C][C]0.7044[/C][C]0.241583[/C][/ROW]
[ROW][C]40[/C][C]-0.091927[/C][C]-0.8375[/C][C]0.20236[/C][/ROW]
[ROW][C]41[/C][C]-0.071643[/C][C]-0.6527[/C][C]0.257878[/C][/ROW]
[ROW][C]42[/C][C]-0.050764[/C][C]-0.4625[/C][C]0.322473[/C][/ROW]
[ROW][C]43[/C][C]-0.061121[/C][C]-0.5568[/C][C]0.289568[/C][/ROW]
[ROW][C]44[/C][C]0.082559[/C][C]0.7521[/C][C]0.227045[/C][/ROW]
[ROW][C]45[/C][C]-0.023547[/C][C]-0.2145[/C][C]0.415332[/C][/ROW]
[ROW][C]46[/C][C]-0.057165[/C][C]-0.5208[/C][C]0.301948[/C][/ROW]
[ROW][C]47[/C][C]0.004054[/C][C]0.0369[/C][C]0.485315[/C][/ROW]
[ROW][C]48[/C][C]0.122816[/C][C]1.1189[/C][C]0.133205[/C][/ROW]
[/TABLE]
Source: https://freestatistics.org/blog/index.php?pk=30956&T=2

Globally Unique Identifier (entire table): ba.freestatistics.org/blog/index.php?pk=30956&T=2

As an alternative you can also use a QR Code:  

The GUIDs for individual cells are displayed in the table below:

Partial Autocorrelation Function
Time lag kPACF(k)T-STATP-value
1-0.001057-0.00960.496169
2-0.054458-0.49610.310554
3-0.211222-1.92430.028871
40.006430.05860.476715
50.107130.9760.165951
60.0345320.31460.376928
70.0983580.89610.186399
80.0504850.45990.323381
9-0.14122-1.28660.10091
100.0308020.28060.389849
110.0464710.42340.336561
12-0.028038-0.25540.399508
130.1001890.91280.182005
14-0.047697-0.43450.332511
15-0.028934-0.26360.396369
160.1367171.24550.108217
17-0.030328-0.27630.391501
18-0.029444-0.26820.394588
190.0080340.07320.470913
20-0.076839-0.70.242931
21-0.087712-0.79910.213258
22-0.0357-0.32520.372909
230.0292750.26670.395179
240.1696751.54580.062977
250.0575460.52430.300743
26-0.09888-0.90080.185139
270.0886950.8080.210686
28-0.050549-0.46050.323171
29-0.131862-1.20130.116522
300.0265970.24230.40457
31-0.060409-0.55040.291778
32-0.068201-0.62130.268039
33-0.037263-0.33950.367554
34-0.063934-0.58250.280916
350.0095460.0870.465452
36-0.178686-1.62790.053667
370.0109490.09980.460391
38-0.021752-0.19820.421697
390.0773160.70440.241583
40-0.091927-0.83750.20236
41-0.071643-0.65270.257878
42-0.050764-0.46250.322473
43-0.061121-0.55680.289568
440.0825590.75210.227045
45-0.023547-0.21450.415332
46-0.057165-0.52080.301948
470.0040540.03690.485315
480.1228161.11890.133205


Parameters (Session):
par1 = 48 ; par2 = 1 ; par3 = 1 ; par4 = 0 ; par5 = 12 ;
Parameters (R input):
par1 = 48 ; par2 = 1 ; par3 = 1 ; par4 = 0 ; par5 = 12 ;
R code (references can be found in the software module):
if (par1 == 'Default') {
par1 = 10*log10(length(x))
} else {
par1 <- as.numeric(par1)
}
par2 <- as.numeric(par2)
par3 <- as.numeric(par3)
par4 <- as.numeric(par4)
par5 <- as.numeric(par5)
if (par2 == 0) {
x <- log(x)
} else {
x <- (x ^ par2 - 1) / par2
}
if (par3 > 0) x <- diff(x,lag=1,difference=par3)
if (par4 > 0) x <- diff(x,lag=par5,difference=par4)
bitmap(file='pic1.png')
racf <- acf(x,par1,main='Autocorrelation',xlab='lags',ylab='ACF')
dev.off()
bitmap(file='pic2.png')
rpacf <- pacf(x,par1,main='Partial Autocorrelation',xlab='lags',ylab='PACF')
dev.off()
(myacf <- c(racf$acf))
(mypacf <- c(rpacf$acf))
lengthx <- length(x)
sqrtn <- sqrt(lengthx)
load(file='createtable')
a<-table.start()
a<-table.row.start(a)
a<-table.element(a,'Autocorrelation Function',4,TRUE)
a<-table.row.end(a)
a<-table.row.start(a)
a<-table.element(a,'Time lag k',header=TRUE)
a<-table.element(a,hyperlink('basics.htm','ACF(k)','click here for more information about the Autocorrelation Function'),header=TRUE)
a<-table.element(a,'T-STAT',header=TRUE)
a<-table.element(a,'P-value',header=TRUE)
a<-table.row.end(a)
for (i in 2:(par1+1)) {
a<-table.row.start(a)
a<-table.element(a,i-1,header=TRUE)
a<-table.element(a,round(myacf[i],6))
mytstat <- myacf[i]*sqrtn
a<-table.element(a,round(mytstat,4))
a<-table.element(a,round(1-pt(abs(mytstat),lengthx),6))
a<-table.row.end(a)
}
a<-table.end(a)
table.save(a,file='mytable.tab')
a<-table.start()
a<-table.row.start(a)
a<-table.element(a,'Partial Autocorrelation Function',4,TRUE)
a<-table.row.end(a)
a<-table.row.start(a)
a<-table.element(a,'Time lag k',header=TRUE)
a<-table.element(a,hyperlink('basics.htm','PACF(k)','click here for more information about the Partial Autocorrelation Function'),header=TRUE)
a<-table.element(a,'T-STAT',header=TRUE)
a<-table.element(a,'P-value',header=TRUE)
a<-table.row.end(a)
for (i in 1:par1) {
a<-table.row.start(a)
a<-table.element(a,i,header=TRUE)
a<-table.element(a,round(mypacf[i],6))
mytstat <- mypacf[i]*sqrtn
a<-table.element(a,round(mytstat,4))
a<-table.element(a,round(1-pt(abs(mytstat),lengthx),6))
a<-table.row.end(a)
}
a<-table.end(a)
table.save(a,file='mytable1.tab')