Free Statistics

of Irreproducible Research!

Author's title

Author*Unverified author*
R Software Modulerwasp_smp.wasp
Title produced by softwareStandard Deviation-Mean Plot
Date of computationTue, 06 Jan 2009 03:33:01 -0700
Cite this page as followsStatistical Computations at FreeStatistics.org, Office for Research Development and Education, URL https://freestatistics.org/blog/index.php?v=date/2009/Jan/06/t1231238024a4ubpm7z450pd5j.htm/, Retrieved Sat, 04 May 2024 22:04:46 +0000
Statistical Computations at FreeStatistics.org, Office for Research Development and Education, URL https://freestatistics.org/blog/index.php?pk=36775, Retrieved Sat, 04 May 2024 22:04:46 +0000
QR Codes:

Original text written by user:
IsPrivate?No (this computation is public)
User-defined keywords
Estimated Impact246
Family? (F = Feedback message, R = changed R code, M = changed R Module, P = changed Parameters, D = changed Data)
-     [Harrell-Davis Quantiles] [Harrel davis deci...] [2008-10-18 16:19:32] [ea79f99c5895b39ae8bb6e8c563d0f54]
-   PD  [Harrell-Davis Quantiles] [Harrel davis deci...] [2008-10-18 17:17:36] [ea79f99c5895b39ae8bb6e8c563d0f54]
- RMPD    [(Partial) Autocorrelation Function] [OEF 2 deel 1 De L...] [2008-12-11 08:24:21] [ea79f99c5895b39ae8bb6e8c563d0f54]
- RMP       [Bootstrap Plot - Central Tendency] [Oef 2 opg. 7 De L...] [2008-12-18 22:45:41] [ea79f99c5895b39ae8bb6e8c563d0f54]
- RMP         [Blocked Bootstrap Plot - Central Tendency] [VERbetering Block...] [2009-01-04 16:07:05] [ea79f99c5895b39ae8bb6e8c563d0f54]
- RMP             [Standard Deviation-Mean Plot] [SDL OPG 8 OEF3 st...] [2009-01-06 10:33:01] [1eda150a0abaa7374d7583f55f7b1e6e] [Current]
Feedback Forum

Post a new message
Dataseries X:
102.9
102.9
102.9
102.9
104.2
104.7
104.7
104.7
104.7
104.7
104.7
104.7
104.7
104.7
104.7
104.7
106
107
107
107
107
107
107
107
107
107
107
107
107.6
109.9
109.9
109.9
109.9
109.9
109.9
109.9
109.9
109.9
109.9
109.9
110.6
114.3
114.3
114.3
114.3
114.3
114.3
114.3
114.3
114.3
114.3
114.3
114.3
119.01
119.01
119.01
119.01
119.01
119.01
119.01
119.01
119.01
119.01
119.01
121.27
123.54
123.54
123.54
123.54
123.54
123.54
123.54
123.54
123.54
123.54
123.54
123.54
125.24
125.24
125.24
125.24
125.24
125.24
125.24
125.24
125.24
125.24
125.24
125.24
128.35
128.35
128.35
128.35
128.35
128.35
128.35


Summary of computational transaction
Raw Inputview raw input (R code)
Raw Outputview raw output of R engine
Computing time1 seconds
R Server'Gwilym Jenkins' @ 72.249.127.135

\begin{tabular}{lllllllll}
\hline
Summary of computational transaction \tabularnewline
Raw Input & view raw input (R code)  \tabularnewline
Raw Output & view raw output of R engine  \tabularnewline
Computing time & 1 seconds \tabularnewline
R Server & 'Gwilym Jenkins' @ 72.249.127.135 \tabularnewline
\hline
\end{tabular}
%Source: https://freestatistics.org/blog/index.php?pk=36775&T=0

[TABLE]
[ROW][C]Summary of computational transaction[/C][/ROW]
[ROW][C]Raw Input[/C][C]view raw input (R code) [/C][/ROW]
[ROW][C]Raw Output[/C][C]view raw output of R engine [/C][/ROW]
[ROW][C]Computing time[/C][C]1 seconds[/C][/ROW]
[ROW][C]R Server[/C][C]'Gwilym Jenkins' @ 72.249.127.135[/C][/ROW]
[/TABLE]
Source: https://freestatistics.org/blog/index.php?pk=36775&T=0

Globally Unique Identifier (entire table): ba.freestatistics.org/blog/index.php?pk=36775&T=0

As an alternative you can also use a QR Code:  

The GUIDs for individual cells are displayed in the table below:

Summary of computational transaction
Raw Inputview raw input (R code)
Raw Outputview raw output of R engine
Computing time1 seconds
R Server'Gwilym Jenkins' @ 72.249.127.135


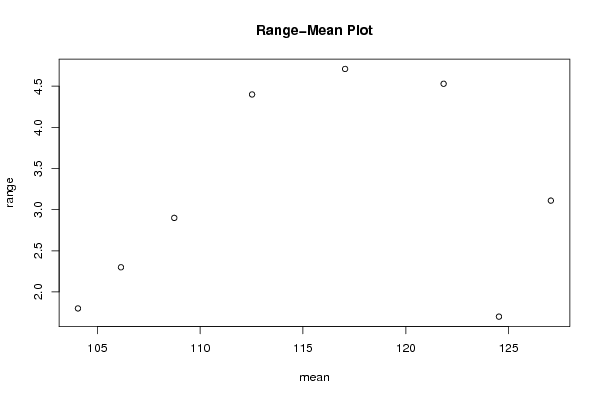
Standard Deviation-Mean Plot
SectionMeanStandard DeviationRange
1104.0583333333330.8670308092809751.80000000000000
2106.151.107413037833512.30000000000000
3108.7416666666671.440617502281162.90000000000001
4112.5252.201703885630404.39999999999999
5117.04752.425313944064304.71000000000001
6121.8408333333332.18653922623834.53
7124.5316666666670.8753787059255371.69999999999999
8127.0541666666671.60142810319323.11

\begin{tabular}{lllllllll}
\hline
Standard Deviation-Mean Plot \tabularnewline
Section & Mean & Standard Deviation & Range \tabularnewline
1 & 104.058333333333 & 0.867030809280975 & 1.80000000000000 \tabularnewline
2 & 106.15 & 1.10741303783351 & 2.30000000000000 \tabularnewline
3 & 108.741666666667 & 1.44061750228116 & 2.90000000000001 \tabularnewline
4 & 112.525 & 2.20170388563040 & 4.39999999999999 \tabularnewline
5 & 117.0475 & 2.42531394406430 & 4.71000000000001 \tabularnewline
6 & 121.840833333333 & 2.1865392262383 & 4.53 \tabularnewline
7 & 124.531666666667 & 0.875378705925537 & 1.69999999999999 \tabularnewline
8 & 127.054166666667 & 1.6014281031932 & 3.11 \tabularnewline
\hline
\end{tabular}
%Source: https://freestatistics.org/blog/index.php?pk=36775&T=1

[TABLE]
[ROW][C]Standard Deviation-Mean Plot[/C][/ROW]
[ROW][C]Section[/C][C]Mean[/C][C]Standard Deviation[/C][C]Range[/C][/ROW]
[ROW][C]1[/C][C]104.058333333333[/C][C]0.867030809280975[/C][C]1.80000000000000[/C][/ROW]
[ROW][C]2[/C][C]106.15[/C][C]1.10741303783351[/C][C]2.30000000000000[/C][/ROW]
[ROW][C]3[/C][C]108.741666666667[/C][C]1.44061750228116[/C][C]2.90000000000001[/C][/ROW]
[ROW][C]4[/C][C]112.525[/C][C]2.20170388563040[/C][C]4.39999999999999[/C][/ROW]
[ROW][C]5[/C][C]117.0475[/C][C]2.42531394406430[/C][C]4.71000000000001[/C][/ROW]
[ROW][C]6[/C][C]121.840833333333[/C][C]2.1865392262383[/C][C]4.53[/C][/ROW]
[ROW][C]7[/C][C]124.531666666667[/C][C]0.875378705925537[/C][C]1.69999999999999[/C][/ROW]
[ROW][C]8[/C][C]127.054166666667[/C][C]1.6014281031932[/C][C]3.11[/C][/ROW]
[/TABLE]
Source: https://freestatistics.org/blog/index.php?pk=36775&T=1

Globally Unique Identifier (entire table): ba.freestatistics.org/blog/index.php?pk=36775&T=1

As an alternative you can also use a QR Code:  

The GUIDs for individual cells are displayed in the table below:

Standard Deviation-Mean Plot
SectionMeanStandard DeviationRange
1104.0583333333330.8670308092809751.80000000000000
2106.151.107413037833512.30000000000000
3108.7416666666671.440617502281162.90000000000001
4112.5252.201703885630404.39999999999999
5117.04752.425313944064304.71000000000001
6121.8408333333332.18653922623834.53
7124.5316666666670.8753787059255371.69999999999999
8127.0541666666671.60142810319323.11


Regression: S.E.(k) = alpha + beta * Mean(k)
alpha-0.74346350090759
beta0.0202322794966549
S.D.0.0280357449331235
T-STAT0.721660135834344
p-value0.497649924318918

\begin{tabular}{lllllllll}
\hline
Regression: S.E.(k) = alpha + beta * Mean(k) \tabularnewline
alpha & -0.74346350090759 \tabularnewline
beta & 0.0202322794966549 \tabularnewline
S.D. & 0.0280357449331235 \tabularnewline
T-STAT & 0.721660135834344 \tabularnewline
p-value & 0.497649924318918 \tabularnewline
\hline
\end{tabular}
%Source: https://freestatistics.org/blog/index.php?pk=36775&T=2

[TABLE]
[ROW][C]Regression: S.E.(k) = alpha + beta * Mean(k)[/C][/ROW]
[ROW][C]alpha[/C][C]-0.74346350090759[/C][/ROW]
[ROW][C]beta[/C][C]0.0202322794966549[/C][/ROW]
[ROW][C]S.D.[/C][C]0.0280357449331235[/C][/ROW]
[ROW][C]T-STAT[/C][C]0.721660135834344[/C][/ROW]
[ROW][C]p-value[/C][C]0.497649924318918[/C][/ROW]
[/TABLE]
Source: https://freestatistics.org/blog/index.php?pk=36775&T=2

Globally Unique Identifier (entire table): ba.freestatistics.org/blog/index.php?pk=36775&T=2

As an alternative you can also use a QR Code:  

The GUIDs for individual cells are displayed in the table below:

Regression: S.E.(k) = alpha + beta * Mean(k)
alpha-0.74346350090759
beta0.0202322794966549
S.D.0.0280357449331235
T-STAT0.721660135834344
p-value0.497649924318918


Regression: ln S.E.(k) = alpha + beta * ln Mean(k)
alpha-7.55255215033036
beta1.67402873116968
S.D.2.13745077019029
T-STAT0.783189374237912
p-value0.46329934914606
Lambda-0.674028731169676

\begin{tabular}{lllllllll}
\hline
Regression: ln S.E.(k) = alpha + beta * ln Mean(k) \tabularnewline
alpha & -7.55255215033036 \tabularnewline
beta & 1.67402873116968 \tabularnewline
S.D. & 2.13745077019029 \tabularnewline
T-STAT & 0.783189374237912 \tabularnewline
p-value & 0.46329934914606 \tabularnewline
Lambda & -0.674028731169676 \tabularnewline
\hline
\end{tabular}
%Source: https://freestatistics.org/blog/index.php?pk=36775&T=3

[TABLE]
[ROW][C]Regression: ln S.E.(k) = alpha + beta * ln Mean(k)[/C][/ROW]
[ROW][C]alpha[/C][C]-7.55255215033036[/C][/ROW]
[ROW][C]beta[/C][C]1.67402873116968[/C][/ROW]
[ROW][C]S.D.[/C][C]2.13745077019029[/C][/ROW]
[ROW][C]T-STAT[/C][C]0.783189374237912[/C][/ROW]
[ROW][C]p-value[/C][C]0.46329934914606[/C][/ROW]
[ROW][C]Lambda[/C][C]-0.674028731169676[/C][/ROW]
[/TABLE]
Source: https://freestatistics.org/blog/index.php?pk=36775&T=3

Globally Unique Identifier (entire table): ba.freestatistics.org/blog/index.php?pk=36775&T=3

As an alternative you can also use a QR Code:  

The GUIDs for individual cells are displayed in the table below:

Regression: ln S.E.(k) = alpha + beta * ln Mean(k)
alpha-7.55255215033036
beta1.67402873116968
S.D.2.13745077019029
T-STAT0.783189374237912
p-value0.46329934914606
Lambda-0.674028731169676


Parameters (Session):
par1 = 12 ;
Parameters (R input):
par1 = 12 ;
R code (references can be found in the software module):
par1 <- as.numeric(par1)
(n <- length(x))
(np <- floor(n / par1))
arr <- array(NA,dim=c(par1,np))
j <- 0
k <- 1
for (i in 1:(np*par1))
{
j = j + 1
arr[j,k] <- x[i]
if (j == par1) {
j = 0
k=k+1
}
}
arr
arr.mean <- array(NA,dim=np)
arr.sd <- array(NA,dim=np)
arr.range <- array(NA,dim=np)
for (j in 1:np)
{
arr.mean[j] <- mean(arr[,j],na.rm=TRUE)
arr.sd[j] <- sd(arr[,j],na.rm=TRUE)
arr.range[j] <- max(arr[,j],na.rm=TRUE) - min(arr[,j],na.rm=TRUE)
}
arr.mean
arr.sd
arr.range
(lm1 <- lm(arr.sd~arr.mean))
(lnlm1 <- lm(log(arr.sd)~log(arr.mean)))
(lm2 <- lm(arr.range~arr.mean))
bitmap(file='test1.png')
plot(arr.mean,arr.sd,main='Standard Deviation-Mean Plot',xlab='mean',ylab='standard deviation')
dev.off()
bitmap(file='test2.png')
plot(arr.mean,arr.range,main='Range-Mean Plot',xlab='mean',ylab='range')
dev.off()
load(file='createtable')
a<-table.start()
a<-table.row.start(a)
a<-table.element(a,'Standard Deviation-Mean Plot',4,TRUE)
a<-table.row.end(a)
a<-table.row.start(a)
a<-table.element(a,'Section',header=TRUE)
a<-table.element(a,'Mean',header=TRUE)
a<-table.element(a,'Standard Deviation',header=TRUE)
a<-table.element(a,'Range',header=TRUE)
a<-table.row.end(a)
for (j in 1:np) {
a<-table.row.start(a)
a<-table.element(a,j,header=TRUE)
a<-table.element(a,arr.mean[j])
a<-table.element(a,arr.sd[j] )
a<-table.element(a,arr.range[j] )
a<-table.row.end(a)
}
a<-table.end(a)
table.save(a,file='mytable.tab')
a<-table.start()
a<-table.row.start(a)
a<-table.element(a,'Regression: S.E.(k) = alpha + beta * Mean(k)',2,TRUE)
a<-table.row.end(a)
a<-table.row.start(a)
a<-table.element(a,'alpha',header=TRUE)
a<-table.element(a,lm1$coefficients[[1]])
a<-table.row.end(a)
a<-table.row.start(a)
a<-table.element(a,'beta',header=TRUE)
a<-table.element(a,lm1$coefficients[[2]])
a<-table.row.end(a)
a<-table.row.start(a)
a<-table.element(a,'S.D.',header=TRUE)
a<-table.element(a,summary(lm1)$coefficients[2,2])
a<-table.row.end(a)
a<-table.row.start(a)
a<-table.element(a,'T-STAT',header=TRUE)
a<-table.element(a,summary(lm1)$coefficients[2,3])
a<-table.row.end(a)
a<-table.row.start(a)
a<-table.element(a,'p-value',header=TRUE)
a<-table.element(a,summary(lm1)$coefficients[2,4])
a<-table.row.end(a)
a<-table.end(a)
table.save(a,file='mytable1.tab')
a<-table.start()
a<-table.row.start(a)
a<-table.element(a,'Regression: ln S.E.(k) = alpha + beta * ln Mean(k)',2,TRUE)
a<-table.row.end(a)
a<-table.row.start(a)
a<-table.element(a,'alpha',header=TRUE)
a<-table.element(a,lnlm1$coefficients[[1]])
a<-table.row.end(a)
a<-table.row.start(a)
a<-table.element(a,'beta',header=TRUE)
a<-table.element(a,lnlm1$coefficients[[2]])
a<-table.row.end(a)
a<-table.row.start(a)
a<-table.element(a,'S.D.',header=TRUE)
a<-table.element(a,summary(lnlm1)$coefficients[2,2])
a<-table.row.end(a)
a<-table.row.start(a)
a<-table.element(a,'T-STAT',header=TRUE)
a<-table.element(a,summary(lnlm1)$coefficients[2,3])
a<-table.row.end(a)
a<-table.row.start(a)
a<-table.element(a,'p-value',header=TRUE)
a<-table.element(a,summary(lnlm1)$coefficients[2,4])
a<-table.row.end(a)
a<-table.row.start(a)
a<-table.element(a,'Lambda',header=TRUE)
a<-table.element(a,1-lnlm1$coefficients[[2]])
a<-table.row.end(a)
a<-table.end(a)
table.save(a,file='mytable2.tab')