Free Statistics

of Irreproducible Research!

Author's title

Author*Unverified author*
R Software Modulerwasp_arimabackwardselection.wasp
Title produced by softwareARIMA Backward Selection
Date of computationMon, 22 Dec 2008 15:26:11 -0700
Cite this page as followsStatistical Computations at FreeStatistics.org, Office for Research Development and Education, URL https://freestatistics.org/blog/index.php?v=date/2008/Dec/22/t12299848466ipj9cg54szefkj.htm/, Retrieved Sun, 12 May 2024 17:24:20 +0000
Statistical Computations at FreeStatistics.org, Office for Research Development and Education, URL https://freestatistics.org/blog/index.php?pk=36244, Retrieved Sun, 12 May 2024 17:24:20 +0000
QR Codes:

Original text written by user:
IsPrivate?No (this computation is public)
User-defined keywords
Estimated Impact208
Family? (F = Feedback message, R = changed R code, M = changed R Module, P = changed Parameters, D = changed Data)
F     [Variance Reduction Matrix] [Q2 VRM] [2008-12-07 13:38:56] [74be16979710d4c4e7c6647856088456]
F RMP   [(Partial) Autocorrelation Function] [Q2 ACF 00] [2008-12-07 13:48:21] [74be16979710d4c4e7c6647856088456]
F   P     [(Partial) Autocorrelation Function] [Q2 ACF 10] [2008-12-07 14:03:41] [74be16979710d4c4e7c6647856088456]
F   P       [(Partial) Autocorrelation Function] [Q2 ACF 11] [2008-12-07 14:10:14] [74be16979710d4c4e7c6647856088456]
- R PD        [(Partial) Autocorrelation Function] [] [2008-12-21 21:47:34] [74be16979710d4c4e7c6647856088456]
F   P           [(Partial) Autocorrelation Function] [] [2008-12-21 22:15:42] [74be16979710d4c4e7c6647856088456]
F RMP               [ARIMA Backward Selection] [] [2008-12-22 22:26:11] [d41d8cd98f00b204e9800998ecf8427e] [Current]
Feedback Forum
2009-01-08 13:10:24 [Aurélie Van Impe] [reply
Je verwijst naar je bespreking van de werkloosheid, maar die was daar al zo kort, je had ze echt wat kunnen uitbreiden. Ook ik verwijs naar mijn uitleg bij dit onderdeel voor de werkloosheid. Je bent in je formule echter wel een nabla vergeten aan de linkerzijde van de gelijkheid. Voor de rest is je formule in orde.

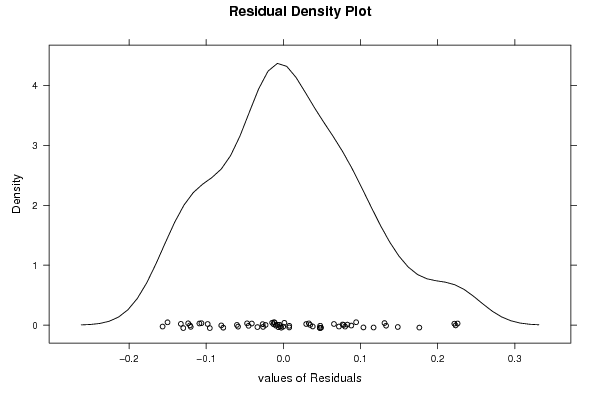
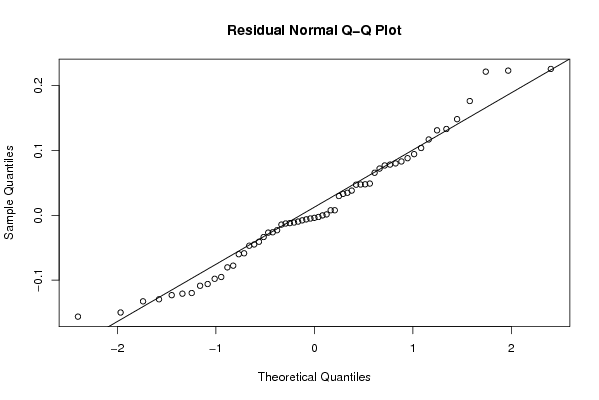
Assumpties: dit histogram is al meer normaal verdeeld, hoewel ik het nog niet genoeg vind om aan de assumptie te voldoen, maar het kan er nog mee door. Bij de density plot had je kunnen opmerken dat er aan de rechterkant enkele outliers zijn, waardoor je verdeling wat rechtsscheef wordt, maar dit is niet zo erg. Deze q-q plot is al veel beter dan die van je model bij de werkloosheid. Opnieuw wil ik vermelden dat je vergeten bent om de assumptie betreffende de spreiding en het gemiddelde van de residu’s na te gaan.

Post a new message
Dataseries X:
1.8
1.7
1.4
1.2
1
1.7
2.4
2
2.1
2
1.8
2.7
2.3
1.9
2
2.3
2.8
2.4
2.3
2.7
2.7
2.9
3
2.2
2.3
2.8
2.8
2.8
2.2
2.6
2.8
2.5
2.4
2.3
1.9
1.7
2
2.1
1.7
1.8
1.8
1.8
1.3
1.3
1.3
1.2
1.4
2.2
2.9
3.1
3.5
3.6
4.4
4.1
5.1
5.8
5.9
5.4
5.5
4.8
3.2


Summary of computational transaction
Raw Inputview raw input (R code)
Raw Outputview raw output of R engine
Computing time6 seconds
R Server'Gwilym Jenkins' @ 72.249.127.135

\begin{tabular}{lllllllll}
\hline
Summary of computational transaction \tabularnewline
Raw Input & view raw input (R code)  \tabularnewline
Raw Output & view raw output of R engine  \tabularnewline
Computing time & 6 seconds \tabularnewline
R Server & 'Gwilym Jenkins' @ 72.249.127.135 \tabularnewline
\hline
\end{tabular}
%Source: https://freestatistics.org/blog/index.php?pk=36244&T=0

[TABLE]
[ROW][C]Summary of computational transaction[/C][/ROW]
[ROW][C]Raw Input[/C][C]view raw input (R code) [/C][/ROW]
[ROW][C]Raw Output[/C][C]view raw output of R engine [/C][/ROW]
[ROW][C]Computing time[/C][C]6 seconds[/C][/ROW]
[ROW][C]R Server[/C][C]'Gwilym Jenkins' @ 72.249.127.135[/C][/ROW]
[/TABLE]
Source: https://freestatistics.org/blog/index.php?pk=36244&T=0

Globally Unique Identifier (entire table): ba.freestatistics.org/blog/index.php?pk=36244&T=0

As an alternative you can also use a QR Code:  

The GUIDs for individual cells are displayed in the table below:

Summary of computational transaction
Raw Inputview raw input (R code)
Raw Outputview raw output of R engine
Computing time6 seconds
R Server'Gwilym Jenkins' @ 72.249.127.135


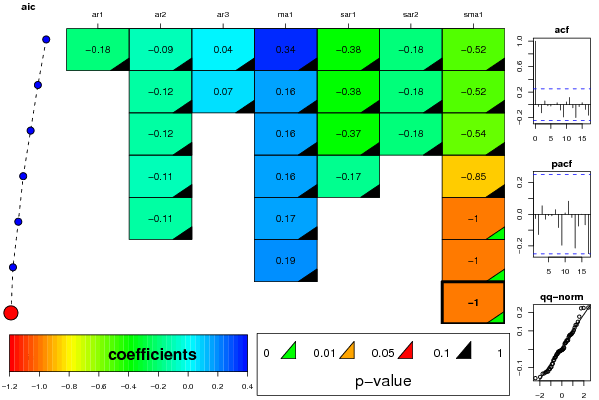
ARIMA Parameter Estimation and Backward Selection
Iterationar1ar2ar3ma1sar1sar2sma1
Estimates ( 1 )-0.1842-0.09130.04240.3408-0.3772-0.1807-0.5227
(p-val)(0.9005 )(0.7208 )(0.8729 )(0.8169 )(0.4159 )(0.5951 )(0.3534 )
Estimates ( 2 )0-0.11780.06810.1573-0.3835-0.182-0.517
(p-val)(NA )(0.3788 )(0.6056 )(0.2345 )(0.399 )(0.5889 )(0.3493 )
Estimates ( 3 )0-0.116200.1578-0.3746-0.1789-0.5435
(p-val)(NA )(0.385 )(NA )(0.2398 )(0.4012 )(0.5919 )(0.3271 )
Estimates ( 4 )0-0.111100.1619-0.17280-0.851
(p-val)(NA )(0.405 )(NA )(0.2281 )(0.4584 )(NA )(0.1737 )
Estimates ( 5 )0-0.112600.172600-1
(p-val)(NA )(0.3947 )(NA )(0.2032 )(NA )(NA )(0.0054 )
Estimates ( 6 )0000.187500-1
(p-val)(NA )(NA )(NA )(0.2189 )(NA )(NA )(0.0028 )
Estimates ( 7 )000000-1
(p-val)(NA )(NA )(NA )(NA )(NA )(NA )(0.0037 )
Estimates ( 8 )NANANANANANANA
(p-val)(NA )(NA )(NA )(NA )(NA )(NA )(NA )
Estimates ( 9 )NANANANANANANA
(p-val)(NA )(NA )(NA )(NA )(NA )(NA )(NA )
Estimates ( 10 )NANANANANANANA
(p-val)(NA )(NA )(NA )(NA )(NA )(NA )(NA )
Estimates ( 11 )NANANANANANANA
(p-val)(NA )(NA )(NA )(NA )(NA )(NA )(NA )
Estimates ( 12 )NANANANANANANA
(p-val)(NA )(NA )(NA )(NA )(NA )(NA )(NA )
Estimates ( 13 )NANANANANANANA
(p-val)(NA )(NA )(NA )(NA )(NA )(NA )(NA )

\begin{tabular}{lllllllll}
\hline
ARIMA Parameter Estimation and Backward Selection \tabularnewline
Iteration & ar1 & ar2 & ar3 & ma1 & sar1 & sar2 & sma1 \tabularnewline
Estimates ( 1 ) & -0.1842 & -0.0913 & 0.0424 & 0.3408 & -0.3772 & -0.1807 & -0.5227 \tabularnewline
(p-val) & (0.9005 ) & (0.7208 ) & (0.8729 ) & (0.8169 ) & (0.4159 ) & (0.5951 ) & (0.3534 ) \tabularnewline
Estimates ( 2 ) & 0 & -0.1178 & 0.0681 & 0.1573 & -0.3835 & -0.182 & -0.517 \tabularnewline
(p-val) & (NA ) & (0.3788 ) & (0.6056 ) & (0.2345 ) & (0.399 ) & (0.5889 ) & (0.3493 ) \tabularnewline
Estimates ( 3 ) & 0 & -0.1162 & 0 & 0.1578 & -0.3746 & -0.1789 & -0.5435 \tabularnewline
(p-val) & (NA ) & (0.385 ) & (NA ) & (0.2398 ) & (0.4012 ) & (0.5919 ) & (0.3271 ) \tabularnewline
Estimates ( 4 ) & 0 & -0.1111 & 0 & 0.1619 & -0.1728 & 0 & -0.851 \tabularnewline
(p-val) & (NA ) & (0.405 ) & (NA ) & (0.2281 ) & (0.4584 ) & (NA ) & (0.1737 ) \tabularnewline
Estimates ( 5 ) & 0 & -0.1126 & 0 & 0.1726 & 0 & 0 & -1 \tabularnewline
(p-val) & (NA ) & (0.3947 ) & (NA ) & (0.2032 ) & (NA ) & (NA ) & (0.0054 ) \tabularnewline
Estimates ( 6 ) & 0 & 0 & 0 & 0.1875 & 0 & 0 & -1 \tabularnewline
(p-val) & (NA ) & (NA ) & (NA ) & (0.2189 ) & (NA ) & (NA ) & (0.0028 ) \tabularnewline
Estimates ( 7 ) & 0 & 0 & 0 & 0 & 0 & 0 & -1 \tabularnewline
(p-val) & (NA ) & (NA ) & (NA ) & (NA ) & (NA ) & (NA ) & (0.0037 ) \tabularnewline
Estimates ( 8 ) & NA & NA & NA & NA & NA & NA & NA \tabularnewline
(p-val) & (NA ) & (NA ) & (NA ) & (NA ) & (NA ) & (NA ) & (NA ) \tabularnewline
Estimates ( 9 ) & NA & NA & NA & NA & NA & NA & NA \tabularnewline
(p-val) & (NA ) & (NA ) & (NA ) & (NA ) & (NA ) & (NA ) & (NA ) \tabularnewline
Estimates ( 10 ) & NA & NA & NA & NA & NA & NA & NA \tabularnewline
(p-val) & (NA ) & (NA ) & (NA ) & (NA ) & (NA ) & (NA ) & (NA ) \tabularnewline
Estimates ( 11 ) & NA & NA & NA & NA & NA & NA & NA \tabularnewline
(p-val) & (NA ) & (NA ) & (NA ) & (NA ) & (NA ) & (NA ) & (NA ) \tabularnewline
Estimates ( 12 ) & NA & NA & NA & NA & NA & NA & NA \tabularnewline
(p-val) & (NA ) & (NA ) & (NA ) & (NA ) & (NA ) & (NA ) & (NA ) \tabularnewline
Estimates ( 13 ) & NA & NA & NA & NA & NA & NA & NA \tabularnewline
(p-val) & (NA ) & (NA ) & (NA ) & (NA ) & (NA ) & (NA ) & (NA ) \tabularnewline
\hline
\end{tabular}
%Source: https://freestatistics.org/blog/index.php?pk=36244&T=1

[TABLE]
[ROW][C]ARIMA Parameter Estimation and Backward Selection[/C][/ROW]
[ROW][C]Iteration[/C][C]ar1[/C][C]ar2[/C][C]ar3[/C][C]ma1[/C][C]sar1[/C][C]sar2[/C][C]sma1[/C][/ROW]
[ROW][C]Estimates ( 1 )[/C][C]-0.1842[/C][C]-0.0913[/C][C]0.0424[/C][C]0.3408[/C][C]-0.3772[/C][C]-0.1807[/C][C]-0.5227[/C][/ROW]
[ROW][C](p-val)[/C][C](0.9005 )[/C][C](0.7208 )[/C][C](0.8729 )[/C][C](0.8169 )[/C][C](0.4159 )[/C][C](0.5951 )[/C][C](0.3534 )[/C][/ROW]
[ROW][C]Estimates ( 2 )[/C][C]0[/C][C]-0.1178[/C][C]0.0681[/C][C]0.1573[/C][C]-0.3835[/C][C]-0.182[/C][C]-0.517[/C][/ROW]
[ROW][C](p-val)[/C][C](NA )[/C][C](0.3788 )[/C][C](0.6056 )[/C][C](0.2345 )[/C][C](0.399 )[/C][C](0.5889 )[/C][C](0.3493 )[/C][/ROW]
[ROW][C]Estimates ( 3 )[/C][C]0[/C][C]-0.1162[/C][C]0[/C][C]0.1578[/C][C]-0.3746[/C][C]-0.1789[/C][C]-0.5435[/C][/ROW]
[ROW][C](p-val)[/C][C](NA )[/C][C](0.385 )[/C][C](NA )[/C][C](0.2398 )[/C][C](0.4012 )[/C][C](0.5919 )[/C][C](0.3271 )[/C][/ROW]
[ROW][C]Estimates ( 4 )[/C][C]0[/C][C]-0.1111[/C][C]0[/C][C]0.1619[/C][C]-0.1728[/C][C]0[/C][C]-0.851[/C][/ROW]
[ROW][C](p-val)[/C][C](NA )[/C][C](0.405 )[/C][C](NA )[/C][C](0.2281 )[/C][C](0.4584 )[/C][C](NA )[/C][C](0.1737 )[/C][/ROW]
[ROW][C]Estimates ( 5 )[/C][C]0[/C][C]-0.1126[/C][C]0[/C][C]0.1726[/C][C]0[/C][C]0[/C][C]-1[/C][/ROW]
[ROW][C](p-val)[/C][C](NA )[/C][C](0.3947 )[/C][C](NA )[/C][C](0.2032 )[/C][C](NA )[/C][C](NA )[/C][C](0.0054 )[/C][/ROW]
[ROW][C]Estimates ( 6 )[/C][C]0[/C][C]0[/C][C]0[/C][C]0.1875[/C][C]0[/C][C]0[/C][C]-1[/C][/ROW]
[ROW][C](p-val)[/C][C](NA )[/C][C](NA )[/C][C](NA )[/C][C](0.2189 )[/C][C](NA )[/C][C](NA )[/C][C](0.0028 )[/C][/ROW]
[ROW][C]Estimates ( 7 )[/C][C]0[/C][C]0[/C][C]0[/C][C]0[/C][C]0[/C][C]0[/C][C]-1[/C][/ROW]
[ROW][C](p-val)[/C][C](NA )[/C][C](NA )[/C][C](NA )[/C][C](NA )[/C][C](NA )[/C][C](NA )[/C][C](0.0037 )[/C][/ROW]
[ROW][C]Estimates ( 8 )[/C][C]NA[/C][C]NA[/C][C]NA[/C][C]NA[/C][C]NA[/C][C]NA[/C][C]NA[/C][/ROW]
[ROW][C](p-val)[/C][C](NA )[/C][C](NA )[/C][C](NA )[/C][C](NA )[/C][C](NA )[/C][C](NA )[/C][C](NA )[/C][/ROW]
[ROW][C]Estimates ( 9 )[/C][C]NA[/C][C]NA[/C][C]NA[/C][C]NA[/C][C]NA[/C][C]NA[/C][C]NA[/C][/ROW]
[ROW][C](p-val)[/C][C](NA )[/C][C](NA )[/C][C](NA )[/C][C](NA )[/C][C](NA )[/C][C](NA )[/C][C](NA )[/C][/ROW]
[ROW][C]Estimates ( 10 )[/C][C]NA[/C][C]NA[/C][C]NA[/C][C]NA[/C][C]NA[/C][C]NA[/C][C]NA[/C][/ROW]
[ROW][C](p-val)[/C][C](NA )[/C][C](NA )[/C][C](NA )[/C][C](NA )[/C][C](NA )[/C][C](NA )[/C][C](NA )[/C][/ROW]
[ROW][C]Estimates ( 11 )[/C][C]NA[/C][C]NA[/C][C]NA[/C][C]NA[/C][C]NA[/C][C]NA[/C][C]NA[/C][/ROW]
[ROW][C](p-val)[/C][C](NA )[/C][C](NA )[/C][C](NA )[/C][C](NA )[/C][C](NA )[/C][C](NA )[/C][C](NA )[/C][/ROW]
[ROW][C]Estimates ( 12 )[/C][C]NA[/C][C]NA[/C][C]NA[/C][C]NA[/C][C]NA[/C][C]NA[/C][C]NA[/C][/ROW]
[ROW][C](p-val)[/C][C](NA )[/C][C](NA )[/C][C](NA )[/C][C](NA )[/C][C](NA )[/C][C](NA )[/C][C](NA )[/C][/ROW]
[ROW][C]Estimates ( 13 )[/C][C]NA[/C][C]NA[/C][C]NA[/C][C]NA[/C][C]NA[/C][C]NA[/C][C]NA[/C][/ROW]
[ROW][C](p-val)[/C][C](NA )[/C][C](NA )[/C][C](NA )[/C][C](NA )[/C][C](NA )[/C][C](NA )[/C][C](NA )[/C][/ROW]
[/TABLE]
Source: https://freestatistics.org/blog/index.php?pk=36244&T=1

Globally Unique Identifier (entire table): ba.freestatistics.org/blog/index.php?pk=36244&T=1

As an alternative you can also use a QR Code:  

The GUIDs for individual cells are displayed in the table below:

ARIMA Parameter Estimation and Backward Selection
Iterationar1ar2ar3ma1sar1sar2sma1
Estimates ( 1 )-0.1842-0.09130.04240.3408-0.3772-0.1807-0.5227
(p-val)(0.9005 )(0.7208 )(0.8729 )(0.8169 )(0.4159 )(0.5951 )(0.3534 )
Estimates ( 2 )0-0.11780.06810.1573-0.3835-0.182-0.517
(p-val)(NA )(0.3788 )(0.6056 )(0.2345 )(0.399 )(0.5889 )(0.3493 )
Estimates ( 3 )0-0.116200.1578-0.3746-0.1789-0.5435
(p-val)(NA )(0.385 )(NA )(0.2398 )(0.4012 )(0.5919 )(0.3271 )
Estimates ( 4 )0-0.111100.1619-0.17280-0.851
(p-val)(NA )(0.405 )(NA )(0.2281 )(0.4584 )(NA )(0.1737 )
Estimates ( 5 )0-0.112600.172600-1
(p-val)(NA )(0.3947 )(NA )(0.2032 )(NA )(NA )(0.0054 )
Estimates ( 6 )0000.187500-1
(p-val)(NA )(NA )(NA )(0.2189 )(NA )(NA )(0.0028 )
Estimates ( 7 )000000-1
(p-val)(NA )(NA )(NA )(NA )(NA )(NA )(0.0037 )
Estimates ( 8 )NANANANANANANA
(p-val)(NA )(NA )(NA )(NA )(NA )(NA )(NA )
Estimates ( 9 )NANANANANANANA
(p-val)(NA )(NA )(NA )(NA )(NA )(NA )(NA )
Estimates ( 10 )NANANANANANANA
(p-val)(NA )(NA )(NA )(NA )(NA )(NA )(NA )
Estimates ( 11 )NANANANANANANA
(p-val)(NA )(NA )(NA )(NA )(NA )(NA )(NA )
Estimates ( 12 )NANANANANANANA
(p-val)(NA )(NA )(NA )(NA )(NA )(NA )(NA )
Estimates ( 13 )NANANANANANANA
(p-val)(NA )(NA )(NA )(NA )(NA )(NA )(NA )


Estimated ARIMA Residuals
Value
0.00134163939770439
-0.0262714926344907
-0.0804048459847533
-0.0469932884476756
-0.0586778283336189
0.22585392244873
0.131136943638902
-0.120038798012752
0.0472067668161661
-0.0335482311689906
-0.0450257546798471
0.221657903677153
-0.132816783826791
-0.106129300853141
-0.000188951299446646
0.047781195065223
0.0800567078923315
0.0076801342517474
0.0720926360423431
0.0347377564330326
0.00774331525559909
0.033093282351647
-0.0120639219100162
-0.0777938794406635
-0.0144217022642738
0.0475259826097994
-0.0230417114320725
0.0380822776909451
-0.108813038263377
0.148354843285741
0.0768881414143003
-0.060127976285548
-0.00630797560272213
-0.00263824699880338
-0.123307421800856
-0.098059220372405
0.0943631332683751
0.0489361769452
-0.1500793951643
0.088105462314436
-0.0952770695712777
0.116976334655544
-0.121027135122396
-0.0127090763410072
-0.0112371607953537
-0.0408609440237943
-0.00972850402357434
0.176308051376793
0.223262406628309
0.0656197558640164
-0.0268046405201399
0.0782109193550178
0.103835389826193
-0.00498305495842891
0.133160027645636
0.0830519774161298
-0.00782462208450461
-0.129652479215133
0.0296663129366979
-0.00397168441262917
-0.156485586314766

\begin{tabular}{lllllllll}
\hline
Estimated ARIMA Residuals \tabularnewline
Value \tabularnewline
0.00134163939770439 \tabularnewline
-0.0262714926344907 \tabularnewline
-0.0804048459847533 \tabularnewline
-0.0469932884476756 \tabularnewline
-0.0586778283336189 \tabularnewline
0.22585392244873 \tabularnewline
0.131136943638902 \tabularnewline
-0.120038798012752 \tabularnewline
0.0472067668161661 \tabularnewline
-0.0335482311689906 \tabularnewline
-0.0450257546798471 \tabularnewline
0.221657903677153 \tabularnewline
-0.132816783826791 \tabularnewline
-0.106129300853141 \tabularnewline
-0.000188951299446646 \tabularnewline
0.047781195065223 \tabularnewline
0.0800567078923315 \tabularnewline
0.0076801342517474 \tabularnewline
0.0720926360423431 \tabularnewline
0.0347377564330326 \tabularnewline
0.00774331525559909 \tabularnewline
0.033093282351647 \tabularnewline
-0.0120639219100162 \tabularnewline
-0.0777938794406635 \tabularnewline
-0.0144217022642738 \tabularnewline
0.0475259826097994 \tabularnewline
-0.0230417114320725 \tabularnewline
0.0380822776909451 \tabularnewline
-0.108813038263377 \tabularnewline
0.148354843285741 \tabularnewline
0.0768881414143003 \tabularnewline
-0.060127976285548 \tabularnewline
-0.00630797560272213 \tabularnewline
-0.00263824699880338 \tabularnewline
-0.123307421800856 \tabularnewline
-0.098059220372405 \tabularnewline
0.0943631332683751 \tabularnewline
0.0489361769452 \tabularnewline
-0.1500793951643 \tabularnewline
0.088105462314436 \tabularnewline
-0.0952770695712777 \tabularnewline
0.116976334655544 \tabularnewline
-0.121027135122396 \tabularnewline
-0.0127090763410072 \tabularnewline
-0.0112371607953537 \tabularnewline
-0.0408609440237943 \tabularnewline
-0.00972850402357434 \tabularnewline
0.176308051376793 \tabularnewline
0.223262406628309 \tabularnewline
0.0656197558640164 \tabularnewline
-0.0268046405201399 \tabularnewline
0.0782109193550178 \tabularnewline
0.103835389826193 \tabularnewline
-0.00498305495842891 \tabularnewline
0.133160027645636 \tabularnewline
0.0830519774161298 \tabularnewline
-0.00782462208450461 \tabularnewline
-0.129652479215133 \tabularnewline
0.0296663129366979 \tabularnewline
-0.00397168441262917 \tabularnewline
-0.156485586314766 \tabularnewline
\hline
\end{tabular}
%Source: https://freestatistics.org/blog/index.php?pk=36244&T=2

[TABLE]
[ROW][C]Estimated ARIMA Residuals[/C][/ROW]
[ROW][C]Value[/C][/ROW]
[ROW][C]0.00134163939770439[/C][/ROW]
[ROW][C]-0.0262714926344907[/C][/ROW]
[ROW][C]-0.0804048459847533[/C][/ROW]
[ROW][C]-0.0469932884476756[/C][/ROW]
[ROW][C]-0.0586778283336189[/C][/ROW]
[ROW][C]0.22585392244873[/C][/ROW]
[ROW][C]0.131136943638902[/C][/ROW]
[ROW][C]-0.120038798012752[/C][/ROW]
[ROW][C]0.0472067668161661[/C][/ROW]
[ROW][C]-0.0335482311689906[/C][/ROW]
[ROW][C]-0.0450257546798471[/C][/ROW]
[ROW][C]0.221657903677153[/C][/ROW]
[ROW][C]-0.132816783826791[/C][/ROW]
[ROW][C]-0.106129300853141[/C][/ROW]
[ROW][C]-0.000188951299446646[/C][/ROW]
[ROW][C]0.047781195065223[/C][/ROW]
[ROW][C]0.0800567078923315[/C][/ROW]
[ROW][C]0.0076801342517474[/C][/ROW]
[ROW][C]0.0720926360423431[/C][/ROW]
[ROW][C]0.0347377564330326[/C][/ROW]
[ROW][C]0.00774331525559909[/C][/ROW]
[ROW][C]0.033093282351647[/C][/ROW]
[ROW][C]-0.0120639219100162[/C][/ROW]
[ROW][C]-0.0777938794406635[/C][/ROW]
[ROW][C]-0.0144217022642738[/C][/ROW]
[ROW][C]0.0475259826097994[/C][/ROW]
[ROW][C]-0.0230417114320725[/C][/ROW]
[ROW][C]0.0380822776909451[/C][/ROW]
[ROW][C]-0.108813038263377[/C][/ROW]
[ROW][C]0.148354843285741[/C][/ROW]
[ROW][C]0.0768881414143003[/C][/ROW]
[ROW][C]-0.060127976285548[/C][/ROW]
[ROW][C]-0.00630797560272213[/C][/ROW]
[ROW][C]-0.00263824699880338[/C][/ROW]
[ROW][C]-0.123307421800856[/C][/ROW]
[ROW][C]-0.098059220372405[/C][/ROW]
[ROW][C]0.0943631332683751[/C][/ROW]
[ROW][C]0.0489361769452[/C][/ROW]
[ROW][C]-0.1500793951643[/C][/ROW]
[ROW][C]0.088105462314436[/C][/ROW]
[ROW][C]-0.0952770695712777[/C][/ROW]
[ROW][C]0.116976334655544[/C][/ROW]
[ROW][C]-0.121027135122396[/C][/ROW]
[ROW][C]-0.0127090763410072[/C][/ROW]
[ROW][C]-0.0112371607953537[/C][/ROW]
[ROW][C]-0.0408609440237943[/C][/ROW]
[ROW][C]-0.00972850402357434[/C][/ROW]
[ROW][C]0.176308051376793[/C][/ROW]
[ROW][C]0.223262406628309[/C][/ROW]
[ROW][C]0.0656197558640164[/C][/ROW]
[ROW][C]-0.0268046405201399[/C][/ROW]
[ROW][C]0.0782109193550178[/C][/ROW]
[ROW][C]0.103835389826193[/C][/ROW]
[ROW][C]-0.00498305495842891[/C][/ROW]
[ROW][C]0.133160027645636[/C][/ROW]
[ROW][C]0.0830519774161298[/C][/ROW]
[ROW][C]-0.00782462208450461[/C][/ROW]
[ROW][C]-0.129652479215133[/C][/ROW]
[ROW][C]0.0296663129366979[/C][/ROW]
[ROW][C]-0.00397168441262917[/C][/ROW]
[ROW][C]-0.156485586314766[/C][/ROW]
[/TABLE]
Source: https://freestatistics.org/blog/index.php?pk=36244&T=2

Globally Unique Identifier (entire table): ba.freestatistics.org/blog/index.php?pk=36244&T=2

As an alternative you can also use a QR Code:  

The GUIDs for individual cells are displayed in the table below:

Estimated ARIMA Residuals
Value
0.00134163939770439
-0.0262714926344907
-0.0804048459847533
-0.0469932884476756
-0.0586778283336189
0.22585392244873
0.131136943638902
-0.120038798012752
0.0472067668161661
-0.0335482311689906
-0.0450257546798471
0.221657903677153
-0.132816783826791
-0.106129300853141
-0.000188951299446646
0.047781195065223
0.0800567078923315
0.0076801342517474
0.0720926360423431
0.0347377564330326
0.00774331525559909
0.033093282351647
-0.0120639219100162
-0.0777938794406635
-0.0144217022642738
0.0475259826097994
-0.0230417114320725
0.0380822776909451
-0.108813038263377
0.148354843285741
0.0768881414143003
-0.060127976285548
-0.00630797560272213
-0.00263824699880338
-0.123307421800856
-0.098059220372405
0.0943631332683751
0.0489361769452
-0.1500793951643
0.088105462314436
-0.0952770695712777
0.116976334655544
-0.121027135122396
-0.0127090763410072
-0.0112371607953537
-0.0408609440237943
-0.00972850402357434
0.176308051376793
0.223262406628309
0.0656197558640164
-0.0268046405201399
0.0782109193550178
0.103835389826193
-0.00498305495842891
0.133160027645636
0.0830519774161298
-0.00782462208450461
-0.129652479215133
0.0296663129366979
-0.00397168441262917
-0.156485586314766


Parameters (Session):
par1 = FALSE ; par2 = 0.5 ; par3 = 1 ; par4 = 0 ; par5 = 12 ; par6 = 3 ; par7 = 1 ; par8 = 2 ; par9 = 1 ;
Parameters (R input):
par1 = FALSE ; par2 = 0.5 ; par3 = 1 ; par4 = 0 ; par5 = 12 ; par6 = 3 ; par7 = 1 ; par8 = 2 ; par9 = 1 ;
R code (references can be found in the software module):
library(lattice)
if (par1 == 'TRUE') par1 <- TRUE
if (par1 == 'FALSE') par1 <- FALSE
par2 <- as.numeric(par2) #Box-Cox lambda transformation parameter
par3 <- as.numeric(par3) #degree of non-seasonal differencing
par4 <- as.numeric(par4) #degree of seasonal differencing
par5 <- as.numeric(par5) #seasonal period
par6 <- as.numeric(par6) #degree (p) of the non-seasonal AR(p) polynomial
par7 <- as.numeric(par7) #degree (q) of the non-seasonal MA(q) polynomial
par8 <- as.numeric(par8) #degree (P) of the seasonal AR(P) polynomial
par9 <- as.numeric(par9) #degree (Q) of the seasonal MA(Q) polynomial
armaGR <- function(arima.out, names, n){
try1 <- arima.out$coef
try2 <- sqrt(diag(arima.out$var.coef))
try.data.frame <- data.frame(matrix(NA,ncol=4,nrow=length(names)))
dimnames(try.data.frame) <- list(names,c('coef','std','tstat','pv'))
try.data.frame[,1] <- try1
for(i in 1:length(try2)) try.data.frame[which(rownames(try.data.frame)==names(try2)[i]),2] <- try2[i]
try.data.frame[,3] <- try.data.frame[,1] / try.data.frame[,2]
try.data.frame[,4] <- round((1-pt(abs(try.data.frame[,3]),df=n-(length(try2)+1)))*2,5)
vector <- rep(NA,length(names))
vector[is.na(try.data.frame[,4])] <- 0
maxi <- which.max(try.data.frame[,4])
continue <- max(try.data.frame[,4],na.rm=TRUE) > .05
vector[maxi] <- 0
list(summary=try.data.frame,next.vector=vector,continue=continue)
}
arimaSelect <- function(series, order=c(13,0,0), seasonal=list(order=c(2,0,0),period=12), include.mean=F){
nrc <- order[1]+order[3]+seasonal$order[1]+seasonal$order[3]
coeff <- matrix(NA, nrow=nrc*2, ncol=nrc)
pval <- matrix(NA, nrow=nrc*2, ncol=nrc)
mylist <- rep(list(NULL), nrc)
names <- NULL
if(order[1] > 0) names <- paste('ar',1:order[1],sep='')
if(order[3] > 0) names <- c( names , paste('ma',1:order[3],sep='') )
if(seasonal$order[1] > 0) names <- c(names, paste('sar',1:seasonal$order[1],sep=''))
if(seasonal$order[3] > 0) names <- c(names, paste('sma',1:seasonal$order[3],sep=''))
arima.out <- arima(series, order=order, seasonal=seasonal, include.mean=include.mean, method='ML')
mylist[[1]] <- arima.out
last.arma <- armaGR(arima.out, names, length(series))
mystop <- FALSE
i <- 1
coeff[i,] <- last.arma[[1]][,1]
pval [i,] <- last.arma[[1]][,4]
i <- 2
aic <- arima.out$aic
while(!mystop){
mylist[[i]] <- arima.out
arima.out <- arima(series, order=order, seasonal=seasonal, include.mean=include.mean, method='ML', fixed=last.arma$next.vector)
aic <- c(aic, arima.out$aic)
last.arma <- armaGR(arima.out, names, length(series))
mystop <- !last.arma$continue
coeff[i,] <- last.arma[[1]][,1]
pval [i,] <- last.arma[[1]][,4]
i <- i+1
}
list(coeff, pval, mylist, aic=aic)
}
arimaSelectplot <- function(arimaSelect.out,noms,choix){
noms <- names(arimaSelect.out[[3]][[1]]$coef)
coeff <- arimaSelect.out[[1]]
k <- min(which(is.na(coeff[,1])))-1
coeff <- coeff[1:k,]
pval <- arimaSelect.out[[2]][1:k,]
aic <- arimaSelect.out$aic[1:k]
coeff[coeff==0] <- NA
n <- ncol(coeff)
if(missing(choix)) choix <- k
layout(matrix(c(1,1,1,2,
3,3,3,2,
3,3,3,4,
5,6,7,7),nr=4),
widths=c(10,35,45,15),
heights=c(30,30,15,15))
couleurs <- rainbow(75)[1:50]#(50)
ticks <- pretty(coeff)
par(mar=c(1,1,3,1))
plot(aic,k:1-.5,type='o',pch=21,bg='blue',cex=2,axes=F,lty=2,xpd=NA)
points(aic[choix],k-choix+.5,pch=21,cex=4,bg=2,xpd=NA)
title('aic',line=2)
par(mar=c(3,0,0,0))
plot(0,axes=F,xlab='',ylab='',xlim=range(ticks),ylim=c(.1,1))
rect(xleft = min(ticks) + (0:49)/50*(max(ticks)-min(ticks)),
xright = min(ticks) + (1:50)/50*(max(ticks)-min(ticks)),
ytop = rep(1,50),
ybottom= rep(0,50),col=couleurs,border=NA)
axis(1,ticks)
rect(xleft=min(ticks),xright=max(ticks),ytop=1,ybottom=0)
text(mean(coeff,na.rm=T),.5,'coefficients',cex=2,font=2)
par(mar=c(1,1,3,1))
image(1:n,1:k,t(coeff[k:1,]),axes=F,col=couleurs,zlim=range(ticks))
for(i in 1:n) for(j in 1:k) if(!is.na(coeff[j,i])) {
if(pval[j,i]<.01) symb = 'green'
else if( (pval[j,i]<.05) & (pval[j,i]>=.01)) symb = 'orange'
else if( (pval[j,i]<.1) & (pval[j,i]>=.05)) symb = 'red'
else symb = 'black'
polygon(c(i+.5 ,i+.2 ,i+.5 ,i+.5),
c(k-j+0.5,k-j+0.5,k-j+0.8,k-j+0.5),
col=symb)
if(j==choix) {
rect(xleft=i-.5,
xright=i+.5,
ybottom=k-j+1.5,
ytop=k-j+.5,
lwd=4)
text(i,
k-j+1,
round(coeff[j,i],2),
cex=1.2,
font=2)
}
else{
rect(xleft=i-.5,xright=i+.5,ybottom=k-j+1.5,ytop=k-j+.5)
text(i,k-j+1,round(coeff[j,i],2),cex=1.2,font=1)
}
}
axis(3,1:n,noms)
par(mar=c(0.5,0,0,0.5))
plot(0,axes=F,xlab='',ylab='',type='n',xlim=c(0,8),ylim=c(-.2,.8))
cols <- c('green','orange','red','black')
niv <- c('0','0.01','0.05','0.1')
for(i in 0:3){
polygon(c(1+2*i ,1+2*i ,1+2*i-.5 ,1+2*i),
c(.4 ,.7 , .4 , .4),
col=cols[i+1])
text(2*i,0.5,niv[i+1],cex=1.5)
}
text(8,.5,1,cex=1.5)
text(4,0,'p-value',cex=2)
box()
residus <- arimaSelect.out[[3]][[choix]]$res
par(mar=c(1,2,4,1))
acf(residus,main='')
title('acf',line=.5)
par(mar=c(1,2,4,1))
pacf(residus,main='')
title('pacf',line=.5)
par(mar=c(2,2,4,1))
qqnorm(residus,main='')
title('qq-norm',line=.5)
qqline(residus)
residus
}
if (par2 == 0) x <- log(x)
if (par2 != 0) x <- x^par2
(selection <- arimaSelect(x, order=c(par6,par3,par7), seasonal=list(order=c(par8,par4,par9), period=par5)))
bitmap(file='test1.png')
resid <- arimaSelectplot(selection)
dev.off()
resid
bitmap(file='test2.png')
acf(resid,length(resid)/2, main='Residual Autocorrelation Function')
dev.off()
bitmap(file='test3.png')
pacf(resid,length(resid)/2, main='Residual Partial Autocorrelation Function')
dev.off()
bitmap(file='test4.png')
cpgram(resid, main='Residual Cumulative Periodogram')
dev.off()
bitmap(file='test5.png')
hist(resid, main='Residual Histogram', xlab='values of Residuals')
dev.off()
bitmap(file='test6.png')
densityplot(~resid,col='black',main='Residual Density Plot', xlab='values of Residuals')
dev.off()
bitmap(file='test7.png')
qqnorm(resid, main='Residual Normal Q-Q Plot')
qqline(resid)
dev.off()
ncols <- length(selection[[1]][1,])
nrows <- length(selection[[2]][,1])-1
load(file='createtable')
a<-table.start()
a<-table.row.start(a)
a<-table.element(a,'ARIMA Parameter Estimation and Backward Selection', ncols+1,TRUE)
a<-table.row.end(a)
a<-table.row.start(a)
a<-table.element(a,'Iteration', header=TRUE)
for (i in 1:ncols) {
a<-table.element(a,names(selection[[3]][[1]]$coef)[i],header=TRUE)
}
a<-table.row.end(a)
for (j in 1:nrows) {
a<-table.row.start(a)
mydum <- 'Estimates ('
mydum <- paste(mydum,j)
mydum <- paste(mydum,')')
a<-table.element(a,mydum, header=TRUE)
for (i in 1:ncols) {
a<-table.element(a,round(selection[[1]][j,i],4))
}
a<-table.row.end(a)
a<-table.row.start(a)
a<-table.element(a,'(p-val)', header=TRUE)
for (i in 1:ncols) {
mydum <- '('
mydum <- paste(mydum,round(selection[[2]][j,i],4),sep='')
mydum <- paste(mydum,')')
a<-table.element(a,mydum)
}
a<-table.row.end(a)
}
a<-table.end(a)
table.save(a,file='mytable.tab')
a<-table.start()
a<-table.row.start(a)
a<-table.element(a,'Estimated ARIMA Residuals', 1,TRUE)
a<-table.row.end(a)
a<-table.row.start(a)
a<-table.element(a,'Value', 1,TRUE)
a<-table.row.end(a)
for (i in (par4*par5+par3):length(resid)) {
a<-table.row.start(a)
a<-table.element(a,resid[i])
a<-table.row.end(a)
}
a<-table.end(a)
table.save(a,file='mytable1.tab')