Free Statistics

of Irreproducible Research!

Author's title

Author*The author of this computation has been verified*
R Software Modulerwasp_autocorrelation.wasp
Title produced by software(Partial) Autocorrelation Function
Date of computationMon, 22 Dec 2008 05:41:23 -0700
Cite this page as followsStatistical Computations at FreeStatistics.org, Office for Research Development and Education, URL https://freestatistics.org/blog/index.php?v=date/2008/Dec/22/t1229949796m7uqs37cisrp11x.htm/, Retrieved Mon, 13 May 2024 07:23:42 +0000
Statistical Computations at FreeStatistics.org, Office for Research Development and Education, URL https://freestatistics.org/blog/index.php?pk=36027, Retrieved Mon, 13 May 2024 07:23:42 +0000
QR Codes:

Original text written by user:
IsPrivate?No (this computation is public)
User-defined keywords
Estimated Impact200
Family? (F = Feedback message, R = changed R code, M = changed R Module, P = changed Parameters, D = changed Data)
F     [Mean Plot] [Mean Plot] [2008-11-06 16:32:30] [1a98f534d827b920a5783bf87d2d3cce]
- RMPD    [(Partial) Autocorrelation Function] [acf] [2008-12-22 12:41:23] [96839c4b6d4e03ef3851369c676780bf] [Current]
Feedback Forum

Post a new message
Dataseries X:
15
13
8
7
3
3
4
4
0
-4
-14
-18
-8
-1
1
2
0
1
0
-1
-3
-3
-3
-4
-8
-9
-13
-18
-11
-9
-10
-13
-11
-5
-15
-6
-6
-3
-1
-3
-4
-6
0
-4
-2
-2
-6
-7
-6
-6
-3
-2
-5
-11
-11
-11
-10
-14
-8
-9
-5
-1
-2
-5
-4
-6
-2
-2
-2
-2
2
1
-8
-1
1
-1
2
2
1
-1
-2
-2
-1
-8
-4
-6
-3
-3
-7
-9
-11
-13
-11
-9
-17
-22
-25


Summary of computational transaction
Raw Inputview raw input (R code)
Raw Outputview raw output of R engine
Computing time1 seconds
R Server'Gwilym Jenkins' @ 72.249.127.135

\begin{tabular}{lllllllll}
\hline
Summary of computational transaction \tabularnewline
Raw Input & view raw input (R code)  \tabularnewline
Raw Output & view raw output of R engine  \tabularnewline
Computing time & 1 seconds \tabularnewline
R Server & 'Gwilym Jenkins' @ 72.249.127.135 \tabularnewline
\hline
\end{tabular}
%Source: https://freestatistics.org/blog/index.php?pk=36027&T=0

[TABLE]
[ROW][C]Summary of computational transaction[/C][/ROW]
[ROW][C]Raw Input[/C][C]view raw input (R code) [/C][/ROW]
[ROW][C]Raw Output[/C][C]view raw output of R engine [/C][/ROW]
[ROW][C]Computing time[/C][C]1 seconds[/C][/ROW]
[ROW][C]R Server[/C][C]'Gwilym Jenkins' @ 72.249.127.135[/C][/ROW]
[/TABLE]
Source: https://freestatistics.org/blog/index.php?pk=36027&T=0

Globally Unique Identifier (entire table): ba.freestatistics.org/blog/index.php?pk=36027&T=0

As an alternative you can also use a QR Code:  

The GUIDs for individual cells are displayed in the table below:

Summary of computational transaction
Raw Inputview raw input (R code)
Raw Outputview raw output of R engine
Computing time1 seconds
R Server'Gwilym Jenkins' @ 72.249.127.135


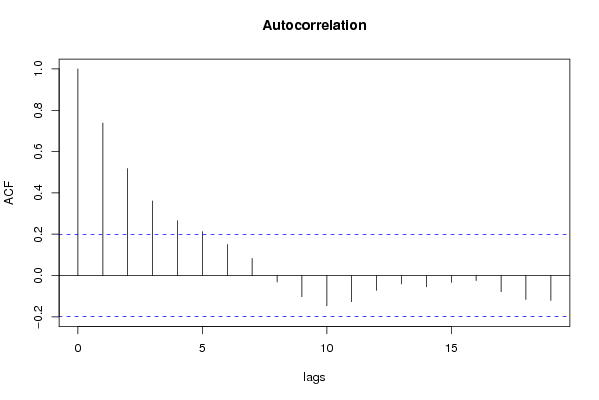
Autocorrelation Function
Time lag kACF(k)T-STATP-value
10.7382967.27140
20.5179785.10151e-06
30.3613193.55860.00029
40.2657372.61720.005142
50.2121782.08970.01963
60.1501931.47920.071159
70.0826250.81380.208887
8-0.030942-0.30470.380609
9-0.10264-1.01090.157292
10-0.146397-1.44180.076283
11-0.126595-1.24680.107734
12-0.071898-0.70810.240287
13-0.040748-0.40130.344532
14-0.054786-0.53960.295362
15-0.033092-0.32590.372593
16-0.024276-0.23910.405771
17-0.078067-0.76890.221918
18-0.115901-1.14150.128238
19-0.120365-1.18550.119366

\begin{tabular}{lllllllll}
\hline
Autocorrelation Function \tabularnewline
Time lag k & ACF(k) & T-STAT & P-value \tabularnewline
1 & 0.738296 & 7.2714 & 0 \tabularnewline
2 & 0.517978 & 5.1015 & 1e-06 \tabularnewline
3 & 0.361319 & 3.5586 & 0.00029 \tabularnewline
4 & 0.265737 & 2.6172 & 0.005142 \tabularnewline
5 & 0.212178 & 2.0897 & 0.01963 \tabularnewline
6 & 0.150193 & 1.4792 & 0.071159 \tabularnewline
7 & 0.082625 & 0.8138 & 0.208887 \tabularnewline
8 & -0.030942 & -0.3047 & 0.380609 \tabularnewline
9 & -0.10264 & -1.0109 & 0.157292 \tabularnewline
10 & -0.146397 & -1.4418 & 0.076283 \tabularnewline
11 & -0.126595 & -1.2468 & 0.107734 \tabularnewline
12 & -0.071898 & -0.7081 & 0.240287 \tabularnewline
13 & -0.040748 & -0.4013 & 0.344532 \tabularnewline
14 & -0.054786 & -0.5396 & 0.295362 \tabularnewline
15 & -0.033092 & -0.3259 & 0.372593 \tabularnewline
16 & -0.024276 & -0.2391 & 0.405771 \tabularnewline
17 & -0.078067 & -0.7689 & 0.221918 \tabularnewline
18 & -0.115901 & -1.1415 & 0.128238 \tabularnewline
19 & -0.120365 & -1.1855 & 0.119366 \tabularnewline
\hline
\end{tabular}
%Source: https://freestatistics.org/blog/index.php?pk=36027&T=1

[TABLE]
[ROW][C]Autocorrelation Function[/C][/ROW]
[ROW][C]Time lag k[/C][C]ACF(k)[/C][C]T-STAT[/C][C]P-value[/C][/ROW]
[ROW][C]1[/C][C]0.738296[/C][C]7.2714[/C][C]0[/C][/ROW]
[ROW][C]2[/C][C]0.517978[/C][C]5.1015[/C][C]1e-06[/C][/ROW]
[ROW][C]3[/C][C]0.361319[/C][C]3.5586[/C][C]0.00029[/C][/ROW]
[ROW][C]4[/C][C]0.265737[/C][C]2.6172[/C][C]0.005142[/C][/ROW]
[ROW][C]5[/C][C]0.212178[/C][C]2.0897[/C][C]0.01963[/C][/ROW]
[ROW][C]6[/C][C]0.150193[/C][C]1.4792[/C][C]0.071159[/C][/ROW]
[ROW][C]7[/C][C]0.082625[/C][C]0.8138[/C][C]0.208887[/C][/ROW]
[ROW][C]8[/C][C]-0.030942[/C][C]-0.3047[/C][C]0.380609[/C][/ROW]
[ROW][C]9[/C][C]-0.10264[/C][C]-1.0109[/C][C]0.157292[/C][/ROW]
[ROW][C]10[/C][C]-0.146397[/C][C]-1.4418[/C][C]0.076283[/C][/ROW]
[ROW][C]11[/C][C]-0.126595[/C][C]-1.2468[/C][C]0.107734[/C][/ROW]
[ROW][C]12[/C][C]-0.071898[/C][C]-0.7081[/C][C]0.240287[/C][/ROW]
[ROW][C]13[/C][C]-0.040748[/C][C]-0.4013[/C][C]0.344532[/C][/ROW]
[ROW][C]14[/C][C]-0.054786[/C][C]-0.5396[/C][C]0.295362[/C][/ROW]
[ROW][C]15[/C][C]-0.033092[/C][C]-0.3259[/C][C]0.372593[/C][/ROW]
[ROW][C]16[/C][C]-0.024276[/C][C]-0.2391[/C][C]0.405771[/C][/ROW]
[ROW][C]17[/C][C]-0.078067[/C][C]-0.7689[/C][C]0.221918[/C][/ROW]
[ROW][C]18[/C][C]-0.115901[/C][C]-1.1415[/C][C]0.128238[/C][/ROW]
[ROW][C]19[/C][C]-0.120365[/C][C]-1.1855[/C][C]0.119366[/C][/ROW]
[/TABLE]
Source: https://freestatistics.org/blog/index.php?pk=36027&T=1

Globally Unique Identifier (entire table): ba.freestatistics.org/blog/index.php?pk=36027&T=1

As an alternative you can also use a QR Code:  

The GUIDs for individual cells are displayed in the table below:

Autocorrelation Function
Time lag kACF(k)T-STATP-value
10.7382967.27140
20.5179785.10151e-06
30.3613193.55860.00029
40.2657372.61720.005142
50.2121782.08970.01963
60.1501931.47920.071159
70.0826250.81380.208887
8-0.030942-0.30470.380609
9-0.10264-1.01090.157292
10-0.146397-1.44180.076283
11-0.126595-1.24680.107734
12-0.071898-0.70810.240287
13-0.040748-0.40130.344532
14-0.054786-0.53960.295362
15-0.033092-0.32590.372593
16-0.024276-0.23910.405771
17-0.078067-0.76890.221918
18-0.115901-1.14150.128238
19-0.120365-1.18550.119366


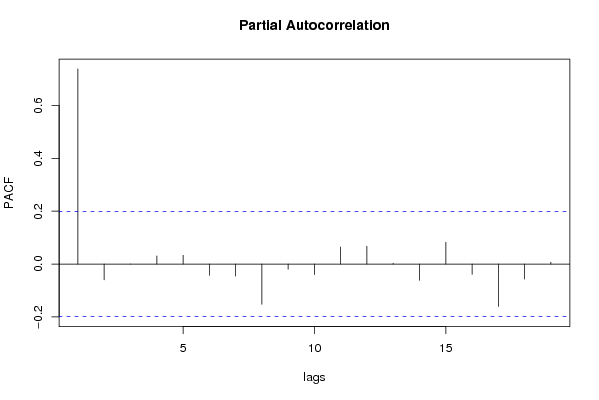
Partial Autocorrelation Function
Time lag kPACF(k)T-STATP-value
10.7382967.27140
2-0.059575-0.58670.279368
30.0002180.00210.499145
40.0305880.30130.381932
50.0329480.32450.373129
6-0.042738-0.42090.33737
7-0.045339-0.44650.328103
8-0.152483-1.50180.068201
9-0.019487-0.19190.4241
10-0.039914-0.39310.347553
110.0645570.63580.263198
120.0676130.66590.253524
130.0028550.02810.488812
14-0.061601-0.60670.272734
150.0827870.81540.208432
16-0.038759-0.38170.351749
17-0.160392-1.57970.058718
18-0.056824-0.55960.288505
190.0068840.06780.473041

\begin{tabular}{lllllllll}
\hline
Partial Autocorrelation Function \tabularnewline
Time lag k & PACF(k) & T-STAT & P-value \tabularnewline
1 & 0.738296 & 7.2714 & 0 \tabularnewline
2 & -0.059575 & -0.5867 & 0.279368 \tabularnewline
3 & 0.000218 & 0.0021 & 0.499145 \tabularnewline
4 & 0.030588 & 0.3013 & 0.381932 \tabularnewline
5 & 0.032948 & 0.3245 & 0.373129 \tabularnewline
6 & -0.042738 & -0.4209 & 0.33737 \tabularnewline
7 & -0.045339 & -0.4465 & 0.328103 \tabularnewline
8 & -0.152483 & -1.5018 & 0.068201 \tabularnewline
9 & -0.019487 & -0.1919 & 0.4241 \tabularnewline
10 & -0.039914 & -0.3931 & 0.347553 \tabularnewline
11 & 0.064557 & 0.6358 & 0.263198 \tabularnewline
12 & 0.067613 & 0.6659 & 0.253524 \tabularnewline
13 & 0.002855 & 0.0281 & 0.488812 \tabularnewline
14 & -0.061601 & -0.6067 & 0.272734 \tabularnewline
15 & 0.082787 & 0.8154 & 0.208432 \tabularnewline
16 & -0.038759 & -0.3817 & 0.351749 \tabularnewline
17 & -0.160392 & -1.5797 & 0.058718 \tabularnewline
18 & -0.056824 & -0.5596 & 0.288505 \tabularnewline
19 & 0.006884 & 0.0678 & 0.473041 \tabularnewline
\hline
\end{tabular}
%Source: https://freestatistics.org/blog/index.php?pk=36027&T=2

[TABLE]
[ROW][C]Partial Autocorrelation Function[/C][/ROW]
[ROW][C]Time lag k[/C][C]PACF(k)[/C][C]T-STAT[/C][C]P-value[/C][/ROW]
[ROW][C]1[/C][C]0.738296[/C][C]7.2714[/C][C]0[/C][/ROW]
[ROW][C]2[/C][C]-0.059575[/C][C]-0.5867[/C][C]0.279368[/C][/ROW]
[ROW][C]3[/C][C]0.000218[/C][C]0.0021[/C][C]0.499145[/C][/ROW]
[ROW][C]4[/C][C]0.030588[/C][C]0.3013[/C][C]0.381932[/C][/ROW]
[ROW][C]5[/C][C]0.032948[/C][C]0.3245[/C][C]0.373129[/C][/ROW]
[ROW][C]6[/C][C]-0.042738[/C][C]-0.4209[/C][C]0.33737[/C][/ROW]
[ROW][C]7[/C][C]-0.045339[/C][C]-0.4465[/C][C]0.328103[/C][/ROW]
[ROW][C]8[/C][C]-0.152483[/C][C]-1.5018[/C][C]0.068201[/C][/ROW]
[ROW][C]9[/C][C]-0.019487[/C][C]-0.1919[/C][C]0.4241[/C][/ROW]
[ROW][C]10[/C][C]-0.039914[/C][C]-0.3931[/C][C]0.347553[/C][/ROW]
[ROW][C]11[/C][C]0.064557[/C][C]0.6358[/C][C]0.263198[/C][/ROW]
[ROW][C]12[/C][C]0.067613[/C][C]0.6659[/C][C]0.253524[/C][/ROW]
[ROW][C]13[/C][C]0.002855[/C][C]0.0281[/C][C]0.488812[/C][/ROW]
[ROW][C]14[/C][C]-0.061601[/C][C]-0.6067[/C][C]0.272734[/C][/ROW]
[ROW][C]15[/C][C]0.082787[/C][C]0.8154[/C][C]0.208432[/C][/ROW]
[ROW][C]16[/C][C]-0.038759[/C][C]-0.3817[/C][C]0.351749[/C][/ROW]
[ROW][C]17[/C][C]-0.160392[/C][C]-1.5797[/C][C]0.058718[/C][/ROW]
[ROW][C]18[/C][C]-0.056824[/C][C]-0.5596[/C][C]0.288505[/C][/ROW]
[ROW][C]19[/C][C]0.006884[/C][C]0.0678[/C][C]0.473041[/C][/ROW]
[/TABLE]
Source: https://freestatistics.org/blog/index.php?pk=36027&T=2

Globally Unique Identifier (entire table): ba.freestatistics.org/blog/index.php?pk=36027&T=2

As an alternative you can also use a QR Code:  

The GUIDs for individual cells are displayed in the table below:

Partial Autocorrelation Function
Time lag kPACF(k)T-STATP-value
10.7382967.27140
2-0.059575-0.58670.279368
30.0002180.00210.499145
40.0305880.30130.381932
50.0329480.32450.373129
6-0.042738-0.42090.33737
7-0.045339-0.44650.328103
8-0.152483-1.50180.068201
9-0.019487-0.19190.4241
10-0.039914-0.39310.347553
110.0645570.63580.263198
120.0676130.66590.253524
130.0028550.02810.488812
14-0.061601-0.60670.272734
150.0827870.81540.208432
16-0.038759-0.38170.351749
17-0.160392-1.57970.058718
18-0.056824-0.55960.288505
190.0068840.06780.473041


Parameters (Session):
par1 = Default ; par2 = 1 ; par3 = 0 ; par4 = 0 ; par5 = 12 ;
Parameters (R input):
par1 = Default ; par2 = 1 ; par3 = 0 ; par4 = 0 ; par5 = 12 ;
R code (references can be found in the software module):
if (par1 == 'Default') {
par1 = 10*log10(length(x))
} else {
par1 <- as.numeric(par1)
}
par2 <- as.numeric(par2)
par3 <- as.numeric(par3)
par4 <- as.numeric(par4)
par5 <- as.numeric(par5)
if (par2 == 0) {
x <- log(x)
} else {
x <- (x ^ par2 - 1) / par2
}
if (par3 > 0) x <- diff(x,lag=1,difference=par3)
if (par4 > 0) x <- diff(x,lag=par5,difference=par4)
bitmap(file='pic1.png')
racf <- acf(x,par1,main='Autocorrelation',xlab='lags',ylab='ACF')
dev.off()
bitmap(file='pic2.png')
rpacf <- pacf(x,par1,main='Partial Autocorrelation',xlab='lags',ylab='PACF')
dev.off()
(myacf <- c(racf$acf))
(mypacf <- c(rpacf$acf))
lengthx <- length(x)
sqrtn <- sqrt(lengthx)
load(file='createtable')
a<-table.start()
a<-table.row.start(a)
a<-table.element(a,'Autocorrelation Function',4,TRUE)
a<-table.row.end(a)
a<-table.row.start(a)
a<-table.element(a,'Time lag k',header=TRUE)
a<-table.element(a,hyperlink('basics.htm','ACF(k)','click here for more information about the Autocorrelation Function'),header=TRUE)
a<-table.element(a,'T-STAT',header=TRUE)
a<-table.element(a,'P-value',header=TRUE)
a<-table.row.end(a)
for (i in 2:(par1+1)) {
a<-table.row.start(a)
a<-table.element(a,i-1,header=TRUE)
a<-table.element(a,round(myacf[i],6))
mytstat <- myacf[i]*sqrtn
a<-table.element(a,round(mytstat,4))
a<-table.element(a,round(1-pt(abs(mytstat),lengthx),6))
a<-table.row.end(a)
}
a<-table.end(a)
table.save(a,file='mytable.tab')
a<-table.start()
a<-table.row.start(a)
a<-table.element(a,'Partial Autocorrelation Function',4,TRUE)
a<-table.row.end(a)
a<-table.row.start(a)
a<-table.element(a,'Time lag k',header=TRUE)
a<-table.element(a,hyperlink('basics.htm','PACF(k)','click here for more information about the Partial Autocorrelation Function'),header=TRUE)
a<-table.element(a,'T-STAT',header=TRUE)
a<-table.element(a,'P-value',header=TRUE)
a<-table.row.end(a)
for (i in 1:par1) {
a<-table.row.start(a)
a<-table.element(a,i,header=TRUE)
a<-table.element(a,round(mypacf[i],6))
mytstat <- mypacf[i]*sqrtn
a<-table.element(a,round(mytstat,4))
a<-table.element(a,round(1-pt(abs(mytstat),lengthx),6))
a<-table.row.end(a)
}
a<-table.end(a)
table.save(a,file='mytable1.tab')