Free Statistics

of Irreproducible Research!

Author's title

Author*The author of this computation has been verified*
R Software Modulerwasp_autocorrelation.wasp
Title produced by software(Partial) Autocorrelation Function
Date of computationMon, 22 Dec 2008 05:36:13 -0700
Cite this page as followsStatistical Computations at FreeStatistics.org, Office for Research Development and Education, URL https://freestatistics.org/blog/index.php?v=date/2008/Dec/22/t1229949617xbnhqdyofn7aljs.htm/, Retrieved Sun, 12 May 2024 22:39:52 +0000
Statistical Computations at FreeStatistics.org, Office for Research Development and Education, URL https://freestatistics.org/blog/index.php?pk=36025, Retrieved Sun, 12 May 2024 22:39:52 +0000
QR Codes:

Original text written by user:
IsPrivate?No (this computation is public)
User-defined keywords
Estimated Impact173
Family? (F = Feedback message, R = changed R code, M = changed R Module, P = changed Parameters, D = changed Data)
F     [Mean Plot] [Mean Plot] [2008-11-06 16:32:30] [1a98f534d827b920a5783bf87d2d3cce]
- RMPD    [(Partial) Autocorrelation Function] [acf] [2008-12-22 12:36:13] [96839c4b6d4e03ef3851369c676780bf] [Current]
Feedback Forum

Post a new message
Dataseries X:
15
13
8
7
3
3
4
4
0
-4
-14
-18
-8
-1
1
2
0
1
0
-1
-3
-3
-3
-4
-8
-9
-13
-18
-11
-9
-10
-13
-11
-5
-15
-6
-6
-3
-1
-3
-4
-6
0
-4
-2
-2
-6
-7
-6
-6
-3
-2
-5
-11
-11
-11
-10
-14
-8
-9
-5
-1
-2
-5
-4
-6
-2
-2
-2
-2
2
1
-8
-1
1
-1
2
2
1
-1
-2
-2
-1
-8
-4
-6
-3
-3
-7
-9
-11
-13
-11
-9
-17
-22
-25


Summary of computational transaction
Raw Inputview raw input (R code)
Raw Outputview raw output of R engine
Computing time1 seconds
R Server'George Udny Yule' @ 72.249.76.132

\begin{tabular}{lllllllll}
\hline
Summary of computational transaction \tabularnewline
Raw Input & view raw input (R code)  \tabularnewline
Raw Output & view raw output of R engine  \tabularnewline
Computing time & 1 seconds \tabularnewline
R Server & 'George Udny Yule' @ 72.249.76.132 \tabularnewline
\hline
\end{tabular}
%Source: https://freestatistics.org/blog/index.php?pk=36025&T=0

[TABLE]
[ROW][C]Summary of computational transaction[/C][/ROW]
[ROW][C]Raw Input[/C][C]view raw input (R code) [/C][/ROW]
[ROW][C]Raw Output[/C][C]view raw output of R engine [/C][/ROW]
[ROW][C]Computing time[/C][C]1 seconds[/C][/ROW]
[ROW][C]R Server[/C][C]'George Udny Yule' @ 72.249.76.132[/C][/ROW]
[/TABLE]
Source: https://freestatistics.org/blog/index.php?pk=36025&T=0

Globally Unique Identifier (entire table): ba.freestatistics.org/blog/index.php?pk=36025&T=0

As an alternative you can also use a QR Code:  

The GUIDs for individual cells are displayed in the table below:

Summary of computational transaction
Raw Inputview raw input (R code)
Raw Outputview raw output of R engine
Computing time1 seconds
R Server'George Udny Yule' @ 72.249.76.132


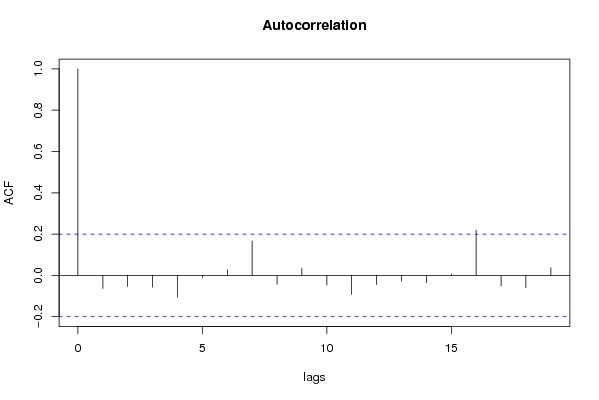
Autocorrelation Function
Time lag kACF(k)T-STATP-value
1-0.063378-0.6210.268045
2-0.05441-0.53310.297597
3-0.05697-0.55820.289008
4-0.105828-1.03690.151193
5-0.010121-0.09920.460608
60.0274490.26890.394275
70.1670251.63650.052504
8-0.042851-0.41980.337767
90.0327920.32130.374342
10-0.046475-0.45540.324939
11-0.091907-0.90050.185055
12-0.044429-0.43530.332155
13-0.028545-0.27970.390163
14-0.035342-0.34630.364946
150.0065270.0640.47457
160.2193842.14950.017054
17-0.051434-0.5040.307725
18-0.059602-0.5840.280301
190.0366040.35860.360325

\begin{tabular}{lllllllll}
\hline
Autocorrelation Function \tabularnewline
Time lag k & ACF(k) & T-STAT & P-value \tabularnewline
1 & -0.063378 & -0.621 & 0.268045 \tabularnewline
2 & -0.05441 & -0.5331 & 0.297597 \tabularnewline
3 & -0.05697 & -0.5582 & 0.289008 \tabularnewline
4 & -0.105828 & -1.0369 & 0.151193 \tabularnewline
5 & -0.010121 & -0.0992 & 0.460608 \tabularnewline
6 & 0.027449 & 0.2689 & 0.394275 \tabularnewline
7 & 0.167025 & 1.6365 & 0.052504 \tabularnewline
8 & -0.042851 & -0.4198 & 0.337767 \tabularnewline
9 & 0.032792 & 0.3213 & 0.374342 \tabularnewline
10 & -0.046475 & -0.4554 & 0.324939 \tabularnewline
11 & -0.091907 & -0.9005 & 0.185055 \tabularnewline
12 & -0.044429 & -0.4353 & 0.332155 \tabularnewline
13 & -0.028545 & -0.2797 & 0.390163 \tabularnewline
14 & -0.035342 & -0.3463 & 0.364946 \tabularnewline
15 & 0.006527 & 0.064 & 0.47457 \tabularnewline
16 & 0.219384 & 2.1495 & 0.017054 \tabularnewline
17 & -0.051434 & -0.504 & 0.307725 \tabularnewline
18 & -0.059602 & -0.584 & 0.280301 \tabularnewline
19 & 0.036604 & 0.3586 & 0.360325 \tabularnewline
\hline
\end{tabular}
%Source: https://freestatistics.org/blog/index.php?pk=36025&T=1

[TABLE]
[ROW][C]Autocorrelation Function[/C][/ROW]
[ROW][C]Time lag k[/C][C]ACF(k)[/C][C]T-STAT[/C][C]P-value[/C][/ROW]
[ROW][C]1[/C][C]-0.063378[/C][C]-0.621[/C][C]0.268045[/C][/ROW]
[ROW][C]2[/C][C]-0.05441[/C][C]-0.5331[/C][C]0.297597[/C][/ROW]
[ROW][C]3[/C][C]-0.05697[/C][C]-0.5582[/C][C]0.289008[/C][/ROW]
[ROW][C]4[/C][C]-0.105828[/C][C]-1.0369[/C][C]0.151193[/C][/ROW]
[ROW][C]5[/C][C]-0.010121[/C][C]-0.0992[/C][C]0.460608[/C][/ROW]
[ROW][C]6[/C][C]0.027449[/C][C]0.2689[/C][C]0.394275[/C][/ROW]
[ROW][C]7[/C][C]0.167025[/C][C]1.6365[/C][C]0.052504[/C][/ROW]
[ROW][C]8[/C][C]-0.042851[/C][C]-0.4198[/C][C]0.337767[/C][/ROW]
[ROW][C]9[/C][C]0.032792[/C][C]0.3213[/C][C]0.374342[/C][/ROW]
[ROW][C]10[/C][C]-0.046475[/C][C]-0.4554[/C][C]0.324939[/C][/ROW]
[ROW][C]11[/C][C]-0.091907[/C][C]-0.9005[/C][C]0.185055[/C][/ROW]
[ROW][C]12[/C][C]-0.044429[/C][C]-0.4353[/C][C]0.332155[/C][/ROW]
[ROW][C]13[/C][C]-0.028545[/C][C]-0.2797[/C][C]0.390163[/C][/ROW]
[ROW][C]14[/C][C]-0.035342[/C][C]-0.3463[/C][C]0.364946[/C][/ROW]
[ROW][C]15[/C][C]0.006527[/C][C]0.064[/C][C]0.47457[/C][/ROW]
[ROW][C]16[/C][C]0.219384[/C][C]2.1495[/C][C]0.017054[/C][/ROW]
[ROW][C]17[/C][C]-0.051434[/C][C]-0.504[/C][C]0.307725[/C][/ROW]
[ROW][C]18[/C][C]-0.059602[/C][C]-0.584[/C][C]0.280301[/C][/ROW]
[ROW][C]19[/C][C]0.036604[/C][C]0.3586[/C][C]0.360325[/C][/ROW]
[/TABLE]
Source: https://freestatistics.org/blog/index.php?pk=36025&T=1

Globally Unique Identifier (entire table): ba.freestatistics.org/blog/index.php?pk=36025&T=1

As an alternative you can also use a QR Code:  

The GUIDs for individual cells are displayed in the table below:

Autocorrelation Function
Time lag kACF(k)T-STATP-value
1-0.063378-0.6210.268045
2-0.05441-0.53310.297597
3-0.05697-0.55820.289008
4-0.105828-1.03690.151193
5-0.010121-0.09920.460608
60.0274490.26890.394275
70.1670251.63650.052504
8-0.042851-0.41980.337767
90.0327920.32130.374342
10-0.046475-0.45540.324939
11-0.091907-0.90050.185055
12-0.044429-0.43530.332155
13-0.028545-0.27970.390163
14-0.035342-0.34630.364946
150.0065270.0640.47457
160.2193842.14950.017054
17-0.051434-0.5040.307725
18-0.059602-0.5840.280301
190.0366040.35860.360325


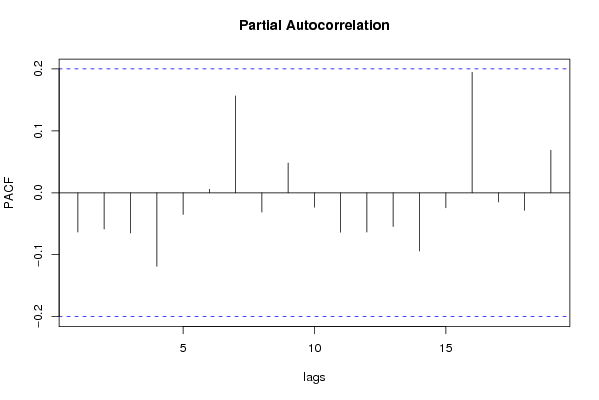
Partial Autocorrelation Function
Time lag kPACF(k)T-STATP-value
1-0.063378-0.6210.268045
2-0.058662-0.57480.283396
3-0.064821-0.63510.263433
4-0.118784-1.16380.123687
5-0.034859-0.34150.366719
60.0059050.05790.476992
70.1563881.53230.064371
8-0.031168-0.30540.380368
90.0481330.47160.31914
10-0.023268-0.2280.410073
11-0.06364-0.62350.267202
12-0.063478-0.6220.267723
13-0.054566-0.53460.29707
14-0.094009-0.92110.179655
15-0.02427-0.23780.406272
160.1947051.90770.029709
17-0.014836-0.14540.442364
18-0.028382-0.27810.390773
190.0686740.67290.251325

\begin{tabular}{lllllllll}
\hline
Partial Autocorrelation Function \tabularnewline
Time lag k & PACF(k) & T-STAT & P-value \tabularnewline
1 & -0.063378 & -0.621 & 0.268045 \tabularnewline
2 & -0.058662 & -0.5748 & 0.283396 \tabularnewline
3 & -0.064821 & -0.6351 & 0.263433 \tabularnewline
4 & -0.118784 & -1.1638 & 0.123687 \tabularnewline
5 & -0.034859 & -0.3415 & 0.366719 \tabularnewline
6 & 0.005905 & 0.0579 & 0.476992 \tabularnewline
7 & 0.156388 & 1.5323 & 0.064371 \tabularnewline
8 & -0.031168 & -0.3054 & 0.380368 \tabularnewline
9 & 0.048133 & 0.4716 & 0.31914 \tabularnewline
10 & -0.023268 & -0.228 & 0.410073 \tabularnewline
11 & -0.06364 & -0.6235 & 0.267202 \tabularnewline
12 & -0.063478 & -0.622 & 0.267723 \tabularnewline
13 & -0.054566 & -0.5346 & 0.29707 \tabularnewline
14 & -0.094009 & -0.9211 & 0.179655 \tabularnewline
15 & -0.02427 & -0.2378 & 0.406272 \tabularnewline
16 & 0.194705 & 1.9077 & 0.029709 \tabularnewline
17 & -0.014836 & -0.1454 & 0.442364 \tabularnewline
18 & -0.028382 & -0.2781 & 0.390773 \tabularnewline
19 & 0.068674 & 0.6729 & 0.251325 \tabularnewline
\hline
\end{tabular}
%Source: https://freestatistics.org/blog/index.php?pk=36025&T=2

[TABLE]
[ROW][C]Partial Autocorrelation Function[/C][/ROW]
[ROW][C]Time lag k[/C][C]PACF(k)[/C][C]T-STAT[/C][C]P-value[/C][/ROW]
[ROW][C]1[/C][C]-0.063378[/C][C]-0.621[/C][C]0.268045[/C][/ROW]
[ROW][C]2[/C][C]-0.058662[/C][C]-0.5748[/C][C]0.283396[/C][/ROW]
[ROW][C]3[/C][C]-0.064821[/C][C]-0.6351[/C][C]0.263433[/C][/ROW]
[ROW][C]4[/C][C]-0.118784[/C][C]-1.1638[/C][C]0.123687[/C][/ROW]
[ROW][C]5[/C][C]-0.034859[/C][C]-0.3415[/C][C]0.366719[/C][/ROW]
[ROW][C]6[/C][C]0.005905[/C][C]0.0579[/C][C]0.476992[/C][/ROW]
[ROW][C]7[/C][C]0.156388[/C][C]1.5323[/C][C]0.064371[/C][/ROW]
[ROW][C]8[/C][C]-0.031168[/C][C]-0.3054[/C][C]0.380368[/C][/ROW]
[ROW][C]9[/C][C]0.048133[/C][C]0.4716[/C][C]0.31914[/C][/ROW]
[ROW][C]10[/C][C]-0.023268[/C][C]-0.228[/C][C]0.410073[/C][/ROW]
[ROW][C]11[/C][C]-0.06364[/C][C]-0.6235[/C][C]0.267202[/C][/ROW]
[ROW][C]12[/C][C]-0.063478[/C][C]-0.622[/C][C]0.267723[/C][/ROW]
[ROW][C]13[/C][C]-0.054566[/C][C]-0.5346[/C][C]0.29707[/C][/ROW]
[ROW][C]14[/C][C]-0.094009[/C][C]-0.9211[/C][C]0.179655[/C][/ROW]
[ROW][C]15[/C][C]-0.02427[/C][C]-0.2378[/C][C]0.406272[/C][/ROW]
[ROW][C]16[/C][C]0.194705[/C][C]1.9077[/C][C]0.029709[/C][/ROW]
[ROW][C]17[/C][C]-0.014836[/C][C]-0.1454[/C][C]0.442364[/C][/ROW]
[ROW][C]18[/C][C]-0.028382[/C][C]-0.2781[/C][C]0.390773[/C][/ROW]
[ROW][C]19[/C][C]0.068674[/C][C]0.6729[/C][C]0.251325[/C][/ROW]
[/TABLE]
Source: https://freestatistics.org/blog/index.php?pk=36025&T=2

Globally Unique Identifier (entire table): ba.freestatistics.org/blog/index.php?pk=36025&T=2

As an alternative you can also use a QR Code:  

The GUIDs for individual cells are displayed in the table below:

Partial Autocorrelation Function
Time lag kPACF(k)T-STATP-value
1-0.063378-0.6210.268045
2-0.058662-0.57480.283396
3-0.064821-0.63510.263433
4-0.118784-1.16380.123687
5-0.034859-0.34150.366719
60.0059050.05790.476992
70.1563881.53230.064371
8-0.031168-0.30540.380368
90.0481330.47160.31914
10-0.023268-0.2280.410073
11-0.06364-0.62350.267202
12-0.063478-0.6220.267723
13-0.054566-0.53460.29707
14-0.094009-0.92110.179655
15-0.02427-0.23780.406272
160.1947051.90770.029709
17-0.014836-0.14540.442364
18-0.028382-0.27810.390773
190.0686740.67290.251325


Parameters (Session):
par1 = Default ; par2 = 1 ; par3 = 1 ; par4 = 0 ; par5 = 12 ;
Parameters (R input):
par1 = Default ; par2 = 1 ; par3 = 1 ; par4 = 0 ; par5 = 12 ;
R code (references can be found in the software module):
if (par1 == 'Default') {
par1 = 10*log10(length(x))
} else {
par1 <- as.numeric(par1)
}
par2 <- as.numeric(par2)
par3 <- as.numeric(par3)
par4 <- as.numeric(par4)
par5 <- as.numeric(par5)
if (par2 == 0) {
x <- log(x)
} else {
x <- (x ^ par2 - 1) / par2
}
if (par3 > 0) x <- diff(x,lag=1,difference=par3)
if (par4 > 0) x <- diff(x,lag=par5,difference=par4)
bitmap(file='pic1.png')
racf <- acf(x,par1,main='Autocorrelation',xlab='lags',ylab='ACF')
dev.off()
bitmap(file='pic2.png')
rpacf <- pacf(x,par1,main='Partial Autocorrelation',xlab='lags',ylab='PACF')
dev.off()
(myacf <- c(racf$acf))
(mypacf <- c(rpacf$acf))
lengthx <- length(x)
sqrtn <- sqrt(lengthx)
load(file='createtable')
a<-table.start()
a<-table.row.start(a)
a<-table.element(a,'Autocorrelation Function',4,TRUE)
a<-table.row.end(a)
a<-table.row.start(a)
a<-table.element(a,'Time lag k',header=TRUE)
a<-table.element(a,hyperlink('basics.htm','ACF(k)','click here for more information about the Autocorrelation Function'),header=TRUE)
a<-table.element(a,'T-STAT',header=TRUE)
a<-table.element(a,'P-value',header=TRUE)
a<-table.row.end(a)
for (i in 2:(par1+1)) {
a<-table.row.start(a)
a<-table.element(a,i-1,header=TRUE)
a<-table.element(a,round(myacf[i],6))
mytstat <- myacf[i]*sqrtn
a<-table.element(a,round(mytstat,4))
a<-table.element(a,round(1-pt(abs(mytstat),lengthx),6))
a<-table.row.end(a)
}
a<-table.end(a)
table.save(a,file='mytable.tab')
a<-table.start()
a<-table.row.start(a)
a<-table.element(a,'Partial Autocorrelation Function',4,TRUE)
a<-table.row.end(a)
a<-table.row.start(a)
a<-table.element(a,'Time lag k',header=TRUE)
a<-table.element(a,hyperlink('basics.htm','PACF(k)','click here for more information about the Partial Autocorrelation Function'),header=TRUE)
a<-table.element(a,'T-STAT',header=TRUE)
a<-table.element(a,'P-value',header=TRUE)
a<-table.row.end(a)
for (i in 1:par1) {
a<-table.row.start(a)
a<-table.element(a,i,header=TRUE)
a<-table.element(a,round(mypacf[i],6))
mytstat <- mypacf[i]*sqrtn
a<-table.element(a,round(mytstat,4))
a<-table.element(a,round(1-pt(abs(mytstat),lengthx),6))
a<-table.row.end(a)
}
a<-table.end(a)
table.save(a,file='mytable1.tab')