Free Statistics

of Irreproducible Research!

Author's title

Author*Unverified author*
R Software Modulerwasp_autocorrelation.wasp
Title produced by software(Partial) Autocorrelation Function
Date of computationThu, 18 Dec 2008 11:33:38 -0700
Cite this page as followsStatistical Computations at FreeStatistics.org, Office for Research Development and Education, URL https://freestatistics.org/blog/index.php?v=date/2008/Dec/18/t12296253685pyf7ovpui0qev4.htm/, Retrieved Sat, 11 May 2024 06:01:46 +0000
Statistical Computations at FreeStatistics.org, Office for Research Development and Education, URL https://freestatistics.org/blog/index.php?pk=34921, Retrieved Sat, 11 May 2024 06:01:46 +0000
QR Codes:

Original text written by user:
IsPrivate?No (this computation is public)
User-defined keywordssteven paper
Estimated Impact130
Family? (F = Feedback message, R = changed R code, M = changed R Module, P = changed Parameters, D = changed Data)
-     [Univariate Data Series] [data set] [2008-12-01 19:54:57] [b98453cac15ba1066b407e146608df68]
- RMPD  [(Partial) Autocorrelation Function] [] [2008-12-06 14:21:45] [74be16979710d4c4e7c6647856088456]
-   P       [(Partial) Autocorrelation Function] [] [2008-12-18 18:33:38] [b5c0979bf79a38ace87e0d3abace1ca1] [Current]
Feedback Forum

Post a new message
Dataseries X:
104.3
119.8
116.8
118.2
107.4
110.8
94.8
96.5
113.4
109.8
118.7
117.2
110.3
111.6
128.1
121.3
107.3
120.5
98.5
97.7
113.2
114.6
118.3
123.9
113.6
117.5
130.1
124.7
114.2
127.3
105.9
101.5
120.2
117.1
131.1
130
120.6
123.1
135.3
134.1
123.7
134.6
108.3
110.4
127.8
126.6
131.4
141.1
127
127.3
143.6
149.4
126.6
136.5
116
118
131.4
140.7
144.9
143.9
127.1


Summary of computational transaction
Raw Inputview raw input (R code)
Raw Outputview raw output of R engine
Computing time1 seconds
R Server'George Udny Yule' @ 72.249.76.132

\begin{tabular}{lllllllll}
\hline
Summary of computational transaction \tabularnewline
Raw Input & view raw input (R code)  \tabularnewline
Raw Output & view raw output of R engine  \tabularnewline
Computing time & 1 seconds \tabularnewline
R Server & 'George Udny Yule' @ 72.249.76.132 \tabularnewline
\hline
\end{tabular}
%Source: https://freestatistics.org/blog/index.php?pk=34921&T=0

[TABLE]
[ROW][C]Summary of computational transaction[/C][/ROW]
[ROW][C]Raw Input[/C][C]view raw input (R code) [/C][/ROW]
[ROW][C]Raw Output[/C][C]view raw output of R engine [/C][/ROW]
[ROW][C]Computing time[/C][C]1 seconds[/C][/ROW]
[ROW][C]R Server[/C][C]'George Udny Yule' @ 72.249.76.132[/C][/ROW]
[/TABLE]
Source: https://freestatistics.org/blog/index.php?pk=34921&T=0

Globally Unique Identifier (entire table): ba.freestatistics.org/blog/index.php?pk=34921&T=0

As an alternative you can also use a QR Code:  

The GUIDs for individual cells are displayed in the table below:

Summary of computational transaction
Raw Inputview raw input (R code)
Raw Outputview raw output of R engine
Computing time1 seconds
R Server'George Udny Yule' @ 72.249.76.132


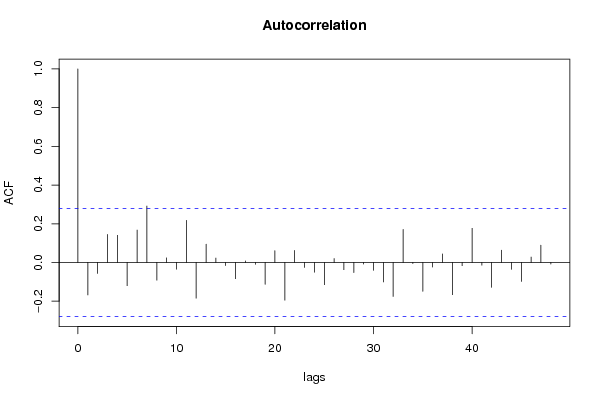
Autocorrelation Function
Time lag kACF(k)T-STATP-value
1-0.167532-1.17270.123287
2-0.056633-0.39640.346754
30.1445491.01180.158291
40.1400950.98070.165787
5-0.120154-0.84110.202196
60.167541.17280.123277
70.2915672.0410.02333
8-0.091863-0.6430.261598
90.0237660.16640.434279
10-0.034984-0.24490.403784
110.2175151.52260.067143
12-0.1845-1.29150.101294
130.0946610.66260.255337
140.022530.15770.437668
15-0.016231-0.11360.455003
16-0.083966-0.58780.279695
170.0079990.0560.477789
18-0.009558-0.06690.473466
19-0.112629-0.78840.21713
200.0606730.42470.336452
21-0.19498-1.36490.089266
220.0624330.4370.332004
23-0.025689-0.17980.429017
24-0.050007-0.35010.363901
25-0.115113-0.80580.212129
260.0203720.14260.443594
27-0.037517-0.26260.396972
28-0.052081-0.36460.358503
29-0.008532-0.05970.476309
30-0.040749-0.28520.388331
31-0.100848-0.70590.241786
32-0.175809-1.23070.112162
330.1704761.19330.119242
34-0.005598-0.03920.48445
35-0.149307-1.04510.150542
36-0.023523-0.16470.434943
370.0438640.30710.380053
38-0.166738-1.16720.124396
39-0.016657-0.11660.453826
400.1764211.23490.11137
41-0.014079-0.09860.460948
42-0.128135-0.89690.187066
430.0633980.44380.329575
44-0.035418-0.24790.402614
45-0.09832-0.68820.247274
460.0281550.19710.422287
470.0892880.6250.267429
48-0.008156-0.05710.477351
49NANANA
50NANANA
51NANANA
52NANANA
53NANANA
54NANANA
55NANANA
56NANANA
57NANANA
58NANANA
59NANANA
60NANANA

\begin{tabular}{lllllllll}
\hline
Autocorrelation Function \tabularnewline
Time lag k & ACF(k) & T-STAT & P-value \tabularnewline
1 & -0.167532 & -1.1727 & 0.123287 \tabularnewline
2 & -0.056633 & -0.3964 & 0.346754 \tabularnewline
3 & 0.144549 & 1.0118 & 0.158291 \tabularnewline
4 & 0.140095 & 0.9807 & 0.165787 \tabularnewline
5 & -0.120154 & -0.8411 & 0.202196 \tabularnewline
6 & 0.16754 & 1.1728 & 0.123277 \tabularnewline
7 & 0.291567 & 2.041 & 0.02333 \tabularnewline
8 & -0.091863 & -0.643 & 0.261598 \tabularnewline
9 & 0.023766 & 0.1664 & 0.434279 \tabularnewline
10 & -0.034984 & -0.2449 & 0.403784 \tabularnewline
11 & 0.217515 & 1.5226 & 0.067143 \tabularnewline
12 & -0.1845 & -1.2915 & 0.101294 \tabularnewline
13 & 0.094661 & 0.6626 & 0.255337 \tabularnewline
14 & 0.02253 & 0.1577 & 0.437668 \tabularnewline
15 & -0.016231 & -0.1136 & 0.455003 \tabularnewline
16 & -0.083966 & -0.5878 & 0.279695 \tabularnewline
17 & 0.007999 & 0.056 & 0.477789 \tabularnewline
18 & -0.009558 & -0.0669 & 0.473466 \tabularnewline
19 & -0.112629 & -0.7884 & 0.21713 \tabularnewline
20 & 0.060673 & 0.4247 & 0.336452 \tabularnewline
21 & -0.19498 & -1.3649 & 0.089266 \tabularnewline
22 & 0.062433 & 0.437 & 0.332004 \tabularnewline
23 & -0.025689 & -0.1798 & 0.429017 \tabularnewline
24 & -0.050007 & -0.3501 & 0.363901 \tabularnewline
25 & -0.115113 & -0.8058 & 0.212129 \tabularnewline
26 & 0.020372 & 0.1426 & 0.443594 \tabularnewline
27 & -0.037517 & -0.2626 & 0.396972 \tabularnewline
28 & -0.052081 & -0.3646 & 0.358503 \tabularnewline
29 & -0.008532 & -0.0597 & 0.476309 \tabularnewline
30 & -0.040749 & -0.2852 & 0.388331 \tabularnewline
31 & -0.100848 & -0.7059 & 0.241786 \tabularnewline
32 & -0.175809 & -1.2307 & 0.112162 \tabularnewline
33 & 0.170476 & 1.1933 & 0.119242 \tabularnewline
34 & -0.005598 & -0.0392 & 0.48445 \tabularnewline
35 & -0.149307 & -1.0451 & 0.150542 \tabularnewline
36 & -0.023523 & -0.1647 & 0.434943 \tabularnewline
37 & 0.043864 & 0.3071 & 0.380053 \tabularnewline
38 & -0.166738 & -1.1672 & 0.124396 \tabularnewline
39 & -0.016657 & -0.1166 & 0.453826 \tabularnewline
40 & 0.176421 & 1.2349 & 0.11137 \tabularnewline
41 & -0.014079 & -0.0986 & 0.460948 \tabularnewline
42 & -0.128135 & -0.8969 & 0.187066 \tabularnewline
43 & 0.063398 & 0.4438 & 0.329575 \tabularnewline
44 & -0.035418 & -0.2479 & 0.402614 \tabularnewline
45 & -0.09832 & -0.6882 & 0.247274 \tabularnewline
46 & 0.028155 & 0.1971 & 0.422287 \tabularnewline
47 & 0.089288 & 0.625 & 0.267429 \tabularnewline
48 & -0.008156 & -0.0571 & 0.477351 \tabularnewline
49 & NA & NA & NA \tabularnewline
50 & NA & NA & NA \tabularnewline
51 & NA & NA & NA \tabularnewline
52 & NA & NA & NA \tabularnewline
53 & NA & NA & NA \tabularnewline
54 & NA & NA & NA \tabularnewline
55 & NA & NA & NA \tabularnewline
56 & NA & NA & NA \tabularnewline
57 & NA & NA & NA \tabularnewline
58 & NA & NA & NA \tabularnewline
59 & NA & NA & NA \tabularnewline
60 & NA & NA & NA \tabularnewline
\hline
\end{tabular}
%Source: https://freestatistics.org/blog/index.php?pk=34921&T=1

[TABLE]
[ROW][C]Autocorrelation Function[/C][/ROW]
[ROW][C]Time lag k[/C][C]ACF(k)[/C][C]T-STAT[/C][C]P-value[/C][/ROW]
[ROW][C]1[/C][C]-0.167532[/C][C]-1.1727[/C][C]0.123287[/C][/ROW]
[ROW][C]2[/C][C]-0.056633[/C][C]-0.3964[/C][C]0.346754[/C][/ROW]
[ROW][C]3[/C][C]0.144549[/C][C]1.0118[/C][C]0.158291[/C][/ROW]
[ROW][C]4[/C][C]0.140095[/C][C]0.9807[/C][C]0.165787[/C][/ROW]
[ROW][C]5[/C][C]-0.120154[/C][C]-0.8411[/C][C]0.202196[/C][/ROW]
[ROW][C]6[/C][C]0.16754[/C][C]1.1728[/C][C]0.123277[/C][/ROW]
[ROW][C]7[/C][C]0.291567[/C][C]2.041[/C][C]0.02333[/C][/ROW]
[ROW][C]8[/C][C]-0.091863[/C][C]-0.643[/C][C]0.261598[/C][/ROW]
[ROW][C]9[/C][C]0.023766[/C][C]0.1664[/C][C]0.434279[/C][/ROW]
[ROW][C]10[/C][C]-0.034984[/C][C]-0.2449[/C][C]0.403784[/C][/ROW]
[ROW][C]11[/C][C]0.217515[/C][C]1.5226[/C][C]0.067143[/C][/ROW]
[ROW][C]12[/C][C]-0.1845[/C][C]-1.2915[/C][C]0.101294[/C][/ROW]
[ROW][C]13[/C][C]0.094661[/C][C]0.6626[/C][C]0.255337[/C][/ROW]
[ROW][C]14[/C][C]0.02253[/C][C]0.1577[/C][C]0.437668[/C][/ROW]
[ROW][C]15[/C][C]-0.016231[/C][C]-0.1136[/C][C]0.455003[/C][/ROW]
[ROW][C]16[/C][C]-0.083966[/C][C]-0.5878[/C][C]0.279695[/C][/ROW]
[ROW][C]17[/C][C]0.007999[/C][C]0.056[/C][C]0.477789[/C][/ROW]
[ROW][C]18[/C][C]-0.009558[/C][C]-0.0669[/C][C]0.473466[/C][/ROW]
[ROW][C]19[/C][C]-0.112629[/C][C]-0.7884[/C][C]0.21713[/C][/ROW]
[ROW][C]20[/C][C]0.060673[/C][C]0.4247[/C][C]0.336452[/C][/ROW]
[ROW][C]21[/C][C]-0.19498[/C][C]-1.3649[/C][C]0.089266[/C][/ROW]
[ROW][C]22[/C][C]0.062433[/C][C]0.437[/C][C]0.332004[/C][/ROW]
[ROW][C]23[/C][C]-0.025689[/C][C]-0.1798[/C][C]0.429017[/C][/ROW]
[ROW][C]24[/C][C]-0.050007[/C][C]-0.3501[/C][C]0.363901[/C][/ROW]
[ROW][C]25[/C][C]-0.115113[/C][C]-0.8058[/C][C]0.212129[/C][/ROW]
[ROW][C]26[/C][C]0.020372[/C][C]0.1426[/C][C]0.443594[/C][/ROW]
[ROW][C]27[/C][C]-0.037517[/C][C]-0.2626[/C][C]0.396972[/C][/ROW]
[ROW][C]28[/C][C]-0.052081[/C][C]-0.3646[/C][C]0.358503[/C][/ROW]
[ROW][C]29[/C][C]-0.008532[/C][C]-0.0597[/C][C]0.476309[/C][/ROW]
[ROW][C]30[/C][C]-0.040749[/C][C]-0.2852[/C][C]0.388331[/C][/ROW]
[ROW][C]31[/C][C]-0.100848[/C][C]-0.7059[/C][C]0.241786[/C][/ROW]
[ROW][C]32[/C][C]-0.175809[/C][C]-1.2307[/C][C]0.112162[/C][/ROW]
[ROW][C]33[/C][C]0.170476[/C][C]1.1933[/C][C]0.119242[/C][/ROW]
[ROW][C]34[/C][C]-0.005598[/C][C]-0.0392[/C][C]0.48445[/C][/ROW]
[ROW][C]35[/C][C]-0.149307[/C][C]-1.0451[/C][C]0.150542[/C][/ROW]
[ROW][C]36[/C][C]-0.023523[/C][C]-0.1647[/C][C]0.434943[/C][/ROW]
[ROW][C]37[/C][C]0.043864[/C][C]0.3071[/C][C]0.380053[/C][/ROW]
[ROW][C]38[/C][C]-0.166738[/C][C]-1.1672[/C][C]0.124396[/C][/ROW]
[ROW][C]39[/C][C]-0.016657[/C][C]-0.1166[/C][C]0.453826[/C][/ROW]
[ROW][C]40[/C][C]0.176421[/C][C]1.2349[/C][C]0.11137[/C][/ROW]
[ROW][C]41[/C][C]-0.014079[/C][C]-0.0986[/C][C]0.460948[/C][/ROW]
[ROW][C]42[/C][C]-0.128135[/C][C]-0.8969[/C][C]0.187066[/C][/ROW]
[ROW][C]43[/C][C]0.063398[/C][C]0.4438[/C][C]0.329575[/C][/ROW]
[ROW][C]44[/C][C]-0.035418[/C][C]-0.2479[/C][C]0.402614[/C][/ROW]
[ROW][C]45[/C][C]-0.09832[/C][C]-0.6882[/C][C]0.247274[/C][/ROW]
[ROW][C]46[/C][C]0.028155[/C][C]0.1971[/C][C]0.422287[/C][/ROW]
[ROW][C]47[/C][C]0.089288[/C][C]0.625[/C][C]0.267429[/C][/ROW]
[ROW][C]48[/C][C]-0.008156[/C][C]-0.0571[/C][C]0.477351[/C][/ROW]
[ROW][C]49[/C][C]NA[/C][C]NA[/C][C]NA[/C][/ROW]
[ROW][C]50[/C][C]NA[/C][C]NA[/C][C]NA[/C][/ROW]
[ROW][C]51[/C][C]NA[/C][C]NA[/C][C]NA[/C][/ROW]
[ROW][C]52[/C][C]NA[/C][C]NA[/C][C]NA[/C][/ROW]
[ROW][C]53[/C][C]NA[/C][C]NA[/C][C]NA[/C][/ROW]
[ROW][C]54[/C][C]NA[/C][C]NA[/C][C]NA[/C][/ROW]
[ROW][C]55[/C][C]NA[/C][C]NA[/C][C]NA[/C][/ROW]
[ROW][C]56[/C][C]NA[/C][C]NA[/C][C]NA[/C][/ROW]
[ROW][C]57[/C][C]NA[/C][C]NA[/C][C]NA[/C][/ROW]
[ROW][C]58[/C][C]NA[/C][C]NA[/C][C]NA[/C][/ROW]
[ROW][C]59[/C][C]NA[/C][C]NA[/C][C]NA[/C][/ROW]
[ROW][C]60[/C][C]NA[/C][C]NA[/C][C]NA[/C][/ROW]
[/TABLE]
Source: https://freestatistics.org/blog/index.php?pk=34921&T=1

Globally Unique Identifier (entire table): ba.freestatistics.org/blog/index.php?pk=34921&T=1

As an alternative you can also use a QR Code:  

The GUIDs for individual cells are displayed in the table below:

Autocorrelation Function
Time lag kACF(k)T-STATP-value
1-0.167532-1.17270.123287
2-0.056633-0.39640.346754
30.1445491.01180.158291
40.1400950.98070.165787
5-0.120154-0.84110.202196
60.167541.17280.123277
70.2915672.0410.02333
8-0.091863-0.6430.261598
90.0237660.16640.434279
10-0.034984-0.24490.403784
110.2175151.52260.067143
12-0.1845-1.29150.101294
130.0946610.66260.255337
140.022530.15770.437668
15-0.016231-0.11360.455003
16-0.083966-0.58780.279695
170.0079990.0560.477789
18-0.009558-0.06690.473466
19-0.112629-0.78840.21713
200.0606730.42470.336452
21-0.19498-1.36490.089266
220.0624330.4370.332004
23-0.025689-0.17980.429017
24-0.050007-0.35010.363901
25-0.115113-0.80580.212129
260.0203720.14260.443594
27-0.037517-0.26260.396972
28-0.052081-0.36460.358503
29-0.008532-0.05970.476309
30-0.040749-0.28520.388331
31-0.100848-0.70590.241786
32-0.175809-1.23070.112162
330.1704761.19330.119242
34-0.005598-0.03920.48445
35-0.149307-1.04510.150542
36-0.023523-0.16470.434943
370.0438640.30710.380053
38-0.166738-1.16720.124396
39-0.016657-0.11660.453826
400.1764211.23490.11137
41-0.014079-0.09860.460948
42-0.128135-0.89690.187066
430.0633980.44380.329575
44-0.035418-0.24790.402614
45-0.09832-0.68820.247274
460.0281550.19710.422287
470.0892880.6250.267429
48-0.008156-0.05710.477351
49NANANA
50NANANA
51NANANA
52NANANA
53NANANA
54NANANA
55NANANA
56NANANA
57NANANA
58NANANA
59NANANA
60NANANA


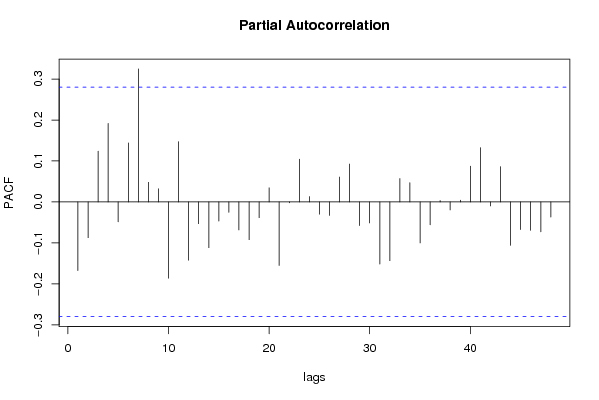
Partial Autocorrelation Function
Time lag kPACF(k)T-STATP-value
1-0.167532-1.17270.123287
2-0.087146-0.610.272333
30.1240310.86820.194753
40.1916191.34130.092998
5-0.048416-0.33890.368062
60.1439231.00750.159332
70.3246132.27230.013747
80.0479340.33550.369327
90.0319810.22390.411897
10-0.186273-1.30390.099178
110.1471871.03030.153962
12-0.142119-0.99480.162352
13-0.053053-0.37140.355982
14-0.11176-0.78230.218895
15-0.046655-0.32660.372686
16-0.025195-0.17640.430366
17-0.068382-0.47870.31715
18-0.092144-0.6450.260965
19-0.038315-0.26820.394834
200.034620.24230.404764
21-0.155117-1.08580.141436
22-0.002198-0.01540.493893
230.1043040.73010.234395
240.0132590.09280.463216
25-0.029859-0.2090.417653
26-0.032796-0.22960.40969
270.060630.42440.336562
280.0923750.64660.260445
29-0.057589-0.40310.344305
30-0.051354-0.35950.36039
31-0.151639-1.06150.146839
32-0.143404-1.00380.160197
330.057030.39920.345736
340.0471410.330.371409
35-0.1-0.70.243619
36-0.055813-0.39070.348859
370.0032420.02270.490993
38-0.019507-0.13650.445974
390.0042630.02980.488156
400.087230.61060.272139
410.1322930.92610.179479
42-0.00982-0.06870.472737
430.0860250.60220.274916
44-0.105807-0.74060.23122
45-0.067567-0.4730.319168
46-0.069163-0.48410.315222
47-0.072778-0.50940.306364
48-0.036924-0.25850.398565
49NANANA
50NANANA
51NANANA
52NANANA
53NANANA
54NANANA
55NANANA
56NANANA
57NANANA
58NANANA
59NANANA
60NANANA

\begin{tabular}{lllllllll}
\hline
Partial Autocorrelation Function \tabularnewline
Time lag k & PACF(k) & T-STAT & P-value \tabularnewline
1 & -0.167532 & -1.1727 & 0.123287 \tabularnewline
2 & -0.087146 & -0.61 & 0.272333 \tabularnewline
3 & 0.124031 & 0.8682 & 0.194753 \tabularnewline
4 & 0.191619 & 1.3413 & 0.092998 \tabularnewline
5 & -0.048416 & -0.3389 & 0.368062 \tabularnewline
6 & 0.143923 & 1.0075 & 0.159332 \tabularnewline
7 & 0.324613 & 2.2723 & 0.013747 \tabularnewline
8 & 0.047934 & 0.3355 & 0.369327 \tabularnewline
9 & 0.031981 & 0.2239 & 0.411897 \tabularnewline
10 & -0.186273 & -1.3039 & 0.099178 \tabularnewline
11 & 0.147187 & 1.0303 & 0.153962 \tabularnewline
12 & -0.142119 & -0.9948 & 0.162352 \tabularnewline
13 & -0.053053 & -0.3714 & 0.355982 \tabularnewline
14 & -0.11176 & -0.7823 & 0.218895 \tabularnewline
15 & -0.046655 & -0.3266 & 0.372686 \tabularnewline
16 & -0.025195 & -0.1764 & 0.430366 \tabularnewline
17 & -0.068382 & -0.4787 & 0.31715 \tabularnewline
18 & -0.092144 & -0.645 & 0.260965 \tabularnewline
19 & -0.038315 & -0.2682 & 0.394834 \tabularnewline
20 & 0.03462 & 0.2423 & 0.404764 \tabularnewline
21 & -0.155117 & -1.0858 & 0.141436 \tabularnewline
22 & -0.002198 & -0.0154 & 0.493893 \tabularnewline
23 & 0.104304 & 0.7301 & 0.234395 \tabularnewline
24 & 0.013259 & 0.0928 & 0.463216 \tabularnewline
25 & -0.029859 & -0.209 & 0.417653 \tabularnewline
26 & -0.032796 & -0.2296 & 0.40969 \tabularnewline
27 & 0.06063 & 0.4244 & 0.336562 \tabularnewline
28 & 0.092375 & 0.6466 & 0.260445 \tabularnewline
29 & -0.057589 & -0.4031 & 0.344305 \tabularnewline
30 & -0.051354 & -0.3595 & 0.36039 \tabularnewline
31 & -0.151639 & -1.0615 & 0.146839 \tabularnewline
32 & -0.143404 & -1.0038 & 0.160197 \tabularnewline
33 & 0.05703 & 0.3992 & 0.345736 \tabularnewline
34 & 0.047141 & 0.33 & 0.371409 \tabularnewline
35 & -0.1 & -0.7 & 0.243619 \tabularnewline
36 & -0.055813 & -0.3907 & 0.348859 \tabularnewline
37 & 0.003242 & 0.0227 & 0.490993 \tabularnewline
38 & -0.019507 & -0.1365 & 0.445974 \tabularnewline
39 & 0.004263 & 0.0298 & 0.488156 \tabularnewline
40 & 0.08723 & 0.6106 & 0.272139 \tabularnewline
41 & 0.132293 & 0.9261 & 0.179479 \tabularnewline
42 & -0.00982 & -0.0687 & 0.472737 \tabularnewline
43 & 0.086025 & 0.6022 & 0.274916 \tabularnewline
44 & -0.105807 & -0.7406 & 0.23122 \tabularnewline
45 & -0.067567 & -0.473 & 0.319168 \tabularnewline
46 & -0.069163 & -0.4841 & 0.315222 \tabularnewline
47 & -0.072778 & -0.5094 & 0.306364 \tabularnewline
48 & -0.036924 & -0.2585 & 0.398565 \tabularnewline
49 & NA & NA & NA \tabularnewline
50 & NA & NA & NA \tabularnewline
51 & NA & NA & NA \tabularnewline
52 & NA & NA & NA \tabularnewline
53 & NA & NA & NA \tabularnewline
54 & NA & NA & NA \tabularnewline
55 & NA & NA & NA \tabularnewline
56 & NA & NA & NA \tabularnewline
57 & NA & NA & NA \tabularnewline
58 & NA & NA & NA \tabularnewline
59 & NA & NA & NA \tabularnewline
60 & NA & NA & NA \tabularnewline
\hline
\end{tabular}
%Source: https://freestatistics.org/blog/index.php?pk=34921&T=2

[TABLE]
[ROW][C]Partial Autocorrelation Function[/C][/ROW]
[ROW][C]Time lag k[/C][C]PACF(k)[/C][C]T-STAT[/C][C]P-value[/C][/ROW]
[ROW][C]1[/C][C]-0.167532[/C][C]-1.1727[/C][C]0.123287[/C][/ROW]
[ROW][C]2[/C][C]-0.087146[/C][C]-0.61[/C][C]0.272333[/C][/ROW]
[ROW][C]3[/C][C]0.124031[/C][C]0.8682[/C][C]0.194753[/C][/ROW]
[ROW][C]4[/C][C]0.191619[/C][C]1.3413[/C][C]0.092998[/C][/ROW]
[ROW][C]5[/C][C]-0.048416[/C][C]-0.3389[/C][C]0.368062[/C][/ROW]
[ROW][C]6[/C][C]0.143923[/C][C]1.0075[/C][C]0.159332[/C][/ROW]
[ROW][C]7[/C][C]0.324613[/C][C]2.2723[/C][C]0.013747[/C][/ROW]
[ROW][C]8[/C][C]0.047934[/C][C]0.3355[/C][C]0.369327[/C][/ROW]
[ROW][C]9[/C][C]0.031981[/C][C]0.2239[/C][C]0.411897[/C][/ROW]
[ROW][C]10[/C][C]-0.186273[/C][C]-1.3039[/C][C]0.099178[/C][/ROW]
[ROW][C]11[/C][C]0.147187[/C][C]1.0303[/C][C]0.153962[/C][/ROW]
[ROW][C]12[/C][C]-0.142119[/C][C]-0.9948[/C][C]0.162352[/C][/ROW]
[ROW][C]13[/C][C]-0.053053[/C][C]-0.3714[/C][C]0.355982[/C][/ROW]
[ROW][C]14[/C][C]-0.11176[/C][C]-0.7823[/C][C]0.218895[/C][/ROW]
[ROW][C]15[/C][C]-0.046655[/C][C]-0.3266[/C][C]0.372686[/C][/ROW]
[ROW][C]16[/C][C]-0.025195[/C][C]-0.1764[/C][C]0.430366[/C][/ROW]
[ROW][C]17[/C][C]-0.068382[/C][C]-0.4787[/C][C]0.31715[/C][/ROW]
[ROW][C]18[/C][C]-0.092144[/C][C]-0.645[/C][C]0.260965[/C][/ROW]
[ROW][C]19[/C][C]-0.038315[/C][C]-0.2682[/C][C]0.394834[/C][/ROW]
[ROW][C]20[/C][C]0.03462[/C][C]0.2423[/C][C]0.404764[/C][/ROW]
[ROW][C]21[/C][C]-0.155117[/C][C]-1.0858[/C][C]0.141436[/C][/ROW]
[ROW][C]22[/C][C]-0.002198[/C][C]-0.0154[/C][C]0.493893[/C][/ROW]
[ROW][C]23[/C][C]0.104304[/C][C]0.7301[/C][C]0.234395[/C][/ROW]
[ROW][C]24[/C][C]0.013259[/C][C]0.0928[/C][C]0.463216[/C][/ROW]
[ROW][C]25[/C][C]-0.029859[/C][C]-0.209[/C][C]0.417653[/C][/ROW]
[ROW][C]26[/C][C]-0.032796[/C][C]-0.2296[/C][C]0.40969[/C][/ROW]
[ROW][C]27[/C][C]0.06063[/C][C]0.4244[/C][C]0.336562[/C][/ROW]
[ROW][C]28[/C][C]0.092375[/C][C]0.6466[/C][C]0.260445[/C][/ROW]
[ROW][C]29[/C][C]-0.057589[/C][C]-0.4031[/C][C]0.344305[/C][/ROW]
[ROW][C]30[/C][C]-0.051354[/C][C]-0.3595[/C][C]0.36039[/C][/ROW]
[ROW][C]31[/C][C]-0.151639[/C][C]-1.0615[/C][C]0.146839[/C][/ROW]
[ROW][C]32[/C][C]-0.143404[/C][C]-1.0038[/C][C]0.160197[/C][/ROW]
[ROW][C]33[/C][C]0.05703[/C][C]0.3992[/C][C]0.345736[/C][/ROW]
[ROW][C]34[/C][C]0.047141[/C][C]0.33[/C][C]0.371409[/C][/ROW]
[ROW][C]35[/C][C]-0.1[/C][C]-0.7[/C][C]0.243619[/C][/ROW]
[ROW][C]36[/C][C]-0.055813[/C][C]-0.3907[/C][C]0.348859[/C][/ROW]
[ROW][C]37[/C][C]0.003242[/C][C]0.0227[/C][C]0.490993[/C][/ROW]
[ROW][C]38[/C][C]-0.019507[/C][C]-0.1365[/C][C]0.445974[/C][/ROW]
[ROW][C]39[/C][C]0.004263[/C][C]0.0298[/C][C]0.488156[/C][/ROW]
[ROW][C]40[/C][C]0.08723[/C][C]0.6106[/C][C]0.272139[/C][/ROW]
[ROW][C]41[/C][C]0.132293[/C][C]0.9261[/C][C]0.179479[/C][/ROW]
[ROW][C]42[/C][C]-0.00982[/C][C]-0.0687[/C][C]0.472737[/C][/ROW]
[ROW][C]43[/C][C]0.086025[/C][C]0.6022[/C][C]0.274916[/C][/ROW]
[ROW][C]44[/C][C]-0.105807[/C][C]-0.7406[/C][C]0.23122[/C][/ROW]
[ROW][C]45[/C][C]-0.067567[/C][C]-0.473[/C][C]0.319168[/C][/ROW]
[ROW][C]46[/C][C]-0.069163[/C][C]-0.4841[/C][C]0.315222[/C][/ROW]
[ROW][C]47[/C][C]-0.072778[/C][C]-0.5094[/C][C]0.306364[/C][/ROW]
[ROW][C]48[/C][C]-0.036924[/C][C]-0.2585[/C][C]0.398565[/C][/ROW]
[ROW][C]49[/C][C]NA[/C][C]NA[/C][C]NA[/C][/ROW]
[ROW][C]50[/C][C]NA[/C][C]NA[/C][C]NA[/C][/ROW]
[ROW][C]51[/C][C]NA[/C][C]NA[/C][C]NA[/C][/ROW]
[ROW][C]52[/C][C]NA[/C][C]NA[/C][C]NA[/C][/ROW]
[ROW][C]53[/C][C]NA[/C][C]NA[/C][C]NA[/C][/ROW]
[ROW][C]54[/C][C]NA[/C][C]NA[/C][C]NA[/C][/ROW]
[ROW][C]55[/C][C]NA[/C][C]NA[/C][C]NA[/C][/ROW]
[ROW][C]56[/C][C]NA[/C][C]NA[/C][C]NA[/C][/ROW]
[ROW][C]57[/C][C]NA[/C][C]NA[/C][C]NA[/C][/ROW]
[ROW][C]58[/C][C]NA[/C][C]NA[/C][C]NA[/C][/ROW]
[ROW][C]59[/C][C]NA[/C][C]NA[/C][C]NA[/C][/ROW]
[ROW][C]60[/C][C]NA[/C][C]NA[/C][C]NA[/C][/ROW]
[/TABLE]
Source: https://freestatistics.org/blog/index.php?pk=34921&T=2

Globally Unique Identifier (entire table): ba.freestatistics.org/blog/index.php?pk=34921&T=2

As an alternative you can also use a QR Code:  

The GUIDs for individual cells are displayed in the table below:

Partial Autocorrelation Function
Time lag kPACF(k)T-STATP-value
1-0.167532-1.17270.123287
2-0.087146-0.610.272333
30.1240310.86820.194753
40.1916191.34130.092998
5-0.048416-0.33890.368062
60.1439231.00750.159332
70.3246132.27230.013747
80.0479340.33550.369327
90.0319810.22390.411897
10-0.186273-1.30390.099178
110.1471871.03030.153962
12-0.142119-0.99480.162352
13-0.053053-0.37140.355982
14-0.11176-0.78230.218895
15-0.046655-0.32660.372686
16-0.025195-0.17640.430366
17-0.068382-0.47870.31715
18-0.092144-0.6450.260965
19-0.038315-0.26820.394834
200.034620.24230.404764
21-0.155117-1.08580.141436
22-0.002198-0.01540.493893
230.1043040.73010.234395
240.0132590.09280.463216
25-0.029859-0.2090.417653
26-0.032796-0.22960.40969
270.060630.42440.336562
280.0923750.64660.260445
29-0.057589-0.40310.344305
30-0.051354-0.35950.36039
31-0.151639-1.06150.146839
32-0.143404-1.00380.160197
330.057030.39920.345736
340.0471410.330.371409
35-0.1-0.70.243619
36-0.055813-0.39070.348859
370.0032420.02270.490993
38-0.019507-0.13650.445974
390.0042630.02980.488156
400.087230.61060.272139
410.1322930.92610.179479
42-0.00982-0.06870.472737
430.0860250.60220.274916
44-0.105807-0.74060.23122
45-0.067567-0.4730.319168
46-0.069163-0.48410.315222
47-0.072778-0.50940.306364
48-0.036924-0.25850.398565
49NANANA
50NANANA
51NANANA
52NANANA
53NANANA
54NANANA
55NANANA
56NANANA
57NANANA
58NANANA
59NANANA
60NANANA


Parameters (Session):
par1 = 60 ; par2 = -0.1 ; par3 = 0 ; par4 = 1 ; par5 = 12 ;
Parameters (R input):
par1 = 60 ; par2 = -0.1 ; par3 = 0 ; par4 = 1 ; par5 = 12 ;
R code (references can be found in the software module):
if (par1 == 'Default') {
par1 = 10*log10(length(x))
} else {
par1 <- as.numeric(par1)
}
par2 <- as.numeric(par2)
par3 <- as.numeric(par3)
par4 <- as.numeric(par4)
par5 <- as.numeric(par5)
if (par2 == 0) {
x <- log(x)
} else {
x <- (x ^ par2 - 1) / par2
}
if (par3 > 0) x <- diff(x,lag=1,difference=par3)
if (par4 > 0) x <- diff(x,lag=par5,difference=par4)
bitmap(file='pic1.png')
racf <- acf(x,par1,main='Autocorrelation',xlab='lags',ylab='ACF')
dev.off()
bitmap(file='pic2.png')
rpacf <- pacf(x,par1,main='Partial Autocorrelation',xlab='lags',ylab='PACF')
dev.off()
(myacf <- c(racf$acf))
(mypacf <- c(rpacf$acf))
lengthx <- length(x)
sqrtn <- sqrt(lengthx)
load(file='createtable')
a<-table.start()
a<-table.row.start(a)
a<-table.element(a,'Autocorrelation Function',4,TRUE)
a<-table.row.end(a)
a<-table.row.start(a)
a<-table.element(a,'Time lag k',header=TRUE)
a<-table.element(a,hyperlink('basics.htm','ACF(k)','click here for more information about the Autocorrelation Function'),header=TRUE)
a<-table.element(a,'T-STAT',header=TRUE)
a<-table.element(a,'P-value',header=TRUE)
a<-table.row.end(a)
for (i in 2:(par1+1)) {
a<-table.row.start(a)
a<-table.element(a,i-1,header=TRUE)
a<-table.element(a,round(myacf[i],6))
mytstat <- myacf[i]*sqrtn
a<-table.element(a,round(mytstat,4))
a<-table.element(a,round(1-pt(abs(mytstat),lengthx),6))
a<-table.row.end(a)
}
a<-table.end(a)
table.save(a,file='mytable.tab')
a<-table.start()
a<-table.row.start(a)
a<-table.element(a,'Partial Autocorrelation Function',4,TRUE)
a<-table.row.end(a)
a<-table.row.start(a)
a<-table.element(a,'Time lag k',header=TRUE)
a<-table.element(a,hyperlink('basics.htm','PACF(k)','click here for more information about the Partial Autocorrelation Function'),header=TRUE)
a<-table.element(a,'T-STAT',header=TRUE)
a<-table.element(a,'P-value',header=TRUE)
a<-table.row.end(a)
for (i in 1:par1) {
a<-table.row.start(a)
a<-table.element(a,i,header=TRUE)
a<-table.element(a,round(mypacf[i],6))
mytstat <- mypacf[i]*sqrtn
a<-table.element(a,round(mytstat,4))
a<-table.element(a,round(1-pt(abs(mytstat),lengthx),6))
a<-table.row.end(a)
}
a<-table.end(a)
table.save(a,file='mytable1.tab')