Free Statistics

of Irreproducible Research!

Author's title

Author*Unverified author*
R Software Modulerwasp_autocorrelation.wasp
Title produced by software(Partial) Autocorrelation Function
Date of computationSat, 06 Dec 2008 07:21:45 -0700
Cite this page as followsStatistical Computations at FreeStatistics.org, Office for Research Development and Education, URL https://freestatistics.org/blog/index.php?v=date/2008/Dec/06/t1228573335mzk6tc2ewqvgqhv.htm/, Retrieved Fri, 24 May 2024 06:02:34 +0000
Statistical Computations at FreeStatistics.org, Office for Research Development and Education, URL https://freestatistics.org/blog/index.php?pk=29635, Retrieved Fri, 24 May 2024 06:02:34 +0000
QR Codes:

Original text written by user:
IsPrivate?No (this computation is public)
User-defined keywordskleuter
Estimated Impact177
Family? (F = Feedback message, R = changed R code, M = changed R Module, P = changed Parameters, D = changed Data)
-     [Univariate Data Series] [data set] [2008-12-01 19:54:57] [b98453cac15ba1066b407e146608df68]
- RMPD    [(Partial) Autocorrelation Function] [] [2008-12-06 14:21:45] [d41d8cd98f00b204e9800998ecf8427e] [Current]
-   P       [(Partial) Autocorrelation Function] [] [2008-12-18 18:33:38] [488d9a19d3c63b747ac6ad96017e55c8]
Feedback Forum

Post a new message
Dataseries X:
104.3
119.8
116.8
118.2
107.4
110.8
94.8
96.5
113.4
109.8
118.7
117.2
110.3
111.6
128.1
121.3
107.3
120.5
98.5
97.7
113.2
114.6
118.3
123.9
113.6
117.5
130.1
124.7
114.2
127.3
105.9
101.5
120.2
117.1
131.1
130
120.6
123.1
135.3
134.1
123.7
134.6
108.3
110.4
127.8
126.6
131.4
141.1
127
127.3
143.6
149.4
126.6
136.5
116
118
131.4
140.7
144.9
143.9
127.1


Summary of computational transaction
Raw Inputview raw input (R code)
Raw Outputview raw output of R engine
Computing time1 seconds
R Server'George Udny Yule' @ 72.249.76.132

\begin{tabular}{lllllllll}
\hline
Summary of computational transaction \tabularnewline
Raw Input & view raw input (R code)  \tabularnewline
Raw Output & view raw output of R engine  \tabularnewline
Computing time & 1 seconds \tabularnewline
R Server & 'George Udny Yule' @ 72.249.76.132 \tabularnewline
\hline
\end{tabular}
%Source: https://freestatistics.org/blog/index.php?pk=29635&T=0

[TABLE]
[ROW][C]Summary of computational transaction[/C][/ROW]
[ROW][C]Raw Input[/C][C]view raw input (R code) [/C][/ROW]
[ROW][C]Raw Output[/C][C]view raw output of R engine [/C][/ROW]
[ROW][C]Computing time[/C][C]1 seconds[/C][/ROW]
[ROW][C]R Server[/C][C]'George Udny Yule' @ 72.249.76.132[/C][/ROW]
[/TABLE]
Source: https://freestatistics.org/blog/index.php?pk=29635&T=0

Globally Unique Identifier (entire table): ba.freestatistics.org/blog/index.php?pk=29635&T=0

As an alternative you can also use a QR Code:  

The GUIDs for individual cells are displayed in the table below:

Summary of computational transaction
Raw Inputview raw input (R code)
Raw Outputview raw output of R engine
Computing time1 seconds
R Server'George Udny Yule' @ 72.249.76.132


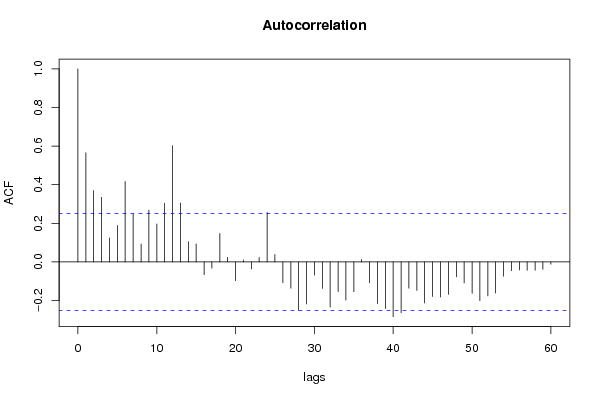
Autocorrelation Function
Time lag kACF(k)T-STATP-value
10.5653114.41522.1e-05
20.3699122.88910.002671
30.3344322.6120.005658
40.1242540.97050.167826
50.1892341.4780.072281
60.4170213.2570.00092
70.2463161.92380.029525
80.0926340.72350.236071
90.2678462.09190.020307
100.1964781.53450.065034
110.3043852.37730.010295
120.6031344.71067e-06
130.3052482.38410.010124
140.1044170.81550.208973
150.0928070.72480.235659
16-0.066617-0.52030.30237
17-0.032915-0.25710.398992
180.1473681.1510.127115
190.0237660.18560.426678
20-0.097571-0.76210.224483
210.0102010.07970.468379
22-0.036565-0.28560.388084
230.0222080.17350.431435
240.2561332.00050.024953
250.0376570.29410.384837
26-0.108126-0.84450.200847
27-0.136194-1.06370.145826
28-0.251463-1.9640.027046
29-0.218344-1.70530.046612
30-0.068188-0.53260.298135
31-0.13734-1.07270.143825
32-0.234214-1.82930.036124
33-0.153729-1.20070.117262
34-0.198178-1.54780.063419
35-0.154215-1.20450.116533
360.0129870.10140.459769
37-0.108557-0.84790.199916
38-0.215912-1.68630.048421
39-0.241793-1.88850.031861
40-0.283843-2.21690.015184
41-0.263983-2.06180.021749
42-0.136578-1.06670.145154
43-0.148005-1.1560.126104
44-0.213063-1.66410.050613
45-0.179581-1.40260.082906
46-0.182565-1.42590.0795
47-0.168809-1.31840.096142
48-0.077459-0.6050.273719
49-0.108894-0.85050.19919
50-0.162731-1.2710.104283
51-0.201308-1.57230.060531
52-0.176235-1.37640.086858
53-0.16158-1.2620.10588
54-0.073949-0.57760.282845
55-0.045322-0.3540.36229
56-0.042016-0.32820.37196
57-0.043813-0.34220.366691
58-0.043286-0.33810.368233
59-0.038788-0.30290.381482
60-0.012021-0.09390.462752

\begin{tabular}{lllllllll}
\hline
Autocorrelation Function \tabularnewline
Time lag k & ACF(k) & T-STAT & P-value \tabularnewline
1 & 0.565311 & 4.4152 & 2.1e-05 \tabularnewline
2 & 0.369912 & 2.8891 & 0.002671 \tabularnewline
3 & 0.334432 & 2.612 & 0.005658 \tabularnewline
4 & 0.124254 & 0.9705 & 0.167826 \tabularnewline
5 & 0.189234 & 1.478 & 0.072281 \tabularnewline
6 & 0.417021 & 3.257 & 0.00092 \tabularnewline
7 & 0.246316 & 1.9238 & 0.029525 \tabularnewline
8 & 0.092634 & 0.7235 & 0.236071 \tabularnewline
9 & 0.267846 & 2.0919 & 0.020307 \tabularnewline
10 & 0.196478 & 1.5345 & 0.065034 \tabularnewline
11 & 0.304385 & 2.3773 & 0.010295 \tabularnewline
12 & 0.603134 & 4.7106 & 7e-06 \tabularnewline
13 & 0.305248 & 2.3841 & 0.010124 \tabularnewline
14 & 0.104417 & 0.8155 & 0.208973 \tabularnewline
15 & 0.092807 & 0.7248 & 0.235659 \tabularnewline
16 & -0.066617 & -0.5203 & 0.30237 \tabularnewline
17 & -0.032915 & -0.2571 & 0.398992 \tabularnewline
18 & 0.147368 & 1.151 & 0.127115 \tabularnewline
19 & 0.023766 & 0.1856 & 0.426678 \tabularnewline
20 & -0.097571 & -0.7621 & 0.224483 \tabularnewline
21 & 0.010201 & 0.0797 & 0.468379 \tabularnewline
22 & -0.036565 & -0.2856 & 0.388084 \tabularnewline
23 & 0.022208 & 0.1735 & 0.431435 \tabularnewline
24 & 0.256133 & 2.0005 & 0.024953 \tabularnewline
25 & 0.037657 & 0.2941 & 0.384837 \tabularnewline
26 & -0.108126 & -0.8445 & 0.200847 \tabularnewline
27 & -0.136194 & -1.0637 & 0.145826 \tabularnewline
28 & -0.251463 & -1.964 & 0.027046 \tabularnewline
29 & -0.218344 & -1.7053 & 0.046612 \tabularnewline
30 & -0.068188 & -0.5326 & 0.298135 \tabularnewline
31 & -0.13734 & -1.0727 & 0.143825 \tabularnewline
32 & -0.234214 & -1.8293 & 0.036124 \tabularnewline
33 & -0.153729 & -1.2007 & 0.117262 \tabularnewline
34 & -0.198178 & -1.5478 & 0.063419 \tabularnewline
35 & -0.154215 & -1.2045 & 0.116533 \tabularnewline
36 & 0.012987 & 0.1014 & 0.459769 \tabularnewline
37 & -0.108557 & -0.8479 & 0.199916 \tabularnewline
38 & -0.215912 & -1.6863 & 0.048421 \tabularnewline
39 & -0.241793 & -1.8885 & 0.031861 \tabularnewline
40 & -0.283843 & -2.2169 & 0.015184 \tabularnewline
41 & -0.263983 & -2.0618 & 0.021749 \tabularnewline
42 & -0.136578 & -1.0667 & 0.145154 \tabularnewline
43 & -0.148005 & -1.156 & 0.126104 \tabularnewline
44 & -0.213063 & -1.6641 & 0.050613 \tabularnewline
45 & -0.179581 & -1.4026 & 0.082906 \tabularnewline
46 & -0.182565 & -1.4259 & 0.0795 \tabularnewline
47 & -0.168809 & -1.3184 & 0.096142 \tabularnewline
48 & -0.077459 & -0.605 & 0.273719 \tabularnewline
49 & -0.108894 & -0.8505 & 0.19919 \tabularnewline
50 & -0.162731 & -1.271 & 0.104283 \tabularnewline
51 & -0.201308 & -1.5723 & 0.060531 \tabularnewline
52 & -0.176235 & -1.3764 & 0.086858 \tabularnewline
53 & -0.16158 & -1.262 & 0.10588 \tabularnewline
54 & -0.073949 & -0.5776 & 0.282845 \tabularnewline
55 & -0.045322 & -0.354 & 0.36229 \tabularnewline
56 & -0.042016 & -0.3282 & 0.37196 \tabularnewline
57 & -0.043813 & -0.3422 & 0.366691 \tabularnewline
58 & -0.043286 & -0.3381 & 0.368233 \tabularnewline
59 & -0.038788 & -0.3029 & 0.381482 \tabularnewline
60 & -0.012021 & -0.0939 & 0.462752 \tabularnewline
\hline
\end{tabular}
%Source: https://freestatistics.org/blog/index.php?pk=29635&T=1

[TABLE]
[ROW][C]Autocorrelation Function[/C][/ROW]
[ROW][C]Time lag k[/C][C]ACF(k)[/C][C]T-STAT[/C][C]P-value[/C][/ROW]
[ROW][C]1[/C][C]0.565311[/C][C]4.4152[/C][C]2.1e-05[/C][/ROW]
[ROW][C]2[/C][C]0.369912[/C][C]2.8891[/C][C]0.002671[/C][/ROW]
[ROW][C]3[/C][C]0.334432[/C][C]2.612[/C][C]0.005658[/C][/ROW]
[ROW][C]4[/C][C]0.124254[/C][C]0.9705[/C][C]0.167826[/C][/ROW]
[ROW][C]5[/C][C]0.189234[/C][C]1.478[/C][C]0.072281[/C][/ROW]
[ROW][C]6[/C][C]0.417021[/C][C]3.257[/C][C]0.00092[/C][/ROW]
[ROW][C]7[/C][C]0.246316[/C][C]1.9238[/C][C]0.029525[/C][/ROW]
[ROW][C]8[/C][C]0.092634[/C][C]0.7235[/C][C]0.236071[/C][/ROW]
[ROW][C]9[/C][C]0.267846[/C][C]2.0919[/C][C]0.020307[/C][/ROW]
[ROW][C]10[/C][C]0.196478[/C][C]1.5345[/C][C]0.065034[/C][/ROW]
[ROW][C]11[/C][C]0.304385[/C][C]2.3773[/C][C]0.010295[/C][/ROW]
[ROW][C]12[/C][C]0.603134[/C][C]4.7106[/C][C]7e-06[/C][/ROW]
[ROW][C]13[/C][C]0.305248[/C][C]2.3841[/C][C]0.010124[/C][/ROW]
[ROW][C]14[/C][C]0.104417[/C][C]0.8155[/C][C]0.208973[/C][/ROW]
[ROW][C]15[/C][C]0.092807[/C][C]0.7248[/C][C]0.235659[/C][/ROW]
[ROW][C]16[/C][C]-0.066617[/C][C]-0.5203[/C][C]0.30237[/C][/ROW]
[ROW][C]17[/C][C]-0.032915[/C][C]-0.2571[/C][C]0.398992[/C][/ROW]
[ROW][C]18[/C][C]0.147368[/C][C]1.151[/C][C]0.127115[/C][/ROW]
[ROW][C]19[/C][C]0.023766[/C][C]0.1856[/C][C]0.426678[/C][/ROW]
[ROW][C]20[/C][C]-0.097571[/C][C]-0.7621[/C][C]0.224483[/C][/ROW]
[ROW][C]21[/C][C]0.010201[/C][C]0.0797[/C][C]0.468379[/C][/ROW]
[ROW][C]22[/C][C]-0.036565[/C][C]-0.2856[/C][C]0.388084[/C][/ROW]
[ROW][C]23[/C][C]0.022208[/C][C]0.1735[/C][C]0.431435[/C][/ROW]
[ROW][C]24[/C][C]0.256133[/C][C]2.0005[/C][C]0.024953[/C][/ROW]
[ROW][C]25[/C][C]0.037657[/C][C]0.2941[/C][C]0.384837[/C][/ROW]
[ROW][C]26[/C][C]-0.108126[/C][C]-0.8445[/C][C]0.200847[/C][/ROW]
[ROW][C]27[/C][C]-0.136194[/C][C]-1.0637[/C][C]0.145826[/C][/ROW]
[ROW][C]28[/C][C]-0.251463[/C][C]-1.964[/C][C]0.027046[/C][/ROW]
[ROW][C]29[/C][C]-0.218344[/C][C]-1.7053[/C][C]0.046612[/C][/ROW]
[ROW][C]30[/C][C]-0.068188[/C][C]-0.5326[/C][C]0.298135[/C][/ROW]
[ROW][C]31[/C][C]-0.13734[/C][C]-1.0727[/C][C]0.143825[/C][/ROW]
[ROW][C]32[/C][C]-0.234214[/C][C]-1.8293[/C][C]0.036124[/C][/ROW]
[ROW][C]33[/C][C]-0.153729[/C][C]-1.2007[/C][C]0.117262[/C][/ROW]
[ROW][C]34[/C][C]-0.198178[/C][C]-1.5478[/C][C]0.063419[/C][/ROW]
[ROW][C]35[/C][C]-0.154215[/C][C]-1.2045[/C][C]0.116533[/C][/ROW]
[ROW][C]36[/C][C]0.012987[/C][C]0.1014[/C][C]0.459769[/C][/ROW]
[ROW][C]37[/C][C]-0.108557[/C][C]-0.8479[/C][C]0.199916[/C][/ROW]
[ROW][C]38[/C][C]-0.215912[/C][C]-1.6863[/C][C]0.048421[/C][/ROW]
[ROW][C]39[/C][C]-0.241793[/C][C]-1.8885[/C][C]0.031861[/C][/ROW]
[ROW][C]40[/C][C]-0.283843[/C][C]-2.2169[/C][C]0.015184[/C][/ROW]
[ROW][C]41[/C][C]-0.263983[/C][C]-2.0618[/C][C]0.021749[/C][/ROW]
[ROW][C]42[/C][C]-0.136578[/C][C]-1.0667[/C][C]0.145154[/C][/ROW]
[ROW][C]43[/C][C]-0.148005[/C][C]-1.156[/C][C]0.126104[/C][/ROW]
[ROW][C]44[/C][C]-0.213063[/C][C]-1.6641[/C][C]0.050613[/C][/ROW]
[ROW][C]45[/C][C]-0.179581[/C][C]-1.4026[/C][C]0.082906[/C][/ROW]
[ROW][C]46[/C][C]-0.182565[/C][C]-1.4259[/C][C]0.0795[/C][/ROW]
[ROW][C]47[/C][C]-0.168809[/C][C]-1.3184[/C][C]0.096142[/C][/ROW]
[ROW][C]48[/C][C]-0.077459[/C][C]-0.605[/C][C]0.273719[/C][/ROW]
[ROW][C]49[/C][C]-0.108894[/C][C]-0.8505[/C][C]0.19919[/C][/ROW]
[ROW][C]50[/C][C]-0.162731[/C][C]-1.271[/C][C]0.104283[/C][/ROW]
[ROW][C]51[/C][C]-0.201308[/C][C]-1.5723[/C][C]0.060531[/C][/ROW]
[ROW][C]52[/C][C]-0.176235[/C][C]-1.3764[/C][C]0.086858[/C][/ROW]
[ROW][C]53[/C][C]-0.16158[/C][C]-1.262[/C][C]0.10588[/C][/ROW]
[ROW][C]54[/C][C]-0.073949[/C][C]-0.5776[/C][C]0.282845[/C][/ROW]
[ROW][C]55[/C][C]-0.045322[/C][C]-0.354[/C][C]0.36229[/C][/ROW]
[ROW][C]56[/C][C]-0.042016[/C][C]-0.3282[/C][C]0.37196[/C][/ROW]
[ROW][C]57[/C][C]-0.043813[/C][C]-0.3422[/C][C]0.366691[/C][/ROW]
[ROW][C]58[/C][C]-0.043286[/C][C]-0.3381[/C][C]0.368233[/C][/ROW]
[ROW][C]59[/C][C]-0.038788[/C][C]-0.3029[/C][C]0.381482[/C][/ROW]
[ROW][C]60[/C][C]-0.012021[/C][C]-0.0939[/C][C]0.462752[/C][/ROW]
[/TABLE]
Source: https://freestatistics.org/blog/index.php?pk=29635&T=1

Globally Unique Identifier (entire table): ba.freestatistics.org/blog/index.php?pk=29635&T=1

As an alternative you can also use a QR Code:  

The GUIDs for individual cells are displayed in the table below:

Autocorrelation Function
Time lag kACF(k)T-STATP-value
10.5653114.41522.1e-05
20.3699122.88910.002671
30.3344322.6120.005658
40.1242540.97050.167826
50.1892341.4780.072281
60.4170213.2570.00092
70.2463161.92380.029525
80.0926340.72350.236071
90.2678462.09190.020307
100.1964781.53450.065034
110.3043852.37730.010295
120.6031344.71067e-06
130.3052482.38410.010124
140.1044170.81550.208973
150.0928070.72480.235659
16-0.066617-0.52030.30237
17-0.032915-0.25710.398992
180.1473681.1510.127115
190.0237660.18560.426678
20-0.097571-0.76210.224483
210.0102010.07970.468379
22-0.036565-0.28560.388084
230.0222080.17350.431435
240.2561332.00050.024953
250.0376570.29410.384837
26-0.108126-0.84450.200847
27-0.136194-1.06370.145826
28-0.251463-1.9640.027046
29-0.218344-1.70530.046612
30-0.068188-0.53260.298135
31-0.13734-1.07270.143825
32-0.234214-1.82930.036124
33-0.153729-1.20070.117262
34-0.198178-1.54780.063419
35-0.154215-1.20450.116533
360.0129870.10140.459769
37-0.108557-0.84790.199916
38-0.215912-1.68630.048421
39-0.241793-1.88850.031861
40-0.283843-2.21690.015184
41-0.263983-2.06180.021749
42-0.136578-1.06670.145154
43-0.148005-1.1560.126104
44-0.213063-1.66410.050613
45-0.179581-1.40260.082906
46-0.182565-1.42590.0795
47-0.168809-1.31840.096142
48-0.077459-0.6050.273719
49-0.108894-0.85050.19919
50-0.162731-1.2710.104283
51-0.201308-1.57230.060531
52-0.176235-1.37640.086858
53-0.16158-1.2620.10588
54-0.073949-0.57760.282845
55-0.045322-0.3540.36229
56-0.042016-0.32820.37196
57-0.043813-0.34220.366691
58-0.043286-0.33810.368233
59-0.038788-0.30290.381482
60-0.012021-0.09390.462752


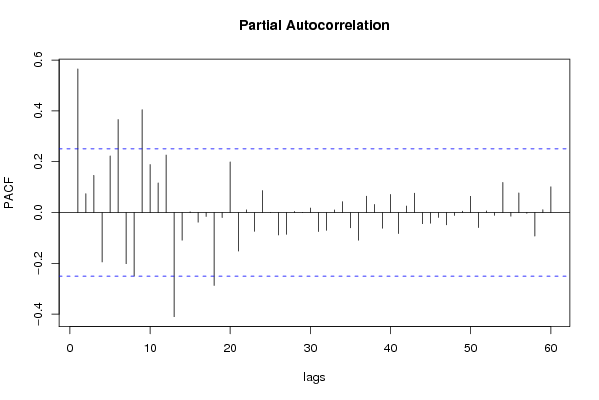
Partial Autocorrelation Function
Time lag kPACF(k)T-STATP-value
10.5653114.41522.1e-05
20.0739770.57780.282769
30.1462481.14220.128911
4-0.194676-1.52050.06678
50.2229711.74150.043322
60.3661492.85970.002899
7-0.201524-1.5740.060335
8-0.250055-1.9530.027706
90.4047373.16110.001224
100.1886571.47350.072884
110.1162740.90810.183693
120.2262251.76690.041126
13-0.410104-3.2030.001081
14-0.109191-0.85280.19855
150.0025980.02030.491939
16-0.038141-0.29790.383399
17-0.015233-0.1190.452845
18-0.287204-2.24310.014266
19-0.01969-0.15380.439143
200.1990771.55480.062579
21-0.151784-1.18550.120214
220.0103740.0810.467843
23-0.074112-0.57880.282416
240.0866550.67680.250546
25-0.000636-0.0050.498026
26-0.088569-0.69170.24586
27-0.085938-0.67120.252313
280.0041850.03270.487015
29-0.000855-0.00670.497346
300.0175830.13730.445612
31-0.075237-0.58760.279478
32-0.070095-0.54750.293032
330.0099080.07740.469284
340.0427170.33360.3699
35-0.060472-0.47230.319199
36-0.10882-0.84990.19935
370.0640440.50020.309367
380.0317180.24770.402588
39-0.061518-0.48050.316306
400.0709760.55430.290687
41-0.082698-0.64590.260385
420.025260.19730.422129
430.0760390.59390.277393
44-0.044158-0.34490.365684
45-0.042132-0.32910.371618
46-0.019202-0.150.44064
47-0.048235-0.37670.353843
48-0.011801-0.09220.463432
490.0050830.03970.48423
500.0637990.49830.310036
51-0.059114-0.46170.322972
520.0061880.04830.480806
53-0.011117-0.08680.465548
540.1182270.92340.179723
55-0.014677-0.11460.454558
560.0769210.60080.275109
57-0.003314-0.02590.489717
58-0.092982-0.72620.235242
590.0112190.08760.465233
600.1013850.79180.21576

\begin{tabular}{lllllllll}
\hline
Partial Autocorrelation Function \tabularnewline
Time lag k & PACF(k) & T-STAT & P-value \tabularnewline
1 & 0.565311 & 4.4152 & 2.1e-05 \tabularnewline
2 & 0.073977 & 0.5778 & 0.282769 \tabularnewline
3 & 0.146248 & 1.1422 & 0.128911 \tabularnewline
4 & -0.194676 & -1.5205 & 0.06678 \tabularnewline
5 & 0.222971 & 1.7415 & 0.043322 \tabularnewline
6 & 0.366149 & 2.8597 & 0.002899 \tabularnewline
7 & -0.201524 & -1.574 & 0.060335 \tabularnewline
8 & -0.250055 & -1.953 & 0.027706 \tabularnewline
9 & 0.404737 & 3.1611 & 0.001224 \tabularnewline
10 & 0.188657 & 1.4735 & 0.072884 \tabularnewline
11 & 0.116274 & 0.9081 & 0.183693 \tabularnewline
12 & 0.226225 & 1.7669 & 0.041126 \tabularnewline
13 & -0.410104 & -3.203 & 0.001081 \tabularnewline
14 & -0.109191 & -0.8528 & 0.19855 \tabularnewline
15 & 0.002598 & 0.0203 & 0.491939 \tabularnewline
16 & -0.038141 & -0.2979 & 0.383399 \tabularnewline
17 & -0.015233 & -0.119 & 0.452845 \tabularnewline
18 & -0.287204 & -2.2431 & 0.014266 \tabularnewline
19 & -0.01969 & -0.1538 & 0.439143 \tabularnewline
20 & 0.199077 & 1.5548 & 0.062579 \tabularnewline
21 & -0.151784 & -1.1855 & 0.120214 \tabularnewline
22 & 0.010374 & 0.081 & 0.467843 \tabularnewline
23 & -0.074112 & -0.5788 & 0.282416 \tabularnewline
24 & 0.086655 & 0.6768 & 0.250546 \tabularnewline
25 & -0.000636 & -0.005 & 0.498026 \tabularnewline
26 & -0.088569 & -0.6917 & 0.24586 \tabularnewline
27 & -0.085938 & -0.6712 & 0.252313 \tabularnewline
28 & 0.004185 & 0.0327 & 0.487015 \tabularnewline
29 & -0.000855 & -0.0067 & 0.497346 \tabularnewline
30 & 0.017583 & 0.1373 & 0.445612 \tabularnewline
31 & -0.075237 & -0.5876 & 0.279478 \tabularnewline
32 & -0.070095 & -0.5475 & 0.293032 \tabularnewline
33 & 0.009908 & 0.0774 & 0.469284 \tabularnewline
34 & 0.042717 & 0.3336 & 0.3699 \tabularnewline
35 & -0.060472 & -0.4723 & 0.319199 \tabularnewline
36 & -0.10882 & -0.8499 & 0.19935 \tabularnewline
37 & 0.064044 & 0.5002 & 0.309367 \tabularnewline
38 & 0.031718 & 0.2477 & 0.402588 \tabularnewline
39 & -0.061518 & -0.4805 & 0.316306 \tabularnewline
40 & 0.070976 & 0.5543 & 0.290687 \tabularnewline
41 & -0.082698 & -0.6459 & 0.260385 \tabularnewline
42 & 0.02526 & 0.1973 & 0.422129 \tabularnewline
43 & 0.076039 & 0.5939 & 0.277393 \tabularnewline
44 & -0.044158 & -0.3449 & 0.365684 \tabularnewline
45 & -0.042132 & -0.3291 & 0.371618 \tabularnewline
46 & -0.019202 & -0.15 & 0.44064 \tabularnewline
47 & -0.048235 & -0.3767 & 0.353843 \tabularnewline
48 & -0.011801 & -0.0922 & 0.463432 \tabularnewline
49 & 0.005083 & 0.0397 & 0.48423 \tabularnewline
50 & 0.063799 & 0.4983 & 0.310036 \tabularnewline
51 & -0.059114 & -0.4617 & 0.322972 \tabularnewline
52 & 0.006188 & 0.0483 & 0.480806 \tabularnewline
53 & -0.011117 & -0.0868 & 0.465548 \tabularnewline
54 & 0.118227 & 0.9234 & 0.179723 \tabularnewline
55 & -0.014677 & -0.1146 & 0.454558 \tabularnewline
56 & 0.076921 & 0.6008 & 0.275109 \tabularnewline
57 & -0.003314 & -0.0259 & 0.489717 \tabularnewline
58 & -0.092982 & -0.7262 & 0.235242 \tabularnewline
59 & 0.011219 & 0.0876 & 0.465233 \tabularnewline
60 & 0.101385 & 0.7918 & 0.21576 \tabularnewline
\hline
\end{tabular}
%Source: https://freestatistics.org/blog/index.php?pk=29635&T=2

[TABLE]
[ROW][C]Partial Autocorrelation Function[/C][/ROW]
[ROW][C]Time lag k[/C][C]PACF(k)[/C][C]T-STAT[/C][C]P-value[/C][/ROW]
[ROW][C]1[/C][C]0.565311[/C][C]4.4152[/C][C]2.1e-05[/C][/ROW]
[ROW][C]2[/C][C]0.073977[/C][C]0.5778[/C][C]0.282769[/C][/ROW]
[ROW][C]3[/C][C]0.146248[/C][C]1.1422[/C][C]0.128911[/C][/ROW]
[ROW][C]4[/C][C]-0.194676[/C][C]-1.5205[/C][C]0.06678[/C][/ROW]
[ROW][C]5[/C][C]0.222971[/C][C]1.7415[/C][C]0.043322[/C][/ROW]
[ROW][C]6[/C][C]0.366149[/C][C]2.8597[/C][C]0.002899[/C][/ROW]
[ROW][C]7[/C][C]-0.201524[/C][C]-1.574[/C][C]0.060335[/C][/ROW]
[ROW][C]8[/C][C]-0.250055[/C][C]-1.953[/C][C]0.027706[/C][/ROW]
[ROW][C]9[/C][C]0.404737[/C][C]3.1611[/C][C]0.001224[/C][/ROW]
[ROW][C]10[/C][C]0.188657[/C][C]1.4735[/C][C]0.072884[/C][/ROW]
[ROW][C]11[/C][C]0.116274[/C][C]0.9081[/C][C]0.183693[/C][/ROW]
[ROW][C]12[/C][C]0.226225[/C][C]1.7669[/C][C]0.041126[/C][/ROW]
[ROW][C]13[/C][C]-0.410104[/C][C]-3.203[/C][C]0.001081[/C][/ROW]
[ROW][C]14[/C][C]-0.109191[/C][C]-0.8528[/C][C]0.19855[/C][/ROW]
[ROW][C]15[/C][C]0.002598[/C][C]0.0203[/C][C]0.491939[/C][/ROW]
[ROW][C]16[/C][C]-0.038141[/C][C]-0.2979[/C][C]0.383399[/C][/ROW]
[ROW][C]17[/C][C]-0.015233[/C][C]-0.119[/C][C]0.452845[/C][/ROW]
[ROW][C]18[/C][C]-0.287204[/C][C]-2.2431[/C][C]0.014266[/C][/ROW]
[ROW][C]19[/C][C]-0.01969[/C][C]-0.1538[/C][C]0.439143[/C][/ROW]
[ROW][C]20[/C][C]0.199077[/C][C]1.5548[/C][C]0.062579[/C][/ROW]
[ROW][C]21[/C][C]-0.151784[/C][C]-1.1855[/C][C]0.120214[/C][/ROW]
[ROW][C]22[/C][C]0.010374[/C][C]0.081[/C][C]0.467843[/C][/ROW]
[ROW][C]23[/C][C]-0.074112[/C][C]-0.5788[/C][C]0.282416[/C][/ROW]
[ROW][C]24[/C][C]0.086655[/C][C]0.6768[/C][C]0.250546[/C][/ROW]
[ROW][C]25[/C][C]-0.000636[/C][C]-0.005[/C][C]0.498026[/C][/ROW]
[ROW][C]26[/C][C]-0.088569[/C][C]-0.6917[/C][C]0.24586[/C][/ROW]
[ROW][C]27[/C][C]-0.085938[/C][C]-0.6712[/C][C]0.252313[/C][/ROW]
[ROW][C]28[/C][C]0.004185[/C][C]0.0327[/C][C]0.487015[/C][/ROW]
[ROW][C]29[/C][C]-0.000855[/C][C]-0.0067[/C][C]0.497346[/C][/ROW]
[ROW][C]30[/C][C]0.017583[/C][C]0.1373[/C][C]0.445612[/C][/ROW]
[ROW][C]31[/C][C]-0.075237[/C][C]-0.5876[/C][C]0.279478[/C][/ROW]
[ROW][C]32[/C][C]-0.070095[/C][C]-0.5475[/C][C]0.293032[/C][/ROW]
[ROW][C]33[/C][C]0.009908[/C][C]0.0774[/C][C]0.469284[/C][/ROW]
[ROW][C]34[/C][C]0.042717[/C][C]0.3336[/C][C]0.3699[/C][/ROW]
[ROW][C]35[/C][C]-0.060472[/C][C]-0.4723[/C][C]0.319199[/C][/ROW]
[ROW][C]36[/C][C]-0.10882[/C][C]-0.8499[/C][C]0.19935[/C][/ROW]
[ROW][C]37[/C][C]0.064044[/C][C]0.5002[/C][C]0.309367[/C][/ROW]
[ROW][C]38[/C][C]0.031718[/C][C]0.2477[/C][C]0.402588[/C][/ROW]
[ROW][C]39[/C][C]-0.061518[/C][C]-0.4805[/C][C]0.316306[/C][/ROW]
[ROW][C]40[/C][C]0.070976[/C][C]0.5543[/C][C]0.290687[/C][/ROW]
[ROW][C]41[/C][C]-0.082698[/C][C]-0.6459[/C][C]0.260385[/C][/ROW]
[ROW][C]42[/C][C]0.02526[/C][C]0.1973[/C][C]0.422129[/C][/ROW]
[ROW][C]43[/C][C]0.076039[/C][C]0.5939[/C][C]0.277393[/C][/ROW]
[ROW][C]44[/C][C]-0.044158[/C][C]-0.3449[/C][C]0.365684[/C][/ROW]
[ROW][C]45[/C][C]-0.042132[/C][C]-0.3291[/C][C]0.371618[/C][/ROW]
[ROW][C]46[/C][C]-0.019202[/C][C]-0.15[/C][C]0.44064[/C][/ROW]
[ROW][C]47[/C][C]-0.048235[/C][C]-0.3767[/C][C]0.353843[/C][/ROW]
[ROW][C]48[/C][C]-0.011801[/C][C]-0.0922[/C][C]0.463432[/C][/ROW]
[ROW][C]49[/C][C]0.005083[/C][C]0.0397[/C][C]0.48423[/C][/ROW]
[ROW][C]50[/C][C]0.063799[/C][C]0.4983[/C][C]0.310036[/C][/ROW]
[ROW][C]51[/C][C]-0.059114[/C][C]-0.4617[/C][C]0.322972[/C][/ROW]
[ROW][C]52[/C][C]0.006188[/C][C]0.0483[/C][C]0.480806[/C][/ROW]
[ROW][C]53[/C][C]-0.011117[/C][C]-0.0868[/C][C]0.465548[/C][/ROW]
[ROW][C]54[/C][C]0.118227[/C][C]0.9234[/C][C]0.179723[/C][/ROW]
[ROW][C]55[/C][C]-0.014677[/C][C]-0.1146[/C][C]0.454558[/C][/ROW]
[ROW][C]56[/C][C]0.076921[/C][C]0.6008[/C][C]0.275109[/C][/ROW]
[ROW][C]57[/C][C]-0.003314[/C][C]-0.0259[/C][C]0.489717[/C][/ROW]
[ROW][C]58[/C][C]-0.092982[/C][C]-0.7262[/C][C]0.235242[/C][/ROW]
[ROW][C]59[/C][C]0.011219[/C][C]0.0876[/C][C]0.465233[/C][/ROW]
[ROW][C]60[/C][C]0.101385[/C][C]0.7918[/C][C]0.21576[/C][/ROW]
[/TABLE]
Source: https://freestatistics.org/blog/index.php?pk=29635&T=2

Globally Unique Identifier (entire table): ba.freestatistics.org/blog/index.php?pk=29635&T=2

As an alternative you can also use a QR Code:  

The GUIDs for individual cells are displayed in the table below:

Partial Autocorrelation Function
Time lag kPACF(k)T-STATP-value
10.5653114.41522.1e-05
20.0739770.57780.282769
30.1462481.14220.128911
4-0.194676-1.52050.06678
50.2229711.74150.043322
60.3661492.85970.002899
7-0.201524-1.5740.060335
8-0.250055-1.9530.027706
90.4047373.16110.001224
100.1886571.47350.072884
110.1162740.90810.183693
120.2262251.76690.041126
13-0.410104-3.2030.001081
14-0.109191-0.85280.19855
150.0025980.02030.491939
16-0.038141-0.29790.383399
17-0.015233-0.1190.452845
18-0.287204-2.24310.014266
19-0.01969-0.15380.439143
200.1990771.55480.062579
21-0.151784-1.18550.120214
220.0103740.0810.467843
23-0.074112-0.57880.282416
240.0866550.67680.250546
25-0.000636-0.0050.498026
26-0.088569-0.69170.24586
27-0.085938-0.67120.252313
280.0041850.03270.487015
29-0.000855-0.00670.497346
300.0175830.13730.445612
31-0.075237-0.58760.279478
32-0.070095-0.54750.293032
330.0099080.07740.469284
340.0427170.33360.3699
35-0.060472-0.47230.319199
36-0.10882-0.84990.19935
370.0640440.50020.309367
380.0317180.24770.402588
39-0.061518-0.48050.316306
400.0709760.55430.290687
41-0.082698-0.64590.260385
420.025260.19730.422129
430.0760390.59390.277393
44-0.044158-0.34490.365684
45-0.042132-0.32910.371618
46-0.019202-0.150.44064
47-0.048235-0.37670.353843
48-0.011801-0.09220.463432
490.0050830.03970.48423
500.0637990.49830.310036
51-0.059114-0.46170.322972
520.0061880.04830.480806
53-0.011117-0.08680.465548
540.1182270.92340.179723
55-0.014677-0.11460.454558
560.0769210.60080.275109
57-0.003314-0.02590.489717
58-0.092982-0.72620.235242
590.0112190.08760.465233
600.1013850.79180.21576


Parameters (Session):
par1 = 60 ; par2 = -0.1 ; par3 = 0 ; par4 = 0 ; par5 = 12 ;
Parameters (R input):
par1 = 60 ; par2 = -0.1 ; par3 = 0 ; par4 = 0 ; par5 = 12 ;
R code (references can be found in the software module):
if (par1 == 'Default') {
par1 = 10*log10(length(x))
} else {
par1 <- as.numeric(par1)
}
par2 <- as.numeric(par2)
par3 <- as.numeric(par3)
par4 <- as.numeric(par4)
par5 <- as.numeric(par5)
if (par2 == 0) {
x <- log(x)
} else {
x <- (x ^ par2 - 1) / par2
}
if (par3 > 0) x <- diff(x,lag=1,difference=par3)
if (par4 > 0) x <- diff(x,lag=par5,difference=par4)
bitmap(file='pic1.png')
racf <- acf(x,par1,main='Autocorrelation',xlab='lags',ylab='ACF')
dev.off()
bitmap(file='pic2.png')
rpacf <- pacf(x,par1,main='Partial Autocorrelation',xlab='lags',ylab='PACF')
dev.off()
(myacf <- c(racf$acf))
(mypacf <- c(rpacf$acf))
lengthx <- length(x)
sqrtn <- sqrt(lengthx)
load(file='createtable')
a<-table.start()
a<-table.row.start(a)
a<-table.element(a,'Autocorrelation Function',4,TRUE)
a<-table.row.end(a)
a<-table.row.start(a)
a<-table.element(a,'Time lag k',header=TRUE)
a<-table.element(a,hyperlink('basics.htm','ACF(k)','click here for more information about the Autocorrelation Function'),header=TRUE)
a<-table.element(a,'T-STAT',header=TRUE)
a<-table.element(a,'P-value',header=TRUE)
a<-table.row.end(a)
for (i in 2:(par1+1)) {
a<-table.row.start(a)
a<-table.element(a,i-1,header=TRUE)
a<-table.element(a,round(myacf[i],6))
mytstat <- myacf[i]*sqrtn
a<-table.element(a,round(mytstat,4))
a<-table.element(a,round(1-pt(abs(mytstat),lengthx),6))
a<-table.row.end(a)
}
a<-table.end(a)
table.save(a,file='mytable.tab')
a<-table.start()
a<-table.row.start(a)
a<-table.element(a,'Partial Autocorrelation Function',4,TRUE)
a<-table.row.end(a)
a<-table.row.start(a)
a<-table.element(a,'Time lag k',header=TRUE)
a<-table.element(a,hyperlink('basics.htm','PACF(k)','click here for more information about the Partial Autocorrelation Function'),header=TRUE)
a<-table.element(a,'T-STAT',header=TRUE)
a<-table.element(a,'P-value',header=TRUE)
a<-table.row.end(a)
for (i in 1:par1) {
a<-table.row.start(a)
a<-table.element(a,i,header=TRUE)
a<-table.element(a,round(mypacf[i],6))
mytstat <- mypacf[i]*sqrtn
a<-table.element(a,round(mytstat,4))
a<-table.element(a,round(1-pt(abs(mytstat),lengthx),6))
a<-table.row.end(a)
}
a<-table.end(a)
table.save(a,file='mytable1.tab')