Free Statistics

of Irreproducible Research!

Author's title

Author*The author of this computation has been verified*
R Software Modulerwasp_arimaforecasting.wasp
Title produced by softwareARIMA Forecasting
Date of computationTue, 16 Dec 2008 10:35:21 -0700
Cite this page as followsStatistical Computations at FreeStatistics.org, Office for Research Development and Education, URL https://freestatistics.org/blog/index.php?v=date/2008/Dec/16/t12294489679udufd6zdvwzbqf.htm/, Retrieved Wed, 15 May 2024 01:54:42 +0000
Statistical Computations at FreeStatistics.org, Office for Research Development and Education, URL https://freestatistics.org/blog/index.php?pk=34055, Retrieved Wed, 15 May 2024 01:54:42 +0000
QR Codes:

Original text written by user:
IsPrivate?No (this computation is public)
User-defined keywords
Estimated Impact175
Family? (F = Feedback message, R = changed R code, M = changed R Module, P = changed Parameters, D = changed Data)
F     [ARIMA Forecasting] [Opdracht 1 - Blok 21] [2008-12-11 10:08:40] [8094ad203a218aaca2d1cea2c78c2d6e]
F   P     [ARIMA Forecasting] [blok 21 Q5] [2008-12-16 17:35:21] [1237f4df7e9be807e4c0a07b90c45721] [Current]
Feedback Forum
2008-12-18 11:39:40 [Stefan Temmerman] [reply
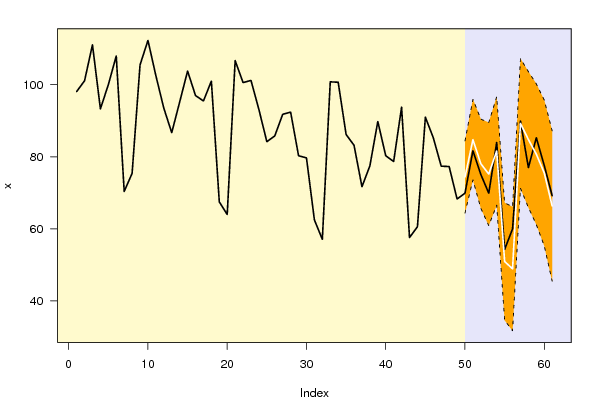
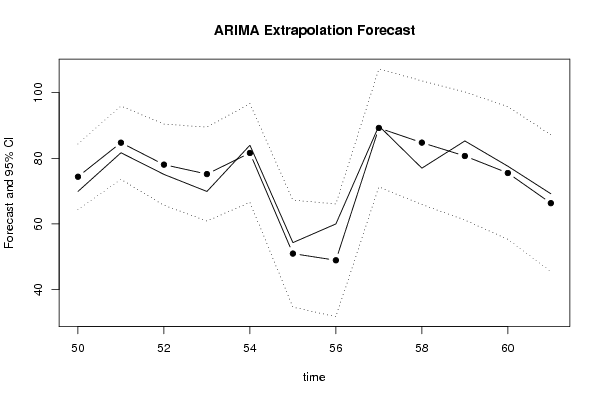
Step 5: Hier moet er gekeken worden naar de ARIMA extrapolation forecast. De voorspelde data (met de bolletjes) zijn niet juist gelijk aan de reële waarden, maar we zien toch een sterke gelijkenis. Ook valt geen enkele voorspelling buiten het 95% betrouwbaarheidsinterval, wat goed is voor het model en ook duidt op geen enkele speciale gebeurtenis. Dit is in lijn met de kolom van de procentuele standaardfouten. Deze varieert van 6% tot 17%, dat is de kans dat de voorspelde waarden zouden schillen van de reële. De kans is dus klein (behalve weer voor maand 56, waar nader onderzoek zou op moeten gebeuren) en wijst op een goed model. De PE kolom laat zien hoeveel de voorspelde waarden werkelijk afwijken, deze zijn ook goed, behalve weer (22%) voor maand 56.
2008-12-23 14:45:57 [c97d2ae59c98cf77a04815c1edffab5a] [reply
Voor deze vraag moet je uit de eerste tabel de kolommen Y(t); F(t) en p-value gebruiken.
Als de p-waarde groter is dan 5%, wil dit zeggen dat het verschil tussen de voorspelde waarde en de werkelijke waarde niet significant is. Wanneer dit kleiner is dan 5%, wil dit zeggen dat het verschil tussen de voorspelde waarde en de werkelijke waarde wel significant is. Dit zou je ook in de grafieken (waar de laatste 12 maanden zijn uitvergroot) kunnen nazien, door te kijken of de werkelijke waarden buiten het betrouwbaarheidsinterval vallen. Uit de tabel kan je afleiden dat bij periode 56 de p-waarde het meest naar 5% gaat wijken: in deze periode zal de afwijking tussen de werkelijke en voorspelde waarde het grootst zijn, maar er is geen significant verschil: de werkelijke waarde ligt niet buiten het betrouwbaarheidsintervak

Dit kan je dan ook vergelijken met de voorspelde theoretische standaardafwijking. Wanneer PE groter is dan %S.E. dan zou je kunnen kijken in de eerste tabel of de p-waarde in die periode kleiner is dan 5%. Als dit kleiner is dan 5%, dan zou dit willen zeggen dat er een significant verschil is tussen de voorspelde waarde en de werkelijke waarde en dat dit dan waarschijnlijk door een economische reden komt. Dit kwam voor bij periode 56, maar deze werkelijke voorspellingsfout zal er uiteindelijk toch niet toe leiden dat er een significant verschil bestaat tussen de werkelijke en voorspelde waarde!
onze analyse mbt significante correspondeert niet aan de theoretisch voorspelde standaardfout: in periode 56 merken we hier wel een verschil op tussen de werkelijke fout en de voorspelde standaardfout, terwijl we in de eerste tabel hadden besloten dat er geen significant verschil was tussen de werkelijke er voorspelde waarde.

Post a new message
Dataseries X:
98,1
101,1
111,1
93,3
100
108
70,4
75,4
105,5
112,3
102,5
93,5
86,7
95,2
103,8
97
95,5
101
67,5
64
106,7
100,6
101,2
93,1
84,2
85,8
91,8
92,4
80,3
79,7
62,5
57,1
100,8
100,7
86,2
83,2
71,7
77,5
89,8
80,3
78,7
93,8
57,6
60,6
91
85,3
77,4
77,3
68,3
69,9
81,7
75,1
69,9
84
54,3
60
89,9
77
85,3
77,6
69,2


Summary of computational transaction
Raw Inputview raw input (R code)
Raw Outputview raw output of R engine
Computing time5 seconds
R Server'Sir Ronald Aylmer Fisher' @ 193.190.124.24

\begin{tabular}{lllllllll}
\hline
Summary of computational transaction \tabularnewline
Raw Input & view raw input (R code)  \tabularnewline
Raw Output & view raw output of R engine  \tabularnewline
Computing time & 5 seconds \tabularnewline
R Server & 'Sir Ronald Aylmer Fisher' @ 193.190.124.24 \tabularnewline
\hline
\end{tabular}
%Source: https://freestatistics.org/blog/index.php?pk=34055&T=0

[TABLE]
[ROW][C]Summary of computational transaction[/C][/ROW]
[ROW][C]Raw Input[/C][C]view raw input (R code) [/C][/ROW]
[ROW][C]Raw Output[/C][C]view raw output of R engine [/C][/ROW]
[ROW][C]Computing time[/C][C]5 seconds[/C][/ROW]
[ROW][C]R Server[/C][C]'Sir Ronald Aylmer Fisher' @ 193.190.124.24[/C][/ROW]
[/TABLE]
Source: https://freestatistics.org/blog/index.php?pk=34055&T=0

Globally Unique Identifier (entire table): ba.freestatistics.org/blog/index.php?pk=34055&T=0

As an alternative you can also use a QR Code:  

The GUIDs for individual cells are displayed in the table below:

Summary of computational transaction
Raw Inputview raw input (R code)
Raw Outputview raw output of R engine
Computing time5 seconds
R Server'Sir Ronald Aylmer Fisher' @ 193.190.124.24


Univariate ARIMA Extrapolation Forecast
timeY[t]F[t]95% LB95% UBp-value(H0: Y[t] = F[t])P(F[t]>Y[t-1])P(F[t]>Y[t-s])P(F[t]>Y[49])
3771.7-------
3877.5-------
3989.8-------
4080.3-------
4178.7-------
4293.8-------
4357.6-------
4460.6-------
4591-------
4685.3-------
4777.4-------
4877.3-------
4968.3-------
5069.974.387864.373284.40250.18990.88330.27120.8833
5181.784.774173.59595.95320.2950.99540.18910.9981
5275.178.077665.696590.45880.31870.28320.36250.9392
5369.975.206160.899389.51290.23360.50580.31610.828
548481.628166.582196.67420.37870.93670.05640.9587
5554.350.955734.654867.25650.343800.21220.0185
566048.920431.729166.11170.10330.26980.09150.0136
5789.989.263571.2729107.2540.47240.99930.4250.9888
587784.787265.9361103.63840.20910.29750.47870.9568
5985.380.71361.1856100.24040.32260.64530.63030.8936
6077.675.526455.296595.75630.42040.17180.43180.7581
6169.266.331145.468387.19380.39380.14490.42660.4266

\begin{tabular}{lllllllll}
\hline
Univariate ARIMA Extrapolation Forecast \tabularnewline
time & Y[t] & F[t] & 95% LB & 95% UB & p-value(H0: Y[t] = F[t]) & P(F[t]>Y[t-1]) & P(F[t]>Y[t-s]) & P(F[t]>Y[49]) \tabularnewline
37 & 71.7 & - & - & - & - & - & - & - \tabularnewline
38 & 77.5 & - & - & - & - & - & - & - \tabularnewline
39 & 89.8 & - & - & - & - & - & - & - \tabularnewline
40 & 80.3 & - & - & - & - & - & - & - \tabularnewline
41 & 78.7 & - & - & - & - & - & - & - \tabularnewline
42 & 93.8 & - & - & - & - & - & - & - \tabularnewline
43 & 57.6 & - & - & - & - & - & - & - \tabularnewline
44 & 60.6 & - & - & - & - & - & - & - \tabularnewline
45 & 91 & - & - & - & - & - & - & - \tabularnewline
46 & 85.3 & - & - & - & - & - & - & - \tabularnewline
47 & 77.4 & - & - & - & - & - & - & - \tabularnewline
48 & 77.3 & - & - & - & - & - & - & - \tabularnewline
49 & 68.3 & - & - & - & - & - & - & - \tabularnewline
50 & 69.9 & 74.3878 & 64.3732 & 84.4025 & 0.1899 & 0.8833 & 0.2712 & 0.8833 \tabularnewline
51 & 81.7 & 84.7741 & 73.595 & 95.9532 & 0.295 & 0.9954 & 0.1891 & 0.9981 \tabularnewline
52 & 75.1 & 78.0776 & 65.6965 & 90.4588 & 0.3187 & 0.2832 & 0.3625 & 0.9392 \tabularnewline
53 & 69.9 & 75.2061 & 60.8993 & 89.5129 & 0.2336 & 0.5058 & 0.3161 & 0.828 \tabularnewline
54 & 84 & 81.6281 & 66.5821 & 96.6742 & 0.3787 & 0.9367 & 0.0564 & 0.9587 \tabularnewline
55 & 54.3 & 50.9557 & 34.6548 & 67.2565 & 0.3438 & 0 & 0.2122 & 0.0185 \tabularnewline
56 & 60 & 48.9204 & 31.7291 & 66.1117 & 0.1033 & 0.2698 & 0.0915 & 0.0136 \tabularnewline
57 & 89.9 & 89.2635 & 71.2729 & 107.254 & 0.4724 & 0.9993 & 0.425 & 0.9888 \tabularnewline
58 & 77 & 84.7872 & 65.9361 & 103.6384 & 0.2091 & 0.2975 & 0.4787 & 0.9568 \tabularnewline
59 & 85.3 & 80.713 & 61.1856 & 100.2404 & 0.3226 & 0.6453 & 0.6303 & 0.8936 \tabularnewline
60 & 77.6 & 75.5264 & 55.2965 & 95.7563 & 0.4204 & 0.1718 & 0.4318 & 0.7581 \tabularnewline
61 & 69.2 & 66.3311 & 45.4683 & 87.1938 & 0.3938 & 0.1449 & 0.4266 & 0.4266 \tabularnewline
\hline
\end{tabular}
%Source: https://freestatistics.org/blog/index.php?pk=34055&T=1

[TABLE]
[ROW][C]Univariate ARIMA Extrapolation Forecast[/C][/ROW]
[ROW][C]time[/C][C]Y[t][/C][C]F[t][/C][C]95% LB[/C][C]95% UB[/C][C]p-value(H0: Y[t] = F[t])[/C][C]P(F[t]>Y[t-1])[/C][C]P(F[t]>Y[t-s])[/C][C]P(F[t]>Y[49])[/C][/ROW]
[ROW][C]37[/C][C]71.7[/C][C]-[/C][C]-[/C][C]-[/C][C]-[/C][C]-[/C][C]-[/C][C]-[/C][/ROW]
[ROW][C]38[/C][C]77.5[/C][C]-[/C][C]-[/C][C]-[/C][C]-[/C][C]-[/C][C]-[/C][C]-[/C][/ROW]
[ROW][C]39[/C][C]89.8[/C][C]-[/C][C]-[/C][C]-[/C][C]-[/C][C]-[/C][C]-[/C][C]-[/C][/ROW]
[ROW][C]40[/C][C]80.3[/C][C]-[/C][C]-[/C][C]-[/C][C]-[/C][C]-[/C][C]-[/C][C]-[/C][/ROW]
[ROW][C]41[/C][C]78.7[/C][C]-[/C][C]-[/C][C]-[/C][C]-[/C][C]-[/C][C]-[/C][C]-[/C][/ROW]
[ROW][C]42[/C][C]93.8[/C][C]-[/C][C]-[/C][C]-[/C][C]-[/C][C]-[/C][C]-[/C][C]-[/C][/ROW]
[ROW][C]43[/C][C]57.6[/C][C]-[/C][C]-[/C][C]-[/C][C]-[/C][C]-[/C][C]-[/C][C]-[/C][/ROW]
[ROW][C]44[/C][C]60.6[/C][C]-[/C][C]-[/C][C]-[/C][C]-[/C][C]-[/C][C]-[/C][C]-[/C][/ROW]
[ROW][C]45[/C][C]91[/C][C]-[/C][C]-[/C][C]-[/C][C]-[/C][C]-[/C][C]-[/C][C]-[/C][/ROW]
[ROW][C]46[/C][C]85.3[/C][C]-[/C][C]-[/C][C]-[/C][C]-[/C][C]-[/C][C]-[/C][C]-[/C][/ROW]
[ROW][C]47[/C][C]77.4[/C][C]-[/C][C]-[/C][C]-[/C][C]-[/C][C]-[/C][C]-[/C][C]-[/C][/ROW]
[ROW][C]48[/C][C]77.3[/C][C]-[/C][C]-[/C][C]-[/C][C]-[/C][C]-[/C][C]-[/C][C]-[/C][/ROW]
[ROW][C]49[/C][C]68.3[/C][C]-[/C][C]-[/C][C]-[/C][C]-[/C][C]-[/C][C]-[/C][C]-[/C][/ROW]
[ROW][C]50[/C][C]69.9[/C][C]74.3878[/C][C]64.3732[/C][C]84.4025[/C][C]0.1899[/C][C]0.8833[/C][C]0.2712[/C][C]0.8833[/C][/ROW]
[ROW][C]51[/C][C]81.7[/C][C]84.7741[/C][C]73.595[/C][C]95.9532[/C][C]0.295[/C][C]0.9954[/C][C]0.1891[/C][C]0.9981[/C][/ROW]
[ROW][C]52[/C][C]75.1[/C][C]78.0776[/C][C]65.6965[/C][C]90.4588[/C][C]0.3187[/C][C]0.2832[/C][C]0.3625[/C][C]0.9392[/C][/ROW]
[ROW][C]53[/C][C]69.9[/C][C]75.2061[/C][C]60.8993[/C][C]89.5129[/C][C]0.2336[/C][C]0.5058[/C][C]0.3161[/C][C]0.828[/C][/ROW]
[ROW][C]54[/C][C]84[/C][C]81.6281[/C][C]66.5821[/C][C]96.6742[/C][C]0.3787[/C][C]0.9367[/C][C]0.0564[/C][C]0.9587[/C][/ROW]
[ROW][C]55[/C][C]54.3[/C][C]50.9557[/C][C]34.6548[/C][C]67.2565[/C][C]0.3438[/C][C]0[/C][C]0.2122[/C][C]0.0185[/C][/ROW]
[ROW][C]56[/C][C]60[/C][C]48.9204[/C][C]31.7291[/C][C]66.1117[/C][C]0.1033[/C][C]0.2698[/C][C]0.0915[/C][C]0.0136[/C][/ROW]
[ROW][C]57[/C][C]89.9[/C][C]89.2635[/C][C]71.2729[/C][C]107.254[/C][C]0.4724[/C][C]0.9993[/C][C]0.425[/C][C]0.9888[/C][/ROW]
[ROW][C]58[/C][C]77[/C][C]84.7872[/C][C]65.9361[/C][C]103.6384[/C][C]0.2091[/C][C]0.2975[/C][C]0.4787[/C][C]0.9568[/C][/ROW]
[ROW][C]59[/C][C]85.3[/C][C]80.713[/C][C]61.1856[/C][C]100.2404[/C][C]0.3226[/C][C]0.6453[/C][C]0.6303[/C][C]0.8936[/C][/ROW]
[ROW][C]60[/C][C]77.6[/C][C]75.5264[/C][C]55.2965[/C][C]95.7563[/C][C]0.4204[/C][C]0.1718[/C][C]0.4318[/C][C]0.7581[/C][/ROW]
[ROW][C]61[/C][C]69.2[/C][C]66.3311[/C][C]45.4683[/C][C]87.1938[/C][C]0.3938[/C][C]0.1449[/C][C]0.4266[/C][C]0.4266[/C][/ROW]
[/TABLE]
Source: https://freestatistics.org/blog/index.php?pk=34055&T=1

Globally Unique Identifier (entire table): ba.freestatistics.org/blog/index.php?pk=34055&T=1

As an alternative you can also use a QR Code:  

The GUIDs for individual cells are displayed in the table below:

Univariate ARIMA Extrapolation Forecast
timeY[t]F[t]95% LB95% UBp-value(H0: Y[t] = F[t])P(F[t]>Y[t-1])P(F[t]>Y[t-s])P(F[t]>Y[49])
3771.7-------
3877.5-------
3989.8-------
4080.3-------
4178.7-------
4293.8-------
4357.6-------
4460.6-------
4591-------
4685.3-------
4777.4-------
4877.3-------
4968.3-------
5069.974.387864.373284.40250.18990.88330.27120.8833
5181.784.774173.59595.95320.2950.99540.18910.9981
5275.178.077665.696590.45880.31870.28320.36250.9392
5369.975.206160.899389.51290.23360.50580.31610.828
548481.628166.582196.67420.37870.93670.05640.9587
5554.350.955734.654867.25650.343800.21220.0185
566048.920431.729166.11170.10330.26980.09150.0136
5789.989.263571.2729107.2540.47240.99930.4250.9888
587784.787265.9361103.63840.20910.29750.47870.9568
5985.380.71361.1856100.24040.32260.64530.63030.8936
6077.675.526455.296595.75630.42040.17180.43180.7581
6169.266.331145.468387.19380.39380.14490.42660.4266


Univariate ARIMA Extrapolation Forecast Performance
time% S.E.PEMAPESq.EMSERMSE
500.0687-0.06030.00520.14071.67841.2955
510.0673-0.03630.0039.45020.78750.8874
520.0809-0.03810.00328.86640.73890.8596
530.0971-0.07060.005928.15462.34621.5317
540.0940.02910.00245.62580.46880.6847
550.16320.06560.005511.18460.93210.9654
560.17930.22650.0189122.756910.22973.1984
570.10280.00716e-040.40520.03380.1838
580.1134-0.09180.007760.6415.05342.248
590.12340.05680.004721.04061.75341.3242
600.13670.02750.00234.29990.35830.5986
610.16050.04330.00368.23070.68590.8282

\begin{tabular}{lllllllll}
\hline
Univariate ARIMA Extrapolation Forecast Performance \tabularnewline
time & % S.E. & PE & MAPE & Sq.E & MSE & RMSE \tabularnewline
50 & 0.0687 & -0.0603 & 0.005 & 20.1407 & 1.6784 & 1.2955 \tabularnewline
51 & 0.0673 & -0.0363 & 0.003 & 9.4502 & 0.7875 & 0.8874 \tabularnewline
52 & 0.0809 & -0.0381 & 0.0032 & 8.8664 & 0.7389 & 0.8596 \tabularnewline
53 & 0.0971 & -0.0706 & 0.0059 & 28.1546 & 2.3462 & 1.5317 \tabularnewline
54 & 0.094 & 0.0291 & 0.0024 & 5.6258 & 0.4688 & 0.6847 \tabularnewline
55 & 0.1632 & 0.0656 & 0.0055 & 11.1846 & 0.9321 & 0.9654 \tabularnewline
56 & 0.1793 & 0.2265 & 0.0189 & 122.7569 & 10.2297 & 3.1984 \tabularnewline
57 & 0.1028 & 0.0071 & 6e-04 & 0.4052 & 0.0338 & 0.1838 \tabularnewline
58 & 0.1134 & -0.0918 & 0.0077 & 60.641 & 5.0534 & 2.248 \tabularnewline
59 & 0.1234 & 0.0568 & 0.0047 & 21.0406 & 1.7534 & 1.3242 \tabularnewline
60 & 0.1367 & 0.0275 & 0.0023 & 4.2999 & 0.3583 & 0.5986 \tabularnewline
61 & 0.1605 & 0.0433 & 0.0036 & 8.2307 & 0.6859 & 0.8282 \tabularnewline
\hline
\end{tabular}
%Source: https://freestatistics.org/blog/index.php?pk=34055&T=2

[TABLE]
[ROW][C]Univariate ARIMA Extrapolation Forecast Performance[/C][/ROW]
[ROW][C]time[/C][C]% S.E.[/C][C]PE[/C][C]MAPE[/C][C]Sq.E[/C][C]MSE[/C][C]RMSE[/C][/ROW]
[ROW][C]50[/C][C]0.0687[/C][C]-0.0603[/C][C]0.005[/C][C]20.1407[/C][C]1.6784[/C][C]1.2955[/C][/ROW]
[ROW][C]51[/C][C]0.0673[/C][C]-0.0363[/C][C]0.003[/C][C]9.4502[/C][C]0.7875[/C][C]0.8874[/C][/ROW]
[ROW][C]52[/C][C]0.0809[/C][C]-0.0381[/C][C]0.0032[/C][C]8.8664[/C][C]0.7389[/C][C]0.8596[/C][/ROW]
[ROW][C]53[/C][C]0.0971[/C][C]-0.0706[/C][C]0.0059[/C][C]28.1546[/C][C]2.3462[/C][C]1.5317[/C][/ROW]
[ROW][C]54[/C][C]0.094[/C][C]0.0291[/C][C]0.0024[/C][C]5.6258[/C][C]0.4688[/C][C]0.6847[/C][/ROW]
[ROW][C]55[/C][C]0.1632[/C][C]0.0656[/C][C]0.0055[/C][C]11.1846[/C][C]0.9321[/C][C]0.9654[/C][/ROW]
[ROW][C]56[/C][C]0.1793[/C][C]0.2265[/C][C]0.0189[/C][C]122.7569[/C][C]10.2297[/C][C]3.1984[/C][/ROW]
[ROW][C]57[/C][C]0.1028[/C][C]0.0071[/C][C]6e-04[/C][C]0.4052[/C][C]0.0338[/C][C]0.1838[/C][/ROW]
[ROW][C]58[/C][C]0.1134[/C][C]-0.0918[/C][C]0.0077[/C][C]60.641[/C][C]5.0534[/C][C]2.248[/C][/ROW]
[ROW][C]59[/C][C]0.1234[/C][C]0.0568[/C][C]0.0047[/C][C]21.0406[/C][C]1.7534[/C][C]1.3242[/C][/ROW]
[ROW][C]60[/C][C]0.1367[/C][C]0.0275[/C][C]0.0023[/C][C]4.2999[/C][C]0.3583[/C][C]0.5986[/C][/ROW]
[ROW][C]61[/C][C]0.1605[/C][C]0.0433[/C][C]0.0036[/C][C]8.2307[/C][C]0.6859[/C][C]0.8282[/C][/ROW]
[/TABLE]
Source: https://freestatistics.org/blog/index.php?pk=34055&T=2

Globally Unique Identifier (entire table): ba.freestatistics.org/blog/index.php?pk=34055&T=2

As an alternative you can also use a QR Code:  

The GUIDs for individual cells are displayed in the table below:

Univariate ARIMA Extrapolation Forecast Performance
time% S.E.PEMAPESq.EMSERMSE
500.0687-0.06030.00520.14071.67841.2955
510.0673-0.03630.0039.45020.78750.8874
520.0809-0.03810.00328.86640.73890.8596
530.0971-0.07060.005928.15462.34621.5317
540.0940.02910.00245.62580.46880.6847
550.16320.06560.005511.18460.93210.9654
560.17930.22650.0189122.756910.22973.1984
570.10280.00716e-040.40520.03380.1838
580.1134-0.09180.007760.6415.05342.248
590.12340.05680.004721.04061.75341.3242
600.13670.02750.00234.29990.35830.5986
610.16050.04330.00368.23070.68590.8282


Parameters (Session):
par1 = 12 ; par2 = 1 ; par3 = 0 ; par4 = 1 ; par5 = 12 ; par6 = 3 ; par7 = 1 ; par8 = 2 ; par9 = 0 ; par10 = FALSE ;
Parameters (R input):
par1 = 12 ; par2 = 1 ; par3 = 0 ; par4 = 1 ; par5 = 12 ; par6 = 3 ; par7 = 1 ; par8 = 2 ; par9 = 0 ; par10 = FALSE ; par11 = ; par12 = ; par13 = ; par14 = ; par15 = ; par16 = ; par17 = ; par18 = ; par19 = ; par20 = ;
R code (references can be found in the software module):
par1 <- as.numeric(par1) #cut off periods
par2 <- as.numeric(par2) #lambda
par3 <- as.numeric(par3) #degree of non-seasonal differencing
par4 <- as.numeric(par4) #degree of seasonal differencing
par5 <- as.numeric(par5) #seasonal period
par6 <- as.numeric(par6) #p
par7 <- as.numeric(par7) #q
par8 <- as.numeric(par8) #P
par9 <- as.numeric(par9) #Q
if (par10 == 'TRUE') par10 <- TRUE
if (par10 == 'FALSE') par10 <- FALSE
if (par2 == 0) x <- log(x)
if (par2 != 0) x <- x^par2
lx <- length(x)
first <- lx - 2*par1
nx <- lx - par1
nx1 <- nx + 1
fx <- lx - nx
if (fx < 1) {
fx <- par5
nx1 <- lx + fx - 1
first <- lx - 2*fx
}
first <- 1
if (fx < 3) fx <- round(lx/10,0)
(arima.out <- arima(x[1:nx], order=c(par6,par3,par7), seasonal=list(order=c(par8,par4,par9), period=par5), include.mean=par10, method='ML'))
(forecast <- predict(arima.out,fx))
(lb <- forecast$pred - 1.96 * forecast$se)
(ub <- forecast$pred + 1.96 * forecast$se)
if (par2 == 0) {
x <- exp(x)
forecast$pred <- exp(forecast$pred)
lb <- exp(lb)
ub <- exp(ub)
}
if (par2 != 0) {
x <- x^(1/par2)
forecast$pred <- forecast$pred^(1/par2)
lb <- lb^(1/par2)
ub <- ub^(1/par2)
}
if (par2 < 0) {
olb <- lb
lb <- ub
ub <- olb
}
(actandfor <- c(x[1:nx], forecast$pred))
(perc.se <- (ub-forecast$pred)/1.96/forecast$pred)
bitmap(file='test1.png')
opar <- par(mar=c(4,4,2,2),las=1)
ylim <- c( min(x[first:nx],lb), max(x[first:nx],ub))
plot(x,ylim=ylim,type='n',xlim=c(first,lx))
usr <- par('usr')
rect(usr[1],usr[3],nx+1,usr[4],border=NA,col='lemonchiffon')
rect(nx1,usr[3],usr[2],usr[4],border=NA,col='lavender')
abline(h= (-3:3)*2 , col ='gray', lty =3)
polygon( c(nx1:lx,lx:nx1), c(lb,rev(ub)), col = 'orange', lty=2,border=NA)
lines(nx1:lx, lb , lty=2)
lines(nx1:lx, ub , lty=2)
lines(x, lwd=2)
lines(nx1:lx, forecast$pred , lwd=2 , col ='white')
box()
par(opar)
dev.off()
prob.dec <- array(NA, dim=fx)
prob.sdec <- array(NA, dim=fx)
prob.ldec <- array(NA, dim=fx)
prob.pval <- array(NA, dim=fx)
perf.pe <- array(0, dim=fx)
perf.mape <- array(0, dim=fx)
perf.se <- array(0, dim=fx)
perf.mse <- array(0, dim=fx)
perf.rmse <- array(0, dim=fx)
for (i in 1:fx) {
locSD <- (ub[i] - forecast$pred[i]) / 1.96
perf.pe[i] = (x[nx+i] - forecast$pred[i]) / forecast$pred[i]
perf.mape[i] = perf.mape[i] + abs(perf.pe[i])
perf.se[i] = (x[nx+i] - forecast$pred[i])^2
perf.mse[i] = perf.mse[i] + perf.se[i]
prob.dec[i] = pnorm((x[nx+i-1] - forecast$pred[i]) / locSD)
prob.sdec[i] = pnorm((x[nx+i-par5] - forecast$pred[i]) / locSD)
prob.ldec[i] = pnorm((x[nx] - forecast$pred[i]) / locSD)
prob.pval[i] = pnorm(abs(x[nx+i] - forecast$pred[i]) / locSD)
}
perf.mape = perf.mape / fx
perf.mse = perf.mse / fx
perf.rmse = sqrt(perf.mse)
bitmap(file='test2.png')
plot(forecast$pred, pch=19, type='b',main='ARIMA Extrapolation Forecast', ylab='Forecast and 95% CI', xlab='time',ylim=c(min(lb),max(ub)))
dum <- forecast$pred
dum[1:12] <- x[(nx+1):lx]
lines(dum, lty=1)
lines(ub,lty=3)
lines(lb,lty=3)
dev.off()
load(file='createtable')
a<-table.start()
a<-table.row.start(a)
a<-table.element(a,'Univariate ARIMA Extrapolation Forecast',9,TRUE)
a<-table.row.end(a)
a<-table.row.start(a)
a<-table.element(a,'time',1,header=TRUE)
a<-table.element(a,'Y[t]',1,header=TRUE)
a<-table.element(a,'F[t]',1,header=TRUE)
a<-table.element(a,'95% LB',1,header=TRUE)
a<-table.element(a,'95% UB',1,header=TRUE)
a<-table.element(a,'p-value
(H0: Y[t] = F[t])',1,header=TRUE)
a<-table.element(a,'P(F[t]>Y[t-1])',1,header=TRUE)
a<-table.element(a,'P(F[t]>Y[t-s])',1,header=TRUE)
mylab <- paste('P(F[t]>Y[',nx,sep='')
mylab <- paste(mylab,'])',sep='')
a<-table.element(a,mylab,1,header=TRUE)
a<-table.row.end(a)
for (i in (nx-par5):nx) {
a<-table.row.start(a)
a<-table.element(a,i,header=TRUE)
a<-table.element(a,x[i])
a<-table.element(a,'-')
a<-table.row.end(a)
}
for (i in 1:fx) {
a<-table.row.start(a)
a<-table.element(a,nx+i,header=TRUE)
a<-table.element(a,round(x[nx+i],4))
a<-table.element(a,round(forecast$pred[i],4))
a<-table.element(a,round(lb[i],4))
a<-table.element(a,round(ub[i],4))
a<-table.element(a,round((1-prob.pval[i]),4))
a<-table.element(a,round((1-prob.dec[i]),4))
a<-table.element(a,round((1-prob.sdec[i]),4))
a<-table.element(a,round((1-prob.ldec[i]),4))
a<-table.row.end(a)
}
a<-table.end(a)
table.save(a,file='mytable.tab')
a<-table.start()
a<-table.row.start(a)
a<-table.element(a,'Univariate ARIMA Extrapolation Forecast Performance',7,TRUE)
a<-table.row.end(a)
a<-table.row.start(a)
a<-table.element(a,'time',1,header=TRUE)
a<-table.element(a,'% S.E.',1,header=TRUE)
a<-table.element(a,'PE',1,header=TRUE)
a<-table.element(a,'MAPE',1,header=TRUE)
a<-table.element(a,'Sq.E',1,header=TRUE)
a<-table.element(a,'MSE',1,header=TRUE)
a<-table.element(a,'RMSE',1,header=TRUE)
a<-table.row.end(a)
for (i in 1:fx) {
a<-table.row.start(a)
a<-table.element(a,nx+i,header=TRUE)
a<-table.element(a,round(perc.se[i],4))
a<-table.element(a,round(perf.pe[i],4))
a<-table.element(a,round(perf.mape[i],4))
a<-table.element(a,round(perf.se[i],4))
a<-table.element(a,round(perf.mse[i],4))
a<-table.element(a,round(perf.rmse[i],4))
a<-table.row.end(a)
}
a<-table.end(a)
table.save(a,file='mytable1.tab')