Free Statistics

of Irreproducible Research!

Author's title

Author*The author of this computation has been verified*
R Software Modulerwasp_arimaforecasting.wasp
Title produced by softwareARIMA Forecasting
Date of computationTue, 16 Dec 2008 10:33:48 -0700
Cite this page as followsStatistical Computations at FreeStatistics.org, Office for Research Development and Education, URL https://freestatistics.org/blog/index.php?v=date/2008/Dec/16/t1229448870t7d3q9rjrdtuusq.htm/, Retrieved Wed, 15 May 2024 23:29:45 +0000
Statistical Computations at FreeStatistics.org, Office for Research Development and Education, URL https://freestatistics.org/blog/index.php?pk=34053, Retrieved Wed, 15 May 2024 23:29:45 +0000
QR Codes:

Original text written by user:
IsPrivate?No (this computation is public)
User-defined keywords
Estimated Impact181
Family? (F = Feedback message, R = changed R code, M = changed R Module, P = changed Parameters, D = changed Data)
F     [ARIMA Forecasting] [Opdracht 1 - Blok 21] [2008-12-11 10:08:40] [8094ad203a218aaca2d1cea2c78c2d6e]
F   P     [ARIMA Forecasting] [blok 21 Q4] [2008-12-16 17:33:48] [1237f4df7e9be807e4c0a07b90c45721] [Current]
Feedback Forum
2008-12-18 11:35:21 [Stefan Temmerman] [reply
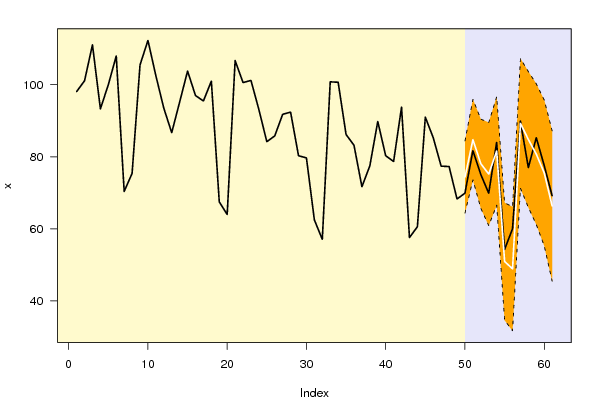
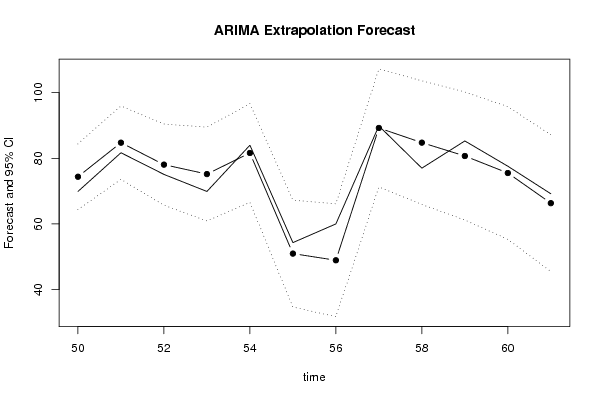
Step 4: Hier gaan we kijken naar de kolommen P(F[t]>Y[t-1]), P(F[t]>Y[t-s]) en P(F[t]>Y[85]). Deze zeggen respectievelijk de kans dat de voorspellingswaarde groter is als de vorige, de kans dat de voorspellingswaarde groter is als dezelfde maand van het vorige jaar en de kans dat de voorspellingswaarde groter is als het begin van de voorspelling.
Hier durven deze percentages wel eens te verspringen, wat duidt op een grillige grafiek voor de voorspelling.
2008-12-23 14:43:34 [c97d2ae59c98cf77a04815c1edffab5a] [reply
De onderliggende assumptie is de volgende:
Het model dat berekend wordt, gaat uit van een normaalverdeling. Alle residu’s moeten normaal verdeeld zijn. Dit kan je nakijken door de density plot, de QQ-plot, etc.. (van het ARIMA Backward Model) van de residu’s die in de vorige workshop berekend zijn, wanneer je de parameters q, Q, P en p berekende met de Backward Selection Method, te bestuderen. Op deze manier kan je zien of deze assumptie vervuld is. Wanneer dit niet het geval blijkt te zijn, zullen de p-waarde (waarschijnlijkheden) anders en minder logisch zijn, omdat dit model uitgaat van een normaalverdeling.
Normaliteit houdt in dat de waarschijnlijkheid onder de verdeling enkel berekend kan worden als je de functie weet. En om de functie te weten, ga je ervan uit dat de residu’s normaal verdeeld zijn. = Onderliggende assumptie.
je gaat kijken naar die drie laatste kolommen in de eerste tabel en je gaat naar die uitkomsten kijken, zijn die mogelijk, logisch?
-De kans dat de voorspelde waarde groter is dan de vorige gekende waarde geldt juist voor de helft van de voorspellingen
-De kans dat de voorspelde waarde groter is dan de gekende waarde 1 jaar geleden bedraagt is maar 1 maal groter dan de 50% (nl 63%) dit wil zeggen dat de waarden van voorspelling 1 jaar verder kleiner gaan zijn dan de gekende waarden van dit jaar. (dalende LT-trend)
-De kans dat de voorspellingen groter gaan zijn da de laatste gekende waarde is groot, met uitzondering van 55,56 en 61. In de laatste 2 maanden merken we al wel een daling op.
=>we moeten uitgaan van de normaalverdeling, want dat is de onderliggende assumptie om dit allemaal te kunnen berekenen en te analyseren. Stel dat je residu’s niet normaal verdeeld zouden zijn dan gaan de berekende p-waardes onverwachtse wendingen nemen, maar dit is hier niet het geval. We gaan er dus aan uit dat aan de assumptie voldaan is.


Post a new message
Dataseries X:
98,1
101,1
111,1
93,3
100
108
70,4
75,4
105,5
112,3
102,5
93,5
86,7
95,2
103,8
97
95,5
101
67,5
64
106,7
100,6
101,2
93,1
84,2
85,8
91,8
92,4
80,3
79,7
62,5
57,1
100,8
100,7
86,2
83,2
71,7
77,5
89,8
80,3
78,7
93,8
57,6
60,6
91
85,3
77,4
77,3
68,3
69,9
81,7
75,1
69,9
84
54,3
60
89,9
77
85,3
77,6
69,2


Summary of computational transaction
Raw Inputview raw input (R code)
Raw Outputview raw output of R engine
Computing time3 seconds
R Server'Gwilym Jenkins' @ 72.249.127.135

\begin{tabular}{lllllllll}
\hline
Summary of computational transaction \tabularnewline
Raw Input & view raw input (R code)  \tabularnewline
Raw Output & view raw output of R engine  \tabularnewline
Computing time & 3 seconds \tabularnewline
R Server & 'Gwilym Jenkins' @ 72.249.127.135 \tabularnewline
\hline
\end{tabular}
%Source: https://freestatistics.org/blog/index.php?pk=34053&T=0

[TABLE]
[ROW][C]Summary of computational transaction[/C][/ROW]
[ROW][C]Raw Input[/C][C]view raw input (R code) [/C][/ROW]
[ROW][C]Raw Output[/C][C]view raw output of R engine [/C][/ROW]
[ROW][C]Computing time[/C][C]3 seconds[/C][/ROW]
[ROW][C]R Server[/C][C]'Gwilym Jenkins' @ 72.249.127.135[/C][/ROW]
[/TABLE]
Source: https://freestatistics.org/blog/index.php?pk=34053&T=0

Globally Unique Identifier (entire table): ba.freestatistics.org/blog/index.php?pk=34053&T=0

As an alternative you can also use a QR Code:  

The GUIDs for individual cells are displayed in the table below:

Summary of computational transaction
Raw Inputview raw input (R code)
Raw Outputview raw output of R engine
Computing time3 seconds
R Server'Gwilym Jenkins' @ 72.249.127.135


Univariate ARIMA Extrapolation Forecast
timeY[t]F[t]95% LB95% UBp-value(H0: Y[t] = F[t])P(F[t]>Y[t-1])P(F[t]>Y[t-s])P(F[t]>Y[49])
3771.7-------
3877.5-------
3989.8-------
4080.3-------
4178.7-------
4293.8-------
4357.6-------
4460.6-------
4591-------
4685.3-------
4777.4-------
4877.3-------
4968.3-------
5069.974.387864.373284.40250.18990.88330.27120.8833
5181.784.774173.59595.95320.2950.99540.18910.9981
5275.178.077665.696590.45880.31870.28320.36250.9392
5369.975.206160.899389.51290.23360.50580.31610.828
548481.628166.582196.67420.37870.93670.05640.9587
5554.350.955734.654867.25650.343800.21220.0185
566048.920431.729166.11170.10330.26980.09150.0136
5789.989.263571.2729107.2540.47240.99930.4250.9888
587784.787265.9361103.63840.20910.29750.47870.9568
5985.380.71361.1856100.24040.32260.64530.63030.8936
6077.675.526455.296595.75630.42040.17180.43180.7581
6169.266.331145.468387.19380.39380.14490.42660.4266

\begin{tabular}{lllllllll}
\hline
Univariate ARIMA Extrapolation Forecast \tabularnewline
time & Y[t] & F[t] & 95% LB & 95% UB & p-value(H0: Y[t] = F[t]) & P(F[t]>Y[t-1]) & P(F[t]>Y[t-s]) & P(F[t]>Y[49]) \tabularnewline
37 & 71.7 & - & - & - & - & - & - & - \tabularnewline
38 & 77.5 & - & - & - & - & - & - & - \tabularnewline
39 & 89.8 & - & - & - & - & - & - & - \tabularnewline
40 & 80.3 & - & - & - & - & - & - & - \tabularnewline
41 & 78.7 & - & - & - & - & - & - & - \tabularnewline
42 & 93.8 & - & - & - & - & - & - & - \tabularnewline
43 & 57.6 & - & - & - & - & - & - & - \tabularnewline
44 & 60.6 & - & - & - & - & - & - & - \tabularnewline
45 & 91 & - & - & - & - & - & - & - \tabularnewline
46 & 85.3 & - & - & - & - & - & - & - \tabularnewline
47 & 77.4 & - & - & - & - & - & - & - \tabularnewline
48 & 77.3 & - & - & - & - & - & - & - \tabularnewline
49 & 68.3 & - & - & - & - & - & - & - \tabularnewline
50 & 69.9 & 74.3878 & 64.3732 & 84.4025 & 0.1899 & 0.8833 & 0.2712 & 0.8833 \tabularnewline
51 & 81.7 & 84.7741 & 73.595 & 95.9532 & 0.295 & 0.9954 & 0.1891 & 0.9981 \tabularnewline
52 & 75.1 & 78.0776 & 65.6965 & 90.4588 & 0.3187 & 0.2832 & 0.3625 & 0.9392 \tabularnewline
53 & 69.9 & 75.2061 & 60.8993 & 89.5129 & 0.2336 & 0.5058 & 0.3161 & 0.828 \tabularnewline
54 & 84 & 81.6281 & 66.5821 & 96.6742 & 0.3787 & 0.9367 & 0.0564 & 0.9587 \tabularnewline
55 & 54.3 & 50.9557 & 34.6548 & 67.2565 & 0.3438 & 0 & 0.2122 & 0.0185 \tabularnewline
56 & 60 & 48.9204 & 31.7291 & 66.1117 & 0.1033 & 0.2698 & 0.0915 & 0.0136 \tabularnewline
57 & 89.9 & 89.2635 & 71.2729 & 107.254 & 0.4724 & 0.9993 & 0.425 & 0.9888 \tabularnewline
58 & 77 & 84.7872 & 65.9361 & 103.6384 & 0.2091 & 0.2975 & 0.4787 & 0.9568 \tabularnewline
59 & 85.3 & 80.713 & 61.1856 & 100.2404 & 0.3226 & 0.6453 & 0.6303 & 0.8936 \tabularnewline
60 & 77.6 & 75.5264 & 55.2965 & 95.7563 & 0.4204 & 0.1718 & 0.4318 & 0.7581 \tabularnewline
61 & 69.2 & 66.3311 & 45.4683 & 87.1938 & 0.3938 & 0.1449 & 0.4266 & 0.4266 \tabularnewline
\hline
\end{tabular}
%Source: https://freestatistics.org/blog/index.php?pk=34053&T=1

[TABLE]
[ROW][C]Univariate ARIMA Extrapolation Forecast[/C][/ROW]
[ROW][C]time[/C][C]Y[t][/C][C]F[t][/C][C]95% LB[/C][C]95% UB[/C][C]p-value(H0: Y[t] = F[t])[/C][C]P(F[t]>Y[t-1])[/C][C]P(F[t]>Y[t-s])[/C][C]P(F[t]>Y[49])[/C][/ROW]
[ROW][C]37[/C][C]71.7[/C][C]-[/C][C]-[/C][C]-[/C][C]-[/C][C]-[/C][C]-[/C][C]-[/C][/ROW]
[ROW][C]38[/C][C]77.5[/C][C]-[/C][C]-[/C][C]-[/C][C]-[/C][C]-[/C][C]-[/C][C]-[/C][/ROW]
[ROW][C]39[/C][C]89.8[/C][C]-[/C][C]-[/C][C]-[/C][C]-[/C][C]-[/C][C]-[/C][C]-[/C][/ROW]
[ROW][C]40[/C][C]80.3[/C][C]-[/C][C]-[/C][C]-[/C][C]-[/C][C]-[/C][C]-[/C][C]-[/C][/ROW]
[ROW][C]41[/C][C]78.7[/C][C]-[/C][C]-[/C][C]-[/C][C]-[/C][C]-[/C][C]-[/C][C]-[/C][/ROW]
[ROW][C]42[/C][C]93.8[/C][C]-[/C][C]-[/C][C]-[/C][C]-[/C][C]-[/C][C]-[/C][C]-[/C][/ROW]
[ROW][C]43[/C][C]57.6[/C][C]-[/C][C]-[/C][C]-[/C][C]-[/C][C]-[/C][C]-[/C][C]-[/C][/ROW]
[ROW][C]44[/C][C]60.6[/C][C]-[/C][C]-[/C][C]-[/C][C]-[/C][C]-[/C][C]-[/C][C]-[/C][/ROW]
[ROW][C]45[/C][C]91[/C][C]-[/C][C]-[/C][C]-[/C][C]-[/C][C]-[/C][C]-[/C][C]-[/C][/ROW]
[ROW][C]46[/C][C]85.3[/C][C]-[/C][C]-[/C][C]-[/C][C]-[/C][C]-[/C][C]-[/C][C]-[/C][/ROW]
[ROW][C]47[/C][C]77.4[/C][C]-[/C][C]-[/C][C]-[/C][C]-[/C][C]-[/C][C]-[/C][C]-[/C][/ROW]
[ROW][C]48[/C][C]77.3[/C][C]-[/C][C]-[/C][C]-[/C][C]-[/C][C]-[/C][C]-[/C][C]-[/C][/ROW]
[ROW][C]49[/C][C]68.3[/C][C]-[/C][C]-[/C][C]-[/C][C]-[/C][C]-[/C][C]-[/C][C]-[/C][/ROW]
[ROW][C]50[/C][C]69.9[/C][C]74.3878[/C][C]64.3732[/C][C]84.4025[/C][C]0.1899[/C][C]0.8833[/C][C]0.2712[/C][C]0.8833[/C][/ROW]
[ROW][C]51[/C][C]81.7[/C][C]84.7741[/C][C]73.595[/C][C]95.9532[/C][C]0.295[/C][C]0.9954[/C][C]0.1891[/C][C]0.9981[/C][/ROW]
[ROW][C]52[/C][C]75.1[/C][C]78.0776[/C][C]65.6965[/C][C]90.4588[/C][C]0.3187[/C][C]0.2832[/C][C]0.3625[/C][C]0.9392[/C][/ROW]
[ROW][C]53[/C][C]69.9[/C][C]75.2061[/C][C]60.8993[/C][C]89.5129[/C][C]0.2336[/C][C]0.5058[/C][C]0.3161[/C][C]0.828[/C][/ROW]
[ROW][C]54[/C][C]84[/C][C]81.6281[/C][C]66.5821[/C][C]96.6742[/C][C]0.3787[/C][C]0.9367[/C][C]0.0564[/C][C]0.9587[/C][/ROW]
[ROW][C]55[/C][C]54.3[/C][C]50.9557[/C][C]34.6548[/C][C]67.2565[/C][C]0.3438[/C][C]0[/C][C]0.2122[/C][C]0.0185[/C][/ROW]
[ROW][C]56[/C][C]60[/C][C]48.9204[/C][C]31.7291[/C][C]66.1117[/C][C]0.1033[/C][C]0.2698[/C][C]0.0915[/C][C]0.0136[/C][/ROW]
[ROW][C]57[/C][C]89.9[/C][C]89.2635[/C][C]71.2729[/C][C]107.254[/C][C]0.4724[/C][C]0.9993[/C][C]0.425[/C][C]0.9888[/C][/ROW]
[ROW][C]58[/C][C]77[/C][C]84.7872[/C][C]65.9361[/C][C]103.6384[/C][C]0.2091[/C][C]0.2975[/C][C]0.4787[/C][C]0.9568[/C][/ROW]
[ROW][C]59[/C][C]85.3[/C][C]80.713[/C][C]61.1856[/C][C]100.2404[/C][C]0.3226[/C][C]0.6453[/C][C]0.6303[/C][C]0.8936[/C][/ROW]
[ROW][C]60[/C][C]77.6[/C][C]75.5264[/C][C]55.2965[/C][C]95.7563[/C][C]0.4204[/C][C]0.1718[/C][C]0.4318[/C][C]0.7581[/C][/ROW]
[ROW][C]61[/C][C]69.2[/C][C]66.3311[/C][C]45.4683[/C][C]87.1938[/C][C]0.3938[/C][C]0.1449[/C][C]0.4266[/C][C]0.4266[/C][/ROW]
[/TABLE]
Source: https://freestatistics.org/blog/index.php?pk=34053&T=1

Globally Unique Identifier (entire table): ba.freestatistics.org/blog/index.php?pk=34053&T=1

As an alternative you can also use a QR Code:  

The GUIDs for individual cells are displayed in the table below:

Univariate ARIMA Extrapolation Forecast
timeY[t]F[t]95% LB95% UBp-value(H0: Y[t] = F[t])P(F[t]>Y[t-1])P(F[t]>Y[t-s])P(F[t]>Y[49])
3771.7-------
3877.5-------
3989.8-------
4080.3-------
4178.7-------
4293.8-------
4357.6-------
4460.6-------
4591-------
4685.3-------
4777.4-------
4877.3-------
4968.3-------
5069.974.387864.373284.40250.18990.88330.27120.8833
5181.784.774173.59595.95320.2950.99540.18910.9981
5275.178.077665.696590.45880.31870.28320.36250.9392
5369.975.206160.899389.51290.23360.50580.31610.828
548481.628166.582196.67420.37870.93670.05640.9587
5554.350.955734.654867.25650.343800.21220.0185
566048.920431.729166.11170.10330.26980.09150.0136
5789.989.263571.2729107.2540.47240.99930.4250.9888
587784.787265.9361103.63840.20910.29750.47870.9568
5985.380.71361.1856100.24040.32260.64530.63030.8936
6077.675.526455.296595.75630.42040.17180.43180.7581
6169.266.331145.468387.19380.39380.14490.42660.4266


Univariate ARIMA Extrapolation Forecast Performance
time% S.E.PEMAPESq.EMSERMSE
500.0687-0.06030.00520.14071.67841.2955
510.0673-0.03630.0039.45020.78750.8874
520.0809-0.03810.00328.86640.73890.8596
530.0971-0.07060.005928.15462.34621.5317
540.0940.02910.00245.62580.46880.6847
550.16320.06560.005511.18460.93210.9654
560.17930.22650.0189122.756910.22973.1984
570.10280.00716e-040.40520.03380.1838
580.1134-0.09180.007760.6415.05342.248
590.12340.05680.004721.04061.75341.3242
600.13670.02750.00234.29990.35830.5986
610.16050.04330.00368.23070.68590.8282

\begin{tabular}{lllllllll}
\hline
Univariate ARIMA Extrapolation Forecast Performance \tabularnewline
time & % S.E. & PE & MAPE & Sq.E & MSE & RMSE \tabularnewline
50 & 0.0687 & -0.0603 & 0.005 & 20.1407 & 1.6784 & 1.2955 \tabularnewline
51 & 0.0673 & -0.0363 & 0.003 & 9.4502 & 0.7875 & 0.8874 \tabularnewline
52 & 0.0809 & -0.0381 & 0.0032 & 8.8664 & 0.7389 & 0.8596 \tabularnewline
53 & 0.0971 & -0.0706 & 0.0059 & 28.1546 & 2.3462 & 1.5317 \tabularnewline
54 & 0.094 & 0.0291 & 0.0024 & 5.6258 & 0.4688 & 0.6847 \tabularnewline
55 & 0.1632 & 0.0656 & 0.0055 & 11.1846 & 0.9321 & 0.9654 \tabularnewline
56 & 0.1793 & 0.2265 & 0.0189 & 122.7569 & 10.2297 & 3.1984 \tabularnewline
57 & 0.1028 & 0.0071 & 6e-04 & 0.4052 & 0.0338 & 0.1838 \tabularnewline
58 & 0.1134 & -0.0918 & 0.0077 & 60.641 & 5.0534 & 2.248 \tabularnewline
59 & 0.1234 & 0.0568 & 0.0047 & 21.0406 & 1.7534 & 1.3242 \tabularnewline
60 & 0.1367 & 0.0275 & 0.0023 & 4.2999 & 0.3583 & 0.5986 \tabularnewline
61 & 0.1605 & 0.0433 & 0.0036 & 8.2307 & 0.6859 & 0.8282 \tabularnewline
\hline
\end{tabular}
%Source: https://freestatistics.org/blog/index.php?pk=34053&T=2

[TABLE]
[ROW][C]Univariate ARIMA Extrapolation Forecast Performance[/C][/ROW]
[ROW][C]time[/C][C]% S.E.[/C][C]PE[/C][C]MAPE[/C][C]Sq.E[/C][C]MSE[/C][C]RMSE[/C][/ROW]
[ROW][C]50[/C][C]0.0687[/C][C]-0.0603[/C][C]0.005[/C][C]20.1407[/C][C]1.6784[/C][C]1.2955[/C][/ROW]
[ROW][C]51[/C][C]0.0673[/C][C]-0.0363[/C][C]0.003[/C][C]9.4502[/C][C]0.7875[/C][C]0.8874[/C][/ROW]
[ROW][C]52[/C][C]0.0809[/C][C]-0.0381[/C][C]0.0032[/C][C]8.8664[/C][C]0.7389[/C][C]0.8596[/C][/ROW]
[ROW][C]53[/C][C]0.0971[/C][C]-0.0706[/C][C]0.0059[/C][C]28.1546[/C][C]2.3462[/C][C]1.5317[/C][/ROW]
[ROW][C]54[/C][C]0.094[/C][C]0.0291[/C][C]0.0024[/C][C]5.6258[/C][C]0.4688[/C][C]0.6847[/C][/ROW]
[ROW][C]55[/C][C]0.1632[/C][C]0.0656[/C][C]0.0055[/C][C]11.1846[/C][C]0.9321[/C][C]0.9654[/C][/ROW]
[ROW][C]56[/C][C]0.1793[/C][C]0.2265[/C][C]0.0189[/C][C]122.7569[/C][C]10.2297[/C][C]3.1984[/C][/ROW]
[ROW][C]57[/C][C]0.1028[/C][C]0.0071[/C][C]6e-04[/C][C]0.4052[/C][C]0.0338[/C][C]0.1838[/C][/ROW]
[ROW][C]58[/C][C]0.1134[/C][C]-0.0918[/C][C]0.0077[/C][C]60.641[/C][C]5.0534[/C][C]2.248[/C][/ROW]
[ROW][C]59[/C][C]0.1234[/C][C]0.0568[/C][C]0.0047[/C][C]21.0406[/C][C]1.7534[/C][C]1.3242[/C][/ROW]
[ROW][C]60[/C][C]0.1367[/C][C]0.0275[/C][C]0.0023[/C][C]4.2999[/C][C]0.3583[/C][C]0.5986[/C][/ROW]
[ROW][C]61[/C][C]0.1605[/C][C]0.0433[/C][C]0.0036[/C][C]8.2307[/C][C]0.6859[/C][C]0.8282[/C][/ROW]
[/TABLE]
Source: https://freestatistics.org/blog/index.php?pk=34053&T=2

Globally Unique Identifier (entire table): ba.freestatistics.org/blog/index.php?pk=34053&T=2

As an alternative you can also use a QR Code:  

The GUIDs for individual cells are displayed in the table below:

Univariate ARIMA Extrapolation Forecast Performance
time% S.E.PEMAPESq.EMSERMSE
500.0687-0.06030.00520.14071.67841.2955
510.0673-0.03630.0039.45020.78750.8874
520.0809-0.03810.00328.86640.73890.8596
530.0971-0.07060.005928.15462.34621.5317
540.0940.02910.00245.62580.46880.6847
550.16320.06560.005511.18460.93210.9654
560.17930.22650.0189122.756910.22973.1984
570.10280.00716e-040.40520.03380.1838
580.1134-0.09180.007760.6415.05342.248
590.12340.05680.004721.04061.75341.3242
600.13670.02750.00234.29990.35830.5986
610.16050.04330.00368.23070.68590.8282


Parameters (Session):
par1 = 12 ; par2 = 1 ; par3 = 0 ; par4 = 1 ; par5 = 12 ; par6 = 3 ; par7 = 1 ; par8 = 2 ; par9 = 0 ; par10 = FALSE ;
Parameters (R input):
par1 = 12 ; par2 = 1 ; par3 = 0 ; par4 = 1 ; par5 = 12 ; par6 = 3 ; par7 = 1 ; par8 = 2 ; par9 = 0 ; par10 = FALSE ; par11 = ; par12 = ; par13 = ; par14 = ; par15 = ; par16 = ; par17 = ; par18 = ; par19 = ; par20 = ;
R code (references can be found in the software module):
par1 <- as.numeric(par1) #cut off periods
par2 <- as.numeric(par2) #lambda
par3 <- as.numeric(par3) #degree of non-seasonal differencing
par4 <- as.numeric(par4) #degree of seasonal differencing
par5 <- as.numeric(par5) #seasonal period
par6 <- as.numeric(par6) #p
par7 <- as.numeric(par7) #q
par8 <- as.numeric(par8) #P
par9 <- as.numeric(par9) #Q
if (par10 == 'TRUE') par10 <- TRUE
if (par10 == 'FALSE') par10 <- FALSE
if (par2 == 0) x <- log(x)
if (par2 != 0) x <- x^par2
lx <- length(x)
first <- lx - 2*par1
nx <- lx - par1
nx1 <- nx + 1
fx <- lx - nx
if (fx < 1) {
fx <- par5
nx1 <- lx + fx - 1
first <- lx - 2*fx
}
first <- 1
if (fx < 3) fx <- round(lx/10,0)
(arima.out <- arima(x[1:nx], order=c(par6,par3,par7), seasonal=list(order=c(par8,par4,par9), period=par5), include.mean=par10, method='ML'))
(forecast <- predict(arima.out,fx))
(lb <- forecast$pred - 1.96 * forecast$se)
(ub <- forecast$pred + 1.96 * forecast$se)
if (par2 == 0) {
x <- exp(x)
forecast$pred <- exp(forecast$pred)
lb <- exp(lb)
ub <- exp(ub)
}
if (par2 != 0) {
x <- x^(1/par2)
forecast$pred <- forecast$pred^(1/par2)
lb <- lb^(1/par2)
ub <- ub^(1/par2)
}
if (par2 < 0) {
olb <- lb
lb <- ub
ub <- olb
}
(actandfor <- c(x[1:nx], forecast$pred))
(perc.se <- (ub-forecast$pred)/1.96/forecast$pred)
bitmap(file='test1.png')
opar <- par(mar=c(4,4,2,2),las=1)
ylim <- c( min(x[first:nx],lb), max(x[first:nx],ub))
plot(x,ylim=ylim,type='n',xlim=c(first,lx))
usr <- par('usr')
rect(usr[1],usr[3],nx+1,usr[4],border=NA,col='lemonchiffon')
rect(nx1,usr[3],usr[2],usr[4],border=NA,col='lavender')
abline(h= (-3:3)*2 , col ='gray', lty =3)
polygon( c(nx1:lx,lx:nx1), c(lb,rev(ub)), col = 'orange', lty=2,border=NA)
lines(nx1:lx, lb , lty=2)
lines(nx1:lx, ub , lty=2)
lines(x, lwd=2)
lines(nx1:lx, forecast$pred , lwd=2 , col ='white')
box()
par(opar)
dev.off()
prob.dec <- array(NA, dim=fx)
prob.sdec <- array(NA, dim=fx)
prob.ldec <- array(NA, dim=fx)
prob.pval <- array(NA, dim=fx)
perf.pe <- array(0, dim=fx)
perf.mape <- array(0, dim=fx)
perf.se <- array(0, dim=fx)
perf.mse <- array(0, dim=fx)
perf.rmse <- array(0, dim=fx)
for (i in 1:fx) {
locSD <- (ub[i] - forecast$pred[i]) / 1.96
perf.pe[i] = (x[nx+i] - forecast$pred[i]) / forecast$pred[i]
perf.mape[i] = perf.mape[i] + abs(perf.pe[i])
perf.se[i] = (x[nx+i] - forecast$pred[i])^2
perf.mse[i] = perf.mse[i] + perf.se[i]
prob.dec[i] = pnorm((x[nx+i-1] - forecast$pred[i]) / locSD)
prob.sdec[i] = pnorm((x[nx+i-par5] - forecast$pred[i]) / locSD)
prob.ldec[i] = pnorm((x[nx] - forecast$pred[i]) / locSD)
prob.pval[i] = pnorm(abs(x[nx+i] - forecast$pred[i]) / locSD)
}
perf.mape = perf.mape / fx
perf.mse = perf.mse / fx
perf.rmse = sqrt(perf.mse)
bitmap(file='test2.png')
plot(forecast$pred, pch=19, type='b',main='ARIMA Extrapolation Forecast', ylab='Forecast and 95% CI', xlab='time',ylim=c(min(lb),max(ub)))
dum <- forecast$pred
dum[1:12] <- x[(nx+1):lx]
lines(dum, lty=1)
lines(ub,lty=3)
lines(lb,lty=3)
dev.off()
load(file='createtable')
a<-table.start()
a<-table.row.start(a)
a<-table.element(a,'Univariate ARIMA Extrapolation Forecast',9,TRUE)
a<-table.row.end(a)
a<-table.row.start(a)
a<-table.element(a,'time',1,header=TRUE)
a<-table.element(a,'Y[t]',1,header=TRUE)
a<-table.element(a,'F[t]',1,header=TRUE)
a<-table.element(a,'95% LB',1,header=TRUE)
a<-table.element(a,'95% UB',1,header=TRUE)
a<-table.element(a,'p-value
(H0: Y[t] = F[t])',1,header=TRUE)
a<-table.element(a,'P(F[t]>Y[t-1])',1,header=TRUE)
a<-table.element(a,'P(F[t]>Y[t-s])',1,header=TRUE)
mylab <- paste('P(F[t]>Y[',nx,sep='')
mylab <- paste(mylab,'])',sep='')
a<-table.element(a,mylab,1,header=TRUE)
a<-table.row.end(a)
for (i in (nx-par5):nx) {
a<-table.row.start(a)
a<-table.element(a,i,header=TRUE)
a<-table.element(a,x[i])
a<-table.element(a,'-')
a<-table.row.end(a)
}
for (i in 1:fx) {
a<-table.row.start(a)
a<-table.element(a,nx+i,header=TRUE)
a<-table.element(a,round(x[nx+i],4))
a<-table.element(a,round(forecast$pred[i],4))
a<-table.element(a,round(lb[i],4))
a<-table.element(a,round(ub[i],4))
a<-table.element(a,round((1-prob.pval[i]),4))
a<-table.element(a,round((1-prob.dec[i]),4))
a<-table.element(a,round((1-prob.sdec[i]),4))
a<-table.element(a,round((1-prob.ldec[i]),4))
a<-table.row.end(a)
}
a<-table.end(a)
table.save(a,file='mytable.tab')
a<-table.start()
a<-table.row.start(a)
a<-table.element(a,'Univariate ARIMA Extrapolation Forecast Performance',7,TRUE)
a<-table.row.end(a)
a<-table.row.start(a)
a<-table.element(a,'time',1,header=TRUE)
a<-table.element(a,'% S.E.',1,header=TRUE)
a<-table.element(a,'PE',1,header=TRUE)
a<-table.element(a,'MAPE',1,header=TRUE)
a<-table.element(a,'Sq.E',1,header=TRUE)
a<-table.element(a,'MSE',1,header=TRUE)
a<-table.element(a,'RMSE',1,header=TRUE)
a<-table.row.end(a)
for (i in 1:fx) {
a<-table.row.start(a)
a<-table.element(a,nx+i,header=TRUE)
a<-table.element(a,round(perc.se[i],4))
a<-table.element(a,round(perf.pe[i],4))
a<-table.element(a,round(perf.mape[i],4))
a<-table.element(a,round(perf.se[i],4))
a<-table.element(a,round(perf.mse[i],4))
a<-table.element(a,round(perf.rmse[i],4))
a<-table.row.end(a)
}
a<-table.end(a)
table.save(a,file='mytable1.tab')