Free Statistics

of Irreproducible Research!

Author's title

Author*The author of this computation has been verified*
R Software Modulerwasp_arimaforecasting.wasp
Title produced by softwareARIMA Forecasting
Date of computationTue, 16 Dec 2008 10:32:49 -0700
Cite this page as followsStatistical Computations at FreeStatistics.org, Office for Research Development and Education, URL https://freestatistics.org/blog/index.php?v=date/2008/Dec/16/t1229448805lmaw2i779o7248y.htm/, Retrieved Wed, 15 May 2024 07:30:53 +0000
Statistical Computations at FreeStatistics.org, Office for Research Development and Education, URL https://freestatistics.org/blog/index.php?pk=34051, Retrieved Wed, 15 May 2024 07:30:53 +0000
QR Codes:

Original text written by user:
IsPrivate?No (this computation is public)
User-defined keywords
Estimated Impact162
Family? (F = Feedback message, R = changed R code, M = changed R Module, P = changed Parameters, D = changed Data)
F     [ARIMA Forecasting] [Opdracht 1 - Blok 21] [2008-12-11 10:08:40] [8094ad203a218aaca2d1cea2c78c2d6e]
F   P     [ARIMA Forecasting] [blok 21 Q3] [2008-12-16 17:32:49] [1237f4df7e9be807e4c0a07b90c45721] [Current]
Feedback Forum
2008-12-18 11:32:37 [Stefan Temmerman] [reply
Step 3: De student kijkt correct naar de tabel van de standaardfouten en de werkelijke fouten. De %SE is doorgaans niet al te hoog, wat wijst op doorgaans goede voorspelling. Wel wordt hier maand 56 in twijfel getrokken, met een voorspelde SE van 17%. Door de grote maandelijkse schokken in de voorspelling, valt de 17% wel mee, maar dit hangt af van een vooropgestelde fout die je mag maken voor de tijdreeks. Mijn mening zegt dat 17% nog OK is, en nog goede voorspellingen kunnen maken.
2008-12-23 14:41:30 [c97d2ae59c98cf77a04815c1edffab5a] [reply
we merken op dat onze standaardafwijking naar de toekomst toe steeds groter wordt. Dit is ook logisch, omdat: hoe verder we naar de toekomst toe voorspellen, hoe groter de kans dat onze voorspelling fout zit.
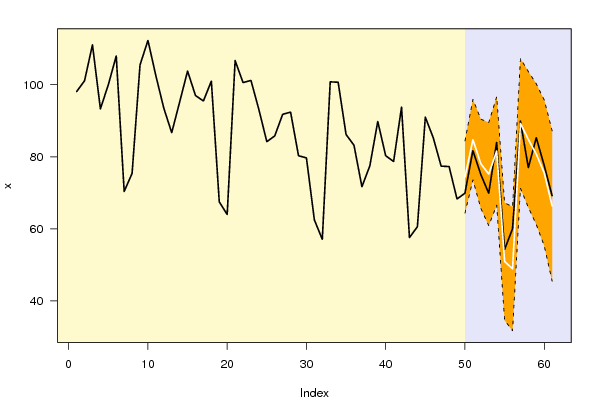
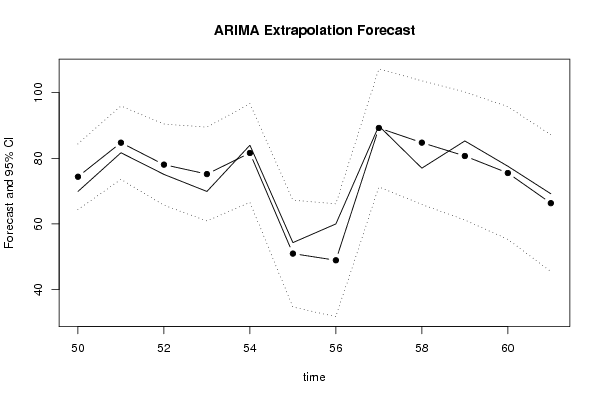
Bij periode 56 zien we dat de werkelijke voorspellingsfout de standaardfout (interval waarin voorspellingsfout mag variëren) overschrijdt. Dit kan de te maken hebben met een outlier of er moet in die maand iets exceptioneel gebeurd zijn, waar een economische reden achter ligt, omdat we uitgaan van een ceteris-paribus voorspelling. We kunnen ook opmerken dat onze standaardfout geen uitzonderlijk hoge stijging ondergaat, in de 2 laatste maanden daalt ze zelfs. Als we de gehele tijdreeks bekijken zien we dat de maximale voorspellingsfout 17% bedraagt. We kunnen ook afleiden uit te tabel dat onze laagste voorspellingsfout 6%. Het klopt dus dat er een stijging plaats vindt van de voorspellingsfout doordat we verder in de toekomst gaan voorspellen en er vindt geen extreme, maar geleidelijke stijging plaats, met een uitzondering in periode 55 en 56. In deze maand moet er iets uitzonderlijks zijn gebeurd, wat de plotse stijging van de standaardfout kan verklaren. Deze stijging zal ook weerspiegeld worden in de grafiek die je 12 voorspelde maanden vergroot uitzet: in deze periodes bevindt zich de grootste afwijking tussen de voorspelde en werkelijke waarde.
Kortom kunnen we besluiten dat deze voorspellingsfouten getoond in de tabel mogelijk zijn voor onze tijdreeks, omdat we toch te maken hebben met een vrij wisselvallige tijdreeks(veel pieken en dallen) en onze maximale standaardfout slechts 17% bedraagt.
conclusie: we kunnen besluiten dat we onze tijdreeks vrij nauwkeurig kunnen voorspellen

Post a new message
Dataseries X:
98,1
101,1
111,1
93,3
100
108
70,4
75,4
105,5
112,3
102,5
93,5
86,7
95,2
103,8
97
95,5
101
67,5
64
106,7
100,6
101,2
93,1
84,2
85,8
91,8
92,4
80,3
79,7
62,5
57,1
100,8
100,7
86,2
83,2
71,7
77,5
89,8
80,3
78,7
93,8
57,6
60,6
91
85,3
77,4
77,3
68,3
69,9
81,7
75,1
69,9
84
54,3
60
89,9
77
85,3
77,6
69,2


Summary of computational transaction
Raw Inputview raw input (R code)
Raw Outputview raw output of R engine
Computing time2 seconds
R Server'Gwilym Jenkins' @ 72.249.127.135

\begin{tabular}{lllllllll}
\hline
Summary of computational transaction \tabularnewline
Raw Input & view raw input (R code)  \tabularnewline
Raw Output & view raw output of R engine  \tabularnewline
Computing time & 2 seconds \tabularnewline
R Server & 'Gwilym Jenkins' @ 72.249.127.135 \tabularnewline
\hline
\end{tabular}
%Source: https://freestatistics.org/blog/index.php?pk=34051&T=0

[TABLE]
[ROW][C]Summary of computational transaction[/C][/ROW]
[ROW][C]Raw Input[/C][C]view raw input (R code) [/C][/ROW]
[ROW][C]Raw Output[/C][C]view raw output of R engine [/C][/ROW]
[ROW][C]Computing time[/C][C]2 seconds[/C][/ROW]
[ROW][C]R Server[/C][C]'Gwilym Jenkins' @ 72.249.127.135[/C][/ROW]
[/TABLE]
Source: https://freestatistics.org/blog/index.php?pk=34051&T=0

Globally Unique Identifier (entire table): ba.freestatistics.org/blog/index.php?pk=34051&T=0

As an alternative you can also use a QR Code:  

The GUIDs for individual cells are displayed in the table below:

Summary of computational transaction
Raw Inputview raw input (R code)
Raw Outputview raw output of R engine
Computing time2 seconds
R Server'Gwilym Jenkins' @ 72.249.127.135


Univariate ARIMA Extrapolation Forecast
timeY[t]F[t]95% LB95% UBp-value(H0: Y[t] = F[t])P(F[t]>Y[t-1])P(F[t]>Y[t-s])P(F[t]>Y[49])
3771.7-------
3877.5-------
3989.8-------
4080.3-------
4178.7-------
4293.8-------
4357.6-------
4460.6-------
4591-------
4685.3-------
4777.4-------
4877.3-------
4968.3-------
5069.974.387864.373284.40250.18990.88330.27120.8833
5181.784.774173.59595.95320.2950.99540.18910.9981
5275.178.077665.696590.45880.31870.28320.36250.9392
5369.975.206160.899389.51290.23360.50580.31610.828
548481.628166.582196.67420.37870.93670.05640.9587
5554.350.955734.654867.25650.343800.21220.0185
566048.920431.729166.11170.10330.26980.09150.0136
5789.989.263571.2729107.2540.47240.99930.4250.9888
587784.787265.9361103.63840.20910.29750.47870.9568
5985.380.71361.1856100.24040.32260.64530.63030.8936
6077.675.526455.296595.75630.42040.17180.43180.7581
6169.266.331145.468387.19380.39380.14490.42660.4266

\begin{tabular}{lllllllll}
\hline
Univariate ARIMA Extrapolation Forecast \tabularnewline
time & Y[t] & F[t] & 95% LB & 95% UB & p-value(H0: Y[t] = F[t]) & P(F[t]>Y[t-1]) & P(F[t]>Y[t-s]) & P(F[t]>Y[49]) \tabularnewline
37 & 71.7 & - & - & - & - & - & - & - \tabularnewline
38 & 77.5 & - & - & - & - & - & - & - \tabularnewline
39 & 89.8 & - & - & - & - & - & - & - \tabularnewline
40 & 80.3 & - & - & - & - & - & - & - \tabularnewline
41 & 78.7 & - & - & - & - & - & - & - \tabularnewline
42 & 93.8 & - & - & - & - & - & - & - \tabularnewline
43 & 57.6 & - & - & - & - & - & - & - \tabularnewline
44 & 60.6 & - & - & - & - & - & - & - \tabularnewline
45 & 91 & - & - & - & - & - & - & - \tabularnewline
46 & 85.3 & - & - & - & - & - & - & - \tabularnewline
47 & 77.4 & - & - & - & - & - & - & - \tabularnewline
48 & 77.3 & - & - & - & - & - & - & - \tabularnewline
49 & 68.3 & - & - & - & - & - & - & - \tabularnewline
50 & 69.9 & 74.3878 & 64.3732 & 84.4025 & 0.1899 & 0.8833 & 0.2712 & 0.8833 \tabularnewline
51 & 81.7 & 84.7741 & 73.595 & 95.9532 & 0.295 & 0.9954 & 0.1891 & 0.9981 \tabularnewline
52 & 75.1 & 78.0776 & 65.6965 & 90.4588 & 0.3187 & 0.2832 & 0.3625 & 0.9392 \tabularnewline
53 & 69.9 & 75.2061 & 60.8993 & 89.5129 & 0.2336 & 0.5058 & 0.3161 & 0.828 \tabularnewline
54 & 84 & 81.6281 & 66.5821 & 96.6742 & 0.3787 & 0.9367 & 0.0564 & 0.9587 \tabularnewline
55 & 54.3 & 50.9557 & 34.6548 & 67.2565 & 0.3438 & 0 & 0.2122 & 0.0185 \tabularnewline
56 & 60 & 48.9204 & 31.7291 & 66.1117 & 0.1033 & 0.2698 & 0.0915 & 0.0136 \tabularnewline
57 & 89.9 & 89.2635 & 71.2729 & 107.254 & 0.4724 & 0.9993 & 0.425 & 0.9888 \tabularnewline
58 & 77 & 84.7872 & 65.9361 & 103.6384 & 0.2091 & 0.2975 & 0.4787 & 0.9568 \tabularnewline
59 & 85.3 & 80.713 & 61.1856 & 100.2404 & 0.3226 & 0.6453 & 0.6303 & 0.8936 \tabularnewline
60 & 77.6 & 75.5264 & 55.2965 & 95.7563 & 0.4204 & 0.1718 & 0.4318 & 0.7581 \tabularnewline
61 & 69.2 & 66.3311 & 45.4683 & 87.1938 & 0.3938 & 0.1449 & 0.4266 & 0.4266 \tabularnewline
\hline
\end{tabular}
%Source: https://freestatistics.org/blog/index.php?pk=34051&T=1

[TABLE]
[ROW][C]Univariate ARIMA Extrapolation Forecast[/C][/ROW]
[ROW][C]time[/C][C]Y[t][/C][C]F[t][/C][C]95% LB[/C][C]95% UB[/C][C]p-value(H0: Y[t] = F[t])[/C][C]P(F[t]>Y[t-1])[/C][C]P(F[t]>Y[t-s])[/C][C]P(F[t]>Y[49])[/C][/ROW]
[ROW][C]37[/C][C]71.7[/C][C]-[/C][C]-[/C][C]-[/C][C]-[/C][C]-[/C][C]-[/C][C]-[/C][/ROW]
[ROW][C]38[/C][C]77.5[/C][C]-[/C][C]-[/C][C]-[/C][C]-[/C][C]-[/C][C]-[/C][C]-[/C][/ROW]
[ROW][C]39[/C][C]89.8[/C][C]-[/C][C]-[/C][C]-[/C][C]-[/C][C]-[/C][C]-[/C][C]-[/C][/ROW]
[ROW][C]40[/C][C]80.3[/C][C]-[/C][C]-[/C][C]-[/C][C]-[/C][C]-[/C][C]-[/C][C]-[/C][/ROW]
[ROW][C]41[/C][C]78.7[/C][C]-[/C][C]-[/C][C]-[/C][C]-[/C][C]-[/C][C]-[/C][C]-[/C][/ROW]
[ROW][C]42[/C][C]93.8[/C][C]-[/C][C]-[/C][C]-[/C][C]-[/C][C]-[/C][C]-[/C][C]-[/C][/ROW]
[ROW][C]43[/C][C]57.6[/C][C]-[/C][C]-[/C][C]-[/C][C]-[/C][C]-[/C][C]-[/C][C]-[/C][/ROW]
[ROW][C]44[/C][C]60.6[/C][C]-[/C][C]-[/C][C]-[/C][C]-[/C][C]-[/C][C]-[/C][C]-[/C][/ROW]
[ROW][C]45[/C][C]91[/C][C]-[/C][C]-[/C][C]-[/C][C]-[/C][C]-[/C][C]-[/C][C]-[/C][/ROW]
[ROW][C]46[/C][C]85.3[/C][C]-[/C][C]-[/C][C]-[/C][C]-[/C][C]-[/C][C]-[/C][C]-[/C][/ROW]
[ROW][C]47[/C][C]77.4[/C][C]-[/C][C]-[/C][C]-[/C][C]-[/C][C]-[/C][C]-[/C][C]-[/C][/ROW]
[ROW][C]48[/C][C]77.3[/C][C]-[/C][C]-[/C][C]-[/C][C]-[/C][C]-[/C][C]-[/C][C]-[/C][/ROW]
[ROW][C]49[/C][C]68.3[/C][C]-[/C][C]-[/C][C]-[/C][C]-[/C][C]-[/C][C]-[/C][C]-[/C][/ROW]
[ROW][C]50[/C][C]69.9[/C][C]74.3878[/C][C]64.3732[/C][C]84.4025[/C][C]0.1899[/C][C]0.8833[/C][C]0.2712[/C][C]0.8833[/C][/ROW]
[ROW][C]51[/C][C]81.7[/C][C]84.7741[/C][C]73.595[/C][C]95.9532[/C][C]0.295[/C][C]0.9954[/C][C]0.1891[/C][C]0.9981[/C][/ROW]
[ROW][C]52[/C][C]75.1[/C][C]78.0776[/C][C]65.6965[/C][C]90.4588[/C][C]0.3187[/C][C]0.2832[/C][C]0.3625[/C][C]0.9392[/C][/ROW]
[ROW][C]53[/C][C]69.9[/C][C]75.2061[/C][C]60.8993[/C][C]89.5129[/C][C]0.2336[/C][C]0.5058[/C][C]0.3161[/C][C]0.828[/C][/ROW]
[ROW][C]54[/C][C]84[/C][C]81.6281[/C][C]66.5821[/C][C]96.6742[/C][C]0.3787[/C][C]0.9367[/C][C]0.0564[/C][C]0.9587[/C][/ROW]
[ROW][C]55[/C][C]54.3[/C][C]50.9557[/C][C]34.6548[/C][C]67.2565[/C][C]0.3438[/C][C]0[/C][C]0.2122[/C][C]0.0185[/C][/ROW]
[ROW][C]56[/C][C]60[/C][C]48.9204[/C][C]31.7291[/C][C]66.1117[/C][C]0.1033[/C][C]0.2698[/C][C]0.0915[/C][C]0.0136[/C][/ROW]
[ROW][C]57[/C][C]89.9[/C][C]89.2635[/C][C]71.2729[/C][C]107.254[/C][C]0.4724[/C][C]0.9993[/C][C]0.425[/C][C]0.9888[/C][/ROW]
[ROW][C]58[/C][C]77[/C][C]84.7872[/C][C]65.9361[/C][C]103.6384[/C][C]0.2091[/C][C]0.2975[/C][C]0.4787[/C][C]0.9568[/C][/ROW]
[ROW][C]59[/C][C]85.3[/C][C]80.713[/C][C]61.1856[/C][C]100.2404[/C][C]0.3226[/C][C]0.6453[/C][C]0.6303[/C][C]0.8936[/C][/ROW]
[ROW][C]60[/C][C]77.6[/C][C]75.5264[/C][C]55.2965[/C][C]95.7563[/C][C]0.4204[/C][C]0.1718[/C][C]0.4318[/C][C]0.7581[/C][/ROW]
[ROW][C]61[/C][C]69.2[/C][C]66.3311[/C][C]45.4683[/C][C]87.1938[/C][C]0.3938[/C][C]0.1449[/C][C]0.4266[/C][C]0.4266[/C][/ROW]
[/TABLE]
Source: https://freestatistics.org/blog/index.php?pk=34051&T=1

Globally Unique Identifier (entire table): ba.freestatistics.org/blog/index.php?pk=34051&T=1

As an alternative you can also use a QR Code:  

The GUIDs for individual cells are displayed in the table below:

Univariate ARIMA Extrapolation Forecast
timeY[t]F[t]95% LB95% UBp-value(H0: Y[t] = F[t])P(F[t]>Y[t-1])P(F[t]>Y[t-s])P(F[t]>Y[49])
3771.7-------
3877.5-------
3989.8-------
4080.3-------
4178.7-------
4293.8-------
4357.6-------
4460.6-------
4591-------
4685.3-------
4777.4-------
4877.3-------
4968.3-------
5069.974.387864.373284.40250.18990.88330.27120.8833
5181.784.774173.59595.95320.2950.99540.18910.9981
5275.178.077665.696590.45880.31870.28320.36250.9392
5369.975.206160.899389.51290.23360.50580.31610.828
548481.628166.582196.67420.37870.93670.05640.9587
5554.350.955734.654867.25650.343800.21220.0185
566048.920431.729166.11170.10330.26980.09150.0136
5789.989.263571.2729107.2540.47240.99930.4250.9888
587784.787265.9361103.63840.20910.29750.47870.9568
5985.380.71361.1856100.24040.32260.64530.63030.8936
6077.675.526455.296595.75630.42040.17180.43180.7581
6169.266.331145.468387.19380.39380.14490.42660.4266


Univariate ARIMA Extrapolation Forecast Performance
time% S.E.PEMAPESq.EMSERMSE
500.0687-0.06030.00520.14071.67841.2955
510.0673-0.03630.0039.45020.78750.8874
520.0809-0.03810.00328.86640.73890.8596
530.0971-0.07060.005928.15462.34621.5317
540.0940.02910.00245.62580.46880.6847
550.16320.06560.005511.18460.93210.9654
560.17930.22650.0189122.756910.22973.1984
570.10280.00716e-040.40520.03380.1838
580.1134-0.09180.007760.6415.05342.248
590.12340.05680.004721.04061.75341.3242
600.13670.02750.00234.29990.35830.5986
610.16050.04330.00368.23070.68590.8282

\begin{tabular}{lllllllll}
\hline
Univariate ARIMA Extrapolation Forecast Performance \tabularnewline
time & % S.E. & PE & MAPE & Sq.E & MSE & RMSE \tabularnewline
50 & 0.0687 & -0.0603 & 0.005 & 20.1407 & 1.6784 & 1.2955 \tabularnewline
51 & 0.0673 & -0.0363 & 0.003 & 9.4502 & 0.7875 & 0.8874 \tabularnewline
52 & 0.0809 & -0.0381 & 0.0032 & 8.8664 & 0.7389 & 0.8596 \tabularnewline
53 & 0.0971 & -0.0706 & 0.0059 & 28.1546 & 2.3462 & 1.5317 \tabularnewline
54 & 0.094 & 0.0291 & 0.0024 & 5.6258 & 0.4688 & 0.6847 \tabularnewline
55 & 0.1632 & 0.0656 & 0.0055 & 11.1846 & 0.9321 & 0.9654 \tabularnewline
56 & 0.1793 & 0.2265 & 0.0189 & 122.7569 & 10.2297 & 3.1984 \tabularnewline
57 & 0.1028 & 0.0071 & 6e-04 & 0.4052 & 0.0338 & 0.1838 \tabularnewline
58 & 0.1134 & -0.0918 & 0.0077 & 60.641 & 5.0534 & 2.248 \tabularnewline
59 & 0.1234 & 0.0568 & 0.0047 & 21.0406 & 1.7534 & 1.3242 \tabularnewline
60 & 0.1367 & 0.0275 & 0.0023 & 4.2999 & 0.3583 & 0.5986 \tabularnewline
61 & 0.1605 & 0.0433 & 0.0036 & 8.2307 & 0.6859 & 0.8282 \tabularnewline
\hline
\end{tabular}
%Source: https://freestatistics.org/blog/index.php?pk=34051&T=2

[TABLE]
[ROW][C]Univariate ARIMA Extrapolation Forecast Performance[/C][/ROW]
[ROW][C]time[/C][C]% S.E.[/C][C]PE[/C][C]MAPE[/C][C]Sq.E[/C][C]MSE[/C][C]RMSE[/C][/ROW]
[ROW][C]50[/C][C]0.0687[/C][C]-0.0603[/C][C]0.005[/C][C]20.1407[/C][C]1.6784[/C][C]1.2955[/C][/ROW]
[ROW][C]51[/C][C]0.0673[/C][C]-0.0363[/C][C]0.003[/C][C]9.4502[/C][C]0.7875[/C][C]0.8874[/C][/ROW]
[ROW][C]52[/C][C]0.0809[/C][C]-0.0381[/C][C]0.0032[/C][C]8.8664[/C][C]0.7389[/C][C]0.8596[/C][/ROW]
[ROW][C]53[/C][C]0.0971[/C][C]-0.0706[/C][C]0.0059[/C][C]28.1546[/C][C]2.3462[/C][C]1.5317[/C][/ROW]
[ROW][C]54[/C][C]0.094[/C][C]0.0291[/C][C]0.0024[/C][C]5.6258[/C][C]0.4688[/C][C]0.6847[/C][/ROW]
[ROW][C]55[/C][C]0.1632[/C][C]0.0656[/C][C]0.0055[/C][C]11.1846[/C][C]0.9321[/C][C]0.9654[/C][/ROW]
[ROW][C]56[/C][C]0.1793[/C][C]0.2265[/C][C]0.0189[/C][C]122.7569[/C][C]10.2297[/C][C]3.1984[/C][/ROW]
[ROW][C]57[/C][C]0.1028[/C][C]0.0071[/C][C]6e-04[/C][C]0.4052[/C][C]0.0338[/C][C]0.1838[/C][/ROW]
[ROW][C]58[/C][C]0.1134[/C][C]-0.0918[/C][C]0.0077[/C][C]60.641[/C][C]5.0534[/C][C]2.248[/C][/ROW]
[ROW][C]59[/C][C]0.1234[/C][C]0.0568[/C][C]0.0047[/C][C]21.0406[/C][C]1.7534[/C][C]1.3242[/C][/ROW]
[ROW][C]60[/C][C]0.1367[/C][C]0.0275[/C][C]0.0023[/C][C]4.2999[/C][C]0.3583[/C][C]0.5986[/C][/ROW]
[ROW][C]61[/C][C]0.1605[/C][C]0.0433[/C][C]0.0036[/C][C]8.2307[/C][C]0.6859[/C][C]0.8282[/C][/ROW]
[/TABLE]
Source: https://freestatistics.org/blog/index.php?pk=34051&T=2

Globally Unique Identifier (entire table): ba.freestatistics.org/blog/index.php?pk=34051&T=2

As an alternative you can also use a QR Code:  

The GUIDs for individual cells are displayed in the table below:

Univariate ARIMA Extrapolation Forecast Performance
time% S.E.PEMAPESq.EMSERMSE
500.0687-0.06030.00520.14071.67841.2955
510.0673-0.03630.0039.45020.78750.8874
520.0809-0.03810.00328.86640.73890.8596
530.0971-0.07060.005928.15462.34621.5317
540.0940.02910.00245.62580.46880.6847
550.16320.06560.005511.18460.93210.9654
560.17930.22650.0189122.756910.22973.1984
570.10280.00716e-040.40520.03380.1838
580.1134-0.09180.007760.6415.05342.248
590.12340.05680.004721.04061.75341.3242
600.13670.02750.00234.29990.35830.5986
610.16050.04330.00368.23070.68590.8282


Parameters (Session):
par1 = 12 ; par2 = 1 ; par3 = 0 ; par4 = 1 ; par5 = 12 ; par6 = 3 ; par7 = 1 ; par8 = 2 ; par9 = 0 ; par10 = FALSE ;
Parameters (R input):
par1 = 12 ; par2 = 1 ; par3 = 0 ; par4 = 1 ; par5 = 12 ; par6 = 3 ; par7 = 1 ; par8 = 2 ; par9 = 0 ; par10 = FALSE ; par11 = ; par12 = ; par13 = ; par14 = ; par15 = ; par16 = ; par17 = ; par18 = ; par19 = ; par20 = ;
R code (references can be found in the software module):
par1 <- as.numeric(par1) #cut off periods
par2 <- as.numeric(par2) #lambda
par3 <- as.numeric(par3) #degree of non-seasonal differencing
par4 <- as.numeric(par4) #degree of seasonal differencing
par5 <- as.numeric(par5) #seasonal period
par6 <- as.numeric(par6) #p
par7 <- as.numeric(par7) #q
par8 <- as.numeric(par8) #P
par9 <- as.numeric(par9) #Q
if (par10 == 'TRUE') par10 <- TRUE
if (par10 == 'FALSE') par10 <- FALSE
if (par2 == 0) x <- log(x)
if (par2 != 0) x <- x^par2
lx <- length(x)
first <- lx - 2*par1
nx <- lx - par1
nx1 <- nx + 1
fx <- lx - nx
if (fx < 1) {
fx <- par5
nx1 <- lx + fx - 1
first <- lx - 2*fx
}
first <- 1
if (fx < 3) fx <- round(lx/10,0)
(arima.out <- arima(x[1:nx], order=c(par6,par3,par7), seasonal=list(order=c(par8,par4,par9), period=par5), include.mean=par10, method='ML'))
(forecast <- predict(arima.out,fx))
(lb <- forecast$pred - 1.96 * forecast$se)
(ub <- forecast$pred + 1.96 * forecast$se)
if (par2 == 0) {
x <- exp(x)
forecast$pred <- exp(forecast$pred)
lb <- exp(lb)
ub <- exp(ub)
}
if (par2 != 0) {
x <- x^(1/par2)
forecast$pred <- forecast$pred^(1/par2)
lb <- lb^(1/par2)
ub <- ub^(1/par2)
}
if (par2 < 0) {
olb <- lb
lb <- ub
ub <- olb
}
(actandfor <- c(x[1:nx], forecast$pred))
(perc.se <- (ub-forecast$pred)/1.96/forecast$pred)
bitmap(file='test1.png')
opar <- par(mar=c(4,4,2,2),las=1)
ylim <- c( min(x[first:nx],lb), max(x[first:nx],ub))
plot(x,ylim=ylim,type='n',xlim=c(first,lx))
usr <- par('usr')
rect(usr[1],usr[3],nx+1,usr[4],border=NA,col='lemonchiffon')
rect(nx1,usr[3],usr[2],usr[4],border=NA,col='lavender')
abline(h= (-3:3)*2 , col ='gray', lty =3)
polygon( c(nx1:lx,lx:nx1), c(lb,rev(ub)), col = 'orange', lty=2,border=NA)
lines(nx1:lx, lb , lty=2)
lines(nx1:lx, ub , lty=2)
lines(x, lwd=2)
lines(nx1:lx, forecast$pred , lwd=2 , col ='white')
box()
par(opar)
dev.off()
prob.dec <- array(NA, dim=fx)
prob.sdec <- array(NA, dim=fx)
prob.ldec <- array(NA, dim=fx)
prob.pval <- array(NA, dim=fx)
perf.pe <- array(0, dim=fx)
perf.mape <- array(0, dim=fx)
perf.se <- array(0, dim=fx)
perf.mse <- array(0, dim=fx)
perf.rmse <- array(0, dim=fx)
for (i in 1:fx) {
locSD <- (ub[i] - forecast$pred[i]) / 1.96
perf.pe[i] = (x[nx+i] - forecast$pred[i]) / forecast$pred[i]
perf.mape[i] = perf.mape[i] + abs(perf.pe[i])
perf.se[i] = (x[nx+i] - forecast$pred[i])^2
perf.mse[i] = perf.mse[i] + perf.se[i]
prob.dec[i] = pnorm((x[nx+i-1] - forecast$pred[i]) / locSD)
prob.sdec[i] = pnorm((x[nx+i-par5] - forecast$pred[i]) / locSD)
prob.ldec[i] = pnorm((x[nx] - forecast$pred[i]) / locSD)
prob.pval[i] = pnorm(abs(x[nx+i] - forecast$pred[i]) / locSD)
}
perf.mape = perf.mape / fx
perf.mse = perf.mse / fx
perf.rmse = sqrt(perf.mse)
bitmap(file='test2.png')
plot(forecast$pred, pch=19, type='b',main='ARIMA Extrapolation Forecast', ylab='Forecast and 95% CI', xlab='time',ylim=c(min(lb),max(ub)))
dum <- forecast$pred
dum[1:12] <- x[(nx+1):lx]
lines(dum, lty=1)
lines(ub,lty=3)
lines(lb,lty=3)
dev.off()
load(file='createtable')
a<-table.start()
a<-table.row.start(a)
a<-table.element(a,'Univariate ARIMA Extrapolation Forecast',9,TRUE)
a<-table.row.end(a)
a<-table.row.start(a)
a<-table.element(a,'time',1,header=TRUE)
a<-table.element(a,'Y[t]',1,header=TRUE)
a<-table.element(a,'F[t]',1,header=TRUE)
a<-table.element(a,'95% LB',1,header=TRUE)
a<-table.element(a,'95% UB',1,header=TRUE)
a<-table.element(a,'p-value
(H0: Y[t] = F[t])',1,header=TRUE)
a<-table.element(a,'P(F[t]>Y[t-1])',1,header=TRUE)
a<-table.element(a,'P(F[t]>Y[t-s])',1,header=TRUE)
mylab <- paste('P(F[t]>Y[',nx,sep='')
mylab <- paste(mylab,'])',sep='')
a<-table.element(a,mylab,1,header=TRUE)
a<-table.row.end(a)
for (i in (nx-par5):nx) {
a<-table.row.start(a)
a<-table.element(a,i,header=TRUE)
a<-table.element(a,x[i])
a<-table.element(a,'-')
a<-table.row.end(a)
}
for (i in 1:fx) {
a<-table.row.start(a)
a<-table.element(a,nx+i,header=TRUE)
a<-table.element(a,round(x[nx+i],4))
a<-table.element(a,round(forecast$pred[i],4))
a<-table.element(a,round(lb[i],4))
a<-table.element(a,round(ub[i],4))
a<-table.element(a,round((1-prob.pval[i]),4))
a<-table.element(a,round((1-prob.dec[i]),4))
a<-table.element(a,round((1-prob.sdec[i]),4))
a<-table.element(a,round((1-prob.ldec[i]),4))
a<-table.row.end(a)
}
a<-table.end(a)
table.save(a,file='mytable.tab')
a<-table.start()
a<-table.row.start(a)
a<-table.element(a,'Univariate ARIMA Extrapolation Forecast Performance',7,TRUE)
a<-table.row.end(a)
a<-table.row.start(a)
a<-table.element(a,'time',1,header=TRUE)
a<-table.element(a,'% S.E.',1,header=TRUE)
a<-table.element(a,'PE',1,header=TRUE)
a<-table.element(a,'MAPE',1,header=TRUE)
a<-table.element(a,'Sq.E',1,header=TRUE)
a<-table.element(a,'MSE',1,header=TRUE)
a<-table.element(a,'RMSE',1,header=TRUE)
a<-table.row.end(a)
for (i in 1:fx) {
a<-table.row.start(a)
a<-table.element(a,nx+i,header=TRUE)
a<-table.element(a,round(perc.se[i],4))
a<-table.element(a,round(perf.pe[i],4))
a<-table.element(a,round(perf.mape[i],4))
a<-table.element(a,round(perf.se[i],4))
a<-table.element(a,round(perf.mse[i],4))
a<-table.element(a,round(perf.rmse[i],4))
a<-table.row.end(a)
}
a<-table.end(a)
table.save(a,file='mytable1.tab')