Free Statistics

of Irreproducible Research!

Author's title

Author*The author of this computation has been verified*
R Software Modulerwasp_autocorrelation.wasp
Title produced by software(Partial) Autocorrelation Function
Date of computationTue, 09 Dec 2008 06:54:35 -0700
Cite this page as followsStatistical Computations at FreeStatistics.org, Office for Research Development and Education, URL https://freestatistics.org/blog/index.php?v=date/2008/Dec/09/t1228830964m7oxmkxe99uxibd.htm/, Retrieved Fri, 17 May 2024 03:41:38 +0000
Statistical Computations at FreeStatistics.org, Office for Research Development and Education, URL https://freestatistics.org/blog/index.php?pk=31397, Retrieved Fri, 17 May 2024 03:41:38 +0000
QR Codes:

Original text written by user:
IsPrivate?No (this computation is public)
User-defined keywords
Estimated Impact195
Family? (F = Feedback message, R = changed R code, M = changed R Module, P = changed Parameters, D = changed Data)
F     [Univariate Data Series] [Airline data] [2007-10-18 09:58:47] [42daae401fd3def69a25014f2252b4c2]
F RMPD  [Spectral Analysis] [airline data] [2008-12-02 12:35:12] [0e5eff269cdcaf8789c45b6ee36b0c3d]
F RMPD    [Cross Correlation Function] [airline data] [2008-12-02 13:18:05] [0e5eff269cdcaf8789c45b6ee36b0c3d]
- RMPD      [(Partial) Autocorrelation Function] [paper] [2008-12-02 14:55:43] [0e5eff269cdcaf8789c45b6ee36b0c3d]
-   P           [(Partial) Autocorrelation Function] [acf] [2008-12-09 13:54:35] [09074fbe368d26382bb94e5bb318a104] [Current]
Feedback Forum

Post a new message
Dataseries X:
1202454.6
1201423.4
1505916
1513377.6
1977605.3
1873829.6
1424049.1
1322740
1584825.5
1680460.3
1648573.7
3095468.7
1307982.9
1367588.9
1572718.3
1611602.9
1641196.4
1845262.4
1464237.6
1402385.7
2077099.8
1691129.6
1729012.7
3347792.1
1365087.7
1545460
1844355.1
1775549.8
1721779.2
2128726.1
1664319.9
1769471.4
1904578.4
1872042.3
1802181
3222199.4
1491414.2
1658519.2
2079206.9
1748767.4
2084447.4
2067181.6
1718122.8
1782337.1
1958118.4
2028681.3
2076128.1
3383873
1870369
1654852.9
2074338.3
1888653.7
1991137.8
2168237.9
1867424.1
1842359.6
1927476.3
2065555.4
2455608.5
3336170.9


Summary of computational transaction
Raw Inputview raw input (R code)
Raw Outputview raw output of R engine
Computing time1 seconds
R Server'Gwilym Jenkins' @ 72.249.127.135

\begin{tabular}{lllllllll}
\hline
Summary of computational transaction \tabularnewline
Raw Input & view raw input (R code)  \tabularnewline
Raw Output & view raw output of R engine  \tabularnewline
Computing time & 1 seconds \tabularnewline
R Server & 'Gwilym Jenkins' @ 72.249.127.135 \tabularnewline
\hline
\end{tabular}
%Source: https://freestatistics.org/blog/index.php?pk=31397&T=0

[TABLE]
[ROW][C]Summary of computational transaction[/C][/ROW]
[ROW][C]Raw Input[/C][C]view raw input (R code) [/C][/ROW]
[ROW][C]Raw Output[/C][C]view raw output of R engine [/C][/ROW]
[ROW][C]Computing time[/C][C]1 seconds[/C][/ROW]
[ROW][C]R Server[/C][C]'Gwilym Jenkins' @ 72.249.127.135[/C][/ROW]
[/TABLE]
Source: https://freestatistics.org/blog/index.php?pk=31397&T=0

Globally Unique Identifier (entire table): ba.freestatistics.org/blog/index.php?pk=31397&T=0

As an alternative you can also use a QR Code:  

The GUIDs for individual cells are displayed in the table below:

Summary of computational transaction
Raw Inputview raw input (R code)
Raw Outputview raw output of R engine
Computing time1 seconds
R Server'Gwilym Jenkins' @ 72.249.127.135


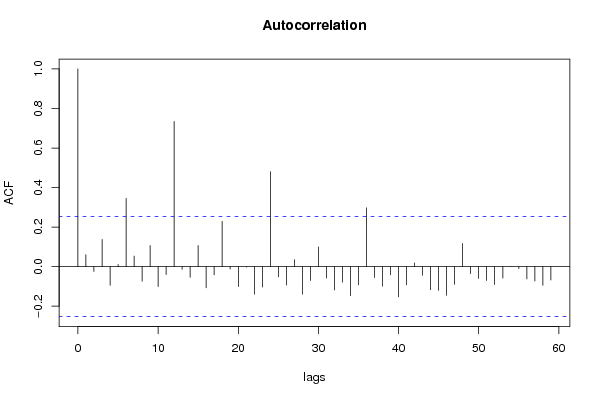
Autocorrelation Function
Time lag kACF(k)T-STATP-value
10.0603710.46760.320871
2-0.024017-0.1860.426522
30.137431.06450.145677
4-0.094407-0.73130.233729
50.0107450.08320.466973
60.3448742.67140.004855
70.0532470.41240.340741
8-0.073785-0.57150.284885
90.106920.82820.20542
10-0.100912-0.78170.218744
11-0.03993-0.30930.379085
120.7345745.690
13-0.013726-0.10630.45784
14-0.054133-0.41930.338244
150.1067090.82660.205879
16-0.10702-0.8290.205202
17-0.041238-0.31940.375255
180.2286321.7710.040822
19-0.012495-0.09680.461611
20-0.100697-0.780.219229
21-0.001903-0.01470.494145
22-0.139639-1.08160.141871
23-0.103188-0.79930.213636
240.4800463.71840.000222
25-0.051381-0.3980.346024
26-0.093108-0.72120.236791
270.0352730.27320.392809
28-0.139341-1.07930.142381
29-0.070504-0.54610.293504
300.0995970.77150.221727
31-0.057995-0.44920.327444
32-0.117613-0.9110.182963
33-0.078615-0.60890.27243
34-0.147198-1.14020.129369
35-0.091816-0.71120.239857
360.2976452.30550.012305
37-0.055076-0.42660.335591
38-0.099263-0.76890.222489
39-0.041523-0.32160.374424
40-0.152796-1.18360.120629
41-0.092276-0.71480.238762
420.0186820.14470.442713
43-0.044076-0.34140.366994
44-0.116416-0.90180.185396
45-0.120014-0.92960.178145
46-0.14494-1.12270.133018
47-0.089295-0.69170.245904
480.1170770.90690.184051
49-0.034927-0.27050.393835
50-0.059734-0.46270.322626
51-0.070197-0.54370.294315
52-0.090783-0.70320.242326
53-0.057653-0.44660.328394
54-0.000339-0.00260.498957
55-0.00999-0.07740.469288
56-0.062328-0.48280.315501
57-0.072934-0.56490.28711
58-0.094735-0.73380.232959
59-0.067864-0.52570.300525
60NANANA

\begin{tabular}{lllllllll}
\hline
Autocorrelation Function \tabularnewline
Time lag k & ACF(k) & T-STAT & P-value \tabularnewline
1 & 0.060371 & 0.4676 & 0.320871 \tabularnewline
2 & -0.024017 & -0.186 & 0.426522 \tabularnewline
3 & 0.13743 & 1.0645 & 0.145677 \tabularnewline
4 & -0.094407 & -0.7313 & 0.233729 \tabularnewline
5 & 0.010745 & 0.0832 & 0.466973 \tabularnewline
6 & 0.344874 & 2.6714 & 0.004855 \tabularnewline
7 & 0.053247 & 0.4124 & 0.340741 \tabularnewline
8 & -0.073785 & -0.5715 & 0.284885 \tabularnewline
9 & 0.10692 & 0.8282 & 0.20542 \tabularnewline
10 & -0.100912 & -0.7817 & 0.218744 \tabularnewline
11 & -0.03993 & -0.3093 & 0.379085 \tabularnewline
12 & 0.734574 & 5.69 & 0 \tabularnewline
13 & -0.013726 & -0.1063 & 0.45784 \tabularnewline
14 & -0.054133 & -0.4193 & 0.338244 \tabularnewline
15 & 0.106709 & 0.8266 & 0.205879 \tabularnewline
16 & -0.10702 & -0.829 & 0.205202 \tabularnewline
17 & -0.041238 & -0.3194 & 0.375255 \tabularnewline
18 & 0.228632 & 1.771 & 0.040822 \tabularnewline
19 & -0.012495 & -0.0968 & 0.461611 \tabularnewline
20 & -0.100697 & -0.78 & 0.219229 \tabularnewline
21 & -0.001903 & -0.0147 & 0.494145 \tabularnewline
22 & -0.139639 & -1.0816 & 0.141871 \tabularnewline
23 & -0.103188 & -0.7993 & 0.213636 \tabularnewline
24 & 0.480046 & 3.7184 & 0.000222 \tabularnewline
25 & -0.051381 & -0.398 & 0.346024 \tabularnewline
26 & -0.093108 & -0.7212 & 0.236791 \tabularnewline
27 & 0.035273 & 0.2732 & 0.392809 \tabularnewline
28 & -0.139341 & -1.0793 & 0.142381 \tabularnewline
29 & -0.070504 & -0.5461 & 0.293504 \tabularnewline
30 & 0.099597 & 0.7715 & 0.221727 \tabularnewline
31 & -0.057995 & -0.4492 & 0.327444 \tabularnewline
32 & -0.117613 & -0.911 & 0.182963 \tabularnewline
33 & -0.078615 & -0.6089 & 0.27243 \tabularnewline
34 & -0.147198 & -1.1402 & 0.129369 \tabularnewline
35 & -0.091816 & -0.7112 & 0.239857 \tabularnewline
36 & 0.297645 & 2.3055 & 0.012305 \tabularnewline
37 & -0.055076 & -0.4266 & 0.335591 \tabularnewline
38 & -0.099263 & -0.7689 & 0.222489 \tabularnewline
39 & -0.041523 & -0.3216 & 0.374424 \tabularnewline
40 & -0.152796 & -1.1836 & 0.120629 \tabularnewline
41 & -0.092276 & -0.7148 & 0.238762 \tabularnewline
42 & 0.018682 & 0.1447 & 0.442713 \tabularnewline
43 & -0.044076 & -0.3414 & 0.366994 \tabularnewline
44 & -0.116416 & -0.9018 & 0.185396 \tabularnewline
45 & -0.120014 & -0.9296 & 0.178145 \tabularnewline
46 & -0.14494 & -1.1227 & 0.133018 \tabularnewline
47 & -0.089295 & -0.6917 & 0.245904 \tabularnewline
48 & 0.117077 & 0.9069 & 0.184051 \tabularnewline
49 & -0.034927 & -0.2705 & 0.393835 \tabularnewline
50 & -0.059734 & -0.4627 & 0.322626 \tabularnewline
51 & -0.070197 & -0.5437 & 0.294315 \tabularnewline
52 & -0.090783 & -0.7032 & 0.242326 \tabularnewline
53 & -0.057653 & -0.4466 & 0.328394 \tabularnewline
54 & -0.000339 & -0.0026 & 0.498957 \tabularnewline
55 & -0.00999 & -0.0774 & 0.469288 \tabularnewline
56 & -0.062328 & -0.4828 & 0.315501 \tabularnewline
57 & -0.072934 & -0.5649 & 0.28711 \tabularnewline
58 & -0.094735 & -0.7338 & 0.232959 \tabularnewline
59 & -0.067864 & -0.5257 & 0.300525 \tabularnewline
60 & NA & NA & NA \tabularnewline
\hline
\end{tabular}
%Source: https://freestatistics.org/blog/index.php?pk=31397&T=1

[TABLE]
[ROW][C]Autocorrelation Function[/C][/ROW]
[ROW][C]Time lag k[/C][C]ACF(k)[/C][C]T-STAT[/C][C]P-value[/C][/ROW]
[ROW][C]1[/C][C]0.060371[/C][C]0.4676[/C][C]0.320871[/C][/ROW]
[ROW][C]2[/C][C]-0.024017[/C][C]-0.186[/C][C]0.426522[/C][/ROW]
[ROW][C]3[/C][C]0.13743[/C][C]1.0645[/C][C]0.145677[/C][/ROW]
[ROW][C]4[/C][C]-0.094407[/C][C]-0.7313[/C][C]0.233729[/C][/ROW]
[ROW][C]5[/C][C]0.010745[/C][C]0.0832[/C][C]0.466973[/C][/ROW]
[ROW][C]6[/C][C]0.344874[/C][C]2.6714[/C][C]0.004855[/C][/ROW]
[ROW][C]7[/C][C]0.053247[/C][C]0.4124[/C][C]0.340741[/C][/ROW]
[ROW][C]8[/C][C]-0.073785[/C][C]-0.5715[/C][C]0.284885[/C][/ROW]
[ROW][C]9[/C][C]0.10692[/C][C]0.8282[/C][C]0.20542[/C][/ROW]
[ROW][C]10[/C][C]-0.100912[/C][C]-0.7817[/C][C]0.218744[/C][/ROW]
[ROW][C]11[/C][C]-0.03993[/C][C]-0.3093[/C][C]0.379085[/C][/ROW]
[ROW][C]12[/C][C]0.734574[/C][C]5.69[/C][C]0[/C][/ROW]
[ROW][C]13[/C][C]-0.013726[/C][C]-0.1063[/C][C]0.45784[/C][/ROW]
[ROW][C]14[/C][C]-0.054133[/C][C]-0.4193[/C][C]0.338244[/C][/ROW]
[ROW][C]15[/C][C]0.106709[/C][C]0.8266[/C][C]0.205879[/C][/ROW]
[ROW][C]16[/C][C]-0.10702[/C][C]-0.829[/C][C]0.205202[/C][/ROW]
[ROW][C]17[/C][C]-0.041238[/C][C]-0.3194[/C][C]0.375255[/C][/ROW]
[ROW][C]18[/C][C]0.228632[/C][C]1.771[/C][C]0.040822[/C][/ROW]
[ROW][C]19[/C][C]-0.012495[/C][C]-0.0968[/C][C]0.461611[/C][/ROW]
[ROW][C]20[/C][C]-0.100697[/C][C]-0.78[/C][C]0.219229[/C][/ROW]
[ROW][C]21[/C][C]-0.001903[/C][C]-0.0147[/C][C]0.494145[/C][/ROW]
[ROW][C]22[/C][C]-0.139639[/C][C]-1.0816[/C][C]0.141871[/C][/ROW]
[ROW][C]23[/C][C]-0.103188[/C][C]-0.7993[/C][C]0.213636[/C][/ROW]
[ROW][C]24[/C][C]0.480046[/C][C]3.7184[/C][C]0.000222[/C][/ROW]
[ROW][C]25[/C][C]-0.051381[/C][C]-0.398[/C][C]0.346024[/C][/ROW]
[ROW][C]26[/C][C]-0.093108[/C][C]-0.7212[/C][C]0.236791[/C][/ROW]
[ROW][C]27[/C][C]0.035273[/C][C]0.2732[/C][C]0.392809[/C][/ROW]
[ROW][C]28[/C][C]-0.139341[/C][C]-1.0793[/C][C]0.142381[/C][/ROW]
[ROW][C]29[/C][C]-0.070504[/C][C]-0.5461[/C][C]0.293504[/C][/ROW]
[ROW][C]30[/C][C]0.099597[/C][C]0.7715[/C][C]0.221727[/C][/ROW]
[ROW][C]31[/C][C]-0.057995[/C][C]-0.4492[/C][C]0.327444[/C][/ROW]
[ROW][C]32[/C][C]-0.117613[/C][C]-0.911[/C][C]0.182963[/C][/ROW]
[ROW][C]33[/C][C]-0.078615[/C][C]-0.6089[/C][C]0.27243[/C][/ROW]
[ROW][C]34[/C][C]-0.147198[/C][C]-1.1402[/C][C]0.129369[/C][/ROW]
[ROW][C]35[/C][C]-0.091816[/C][C]-0.7112[/C][C]0.239857[/C][/ROW]
[ROW][C]36[/C][C]0.297645[/C][C]2.3055[/C][C]0.012305[/C][/ROW]
[ROW][C]37[/C][C]-0.055076[/C][C]-0.4266[/C][C]0.335591[/C][/ROW]
[ROW][C]38[/C][C]-0.099263[/C][C]-0.7689[/C][C]0.222489[/C][/ROW]
[ROW][C]39[/C][C]-0.041523[/C][C]-0.3216[/C][C]0.374424[/C][/ROW]
[ROW][C]40[/C][C]-0.152796[/C][C]-1.1836[/C][C]0.120629[/C][/ROW]
[ROW][C]41[/C][C]-0.092276[/C][C]-0.7148[/C][C]0.238762[/C][/ROW]
[ROW][C]42[/C][C]0.018682[/C][C]0.1447[/C][C]0.442713[/C][/ROW]
[ROW][C]43[/C][C]-0.044076[/C][C]-0.3414[/C][C]0.366994[/C][/ROW]
[ROW][C]44[/C][C]-0.116416[/C][C]-0.9018[/C][C]0.185396[/C][/ROW]
[ROW][C]45[/C][C]-0.120014[/C][C]-0.9296[/C][C]0.178145[/C][/ROW]
[ROW][C]46[/C][C]-0.14494[/C][C]-1.1227[/C][C]0.133018[/C][/ROW]
[ROW][C]47[/C][C]-0.089295[/C][C]-0.6917[/C][C]0.245904[/C][/ROW]
[ROW][C]48[/C][C]0.117077[/C][C]0.9069[/C][C]0.184051[/C][/ROW]
[ROW][C]49[/C][C]-0.034927[/C][C]-0.2705[/C][C]0.393835[/C][/ROW]
[ROW][C]50[/C][C]-0.059734[/C][C]-0.4627[/C][C]0.322626[/C][/ROW]
[ROW][C]51[/C][C]-0.070197[/C][C]-0.5437[/C][C]0.294315[/C][/ROW]
[ROW][C]52[/C][C]-0.090783[/C][C]-0.7032[/C][C]0.242326[/C][/ROW]
[ROW][C]53[/C][C]-0.057653[/C][C]-0.4466[/C][C]0.328394[/C][/ROW]
[ROW][C]54[/C][C]-0.000339[/C][C]-0.0026[/C][C]0.498957[/C][/ROW]
[ROW][C]55[/C][C]-0.00999[/C][C]-0.0774[/C][C]0.469288[/C][/ROW]
[ROW][C]56[/C][C]-0.062328[/C][C]-0.4828[/C][C]0.315501[/C][/ROW]
[ROW][C]57[/C][C]-0.072934[/C][C]-0.5649[/C][C]0.28711[/C][/ROW]
[ROW][C]58[/C][C]-0.094735[/C][C]-0.7338[/C][C]0.232959[/C][/ROW]
[ROW][C]59[/C][C]-0.067864[/C][C]-0.5257[/C][C]0.300525[/C][/ROW]
[ROW][C]60[/C][C]NA[/C][C]NA[/C][C]NA[/C][/ROW]
[/TABLE]
Source: https://freestatistics.org/blog/index.php?pk=31397&T=1

Globally Unique Identifier (entire table): ba.freestatistics.org/blog/index.php?pk=31397&T=1

As an alternative you can also use a QR Code:  

The GUIDs for individual cells are displayed in the table below:

Autocorrelation Function
Time lag kACF(k)T-STATP-value
10.0603710.46760.320871
2-0.024017-0.1860.426522
30.137431.06450.145677
4-0.094407-0.73130.233729
50.0107450.08320.466973
60.3448742.67140.004855
70.0532470.41240.340741
8-0.073785-0.57150.284885
90.106920.82820.20542
10-0.100912-0.78170.218744
11-0.03993-0.30930.379085
120.7345745.690
13-0.013726-0.10630.45784
14-0.054133-0.41930.338244
150.1067090.82660.205879
16-0.10702-0.8290.205202
17-0.041238-0.31940.375255
180.2286321.7710.040822
19-0.012495-0.09680.461611
20-0.100697-0.780.219229
21-0.001903-0.01470.494145
22-0.139639-1.08160.141871
23-0.103188-0.79930.213636
240.4800463.71840.000222
25-0.051381-0.3980.346024
26-0.093108-0.72120.236791
270.0352730.27320.392809
28-0.139341-1.07930.142381
29-0.070504-0.54610.293504
300.0995970.77150.221727
31-0.057995-0.44920.327444
32-0.117613-0.9110.182963
33-0.078615-0.60890.27243
34-0.147198-1.14020.129369
35-0.091816-0.71120.239857
360.2976452.30550.012305
37-0.055076-0.42660.335591
38-0.099263-0.76890.222489
39-0.041523-0.32160.374424
40-0.152796-1.18360.120629
41-0.092276-0.71480.238762
420.0186820.14470.442713
43-0.044076-0.34140.366994
44-0.116416-0.90180.185396
45-0.120014-0.92960.178145
46-0.14494-1.12270.133018
47-0.089295-0.69170.245904
480.1170770.90690.184051
49-0.034927-0.27050.393835
50-0.059734-0.46270.322626
51-0.070197-0.54370.294315
52-0.090783-0.70320.242326
53-0.057653-0.44660.328394
54-0.000339-0.00260.498957
55-0.00999-0.07740.469288
56-0.062328-0.48280.315501
57-0.072934-0.56490.28711
58-0.094735-0.73380.232959
59-0.067864-0.52570.300525
60NANANA


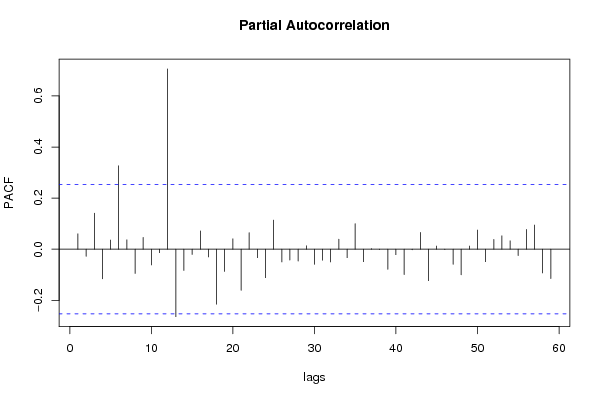
Partial Autocorrelation Function
Time lag kPACF(k)T-STATP-value
10.0603710.46760.320871
2-0.027763-0.21510.415228
30.141221.09390.139189
4-0.115683-0.89610.186896
50.0360190.2790.390602
60.3265042.52910.007041
70.0370580.2870.387533
8-0.094794-0.73430.232823
90.0463490.3590.360421
10-0.061366-0.47530.318134
11-0.013287-0.10290.459184
120.705385.46380
13-0.263743-2.04290.022729
14-0.082908-0.64220.261594
15-0.020588-0.15950.436917
160.0715130.55390.290839
17-0.029947-0.2320.408675
18-0.215123-1.66630.05043
19-0.086685-0.67150.252252
200.040990.31750.375982
21-0.160917-1.24650.10872
220.0648040.5020.308763
23-0.03324-0.25750.398847
24-0.11128-0.8620.196068
250.1139420.88260.190491
26-0.049602-0.38420.35109
27-0.042407-0.32850.371844
28-0.046136-0.35740.361036
290.0135490.10490.458384
30-0.058866-0.4560.325027
31-0.042594-0.32990.371299
32-0.049702-0.3850.350803
330.0391130.3030.38148
34-0.033072-0.25620.399347
350.0999280.7740.220973
36-0.048939-0.37910.352982
370.0023150.01790.492877
38-0.001412-0.01090.495655
39-0.07863-0.60910.272391
40-0.021461-0.16620.434266
41-0.099164-0.76810.222713
42-0.002457-0.0190.492439
430.0655580.50780.306724
44-0.1228-0.95120.172658
450.0123180.09540.462152
46-0.0011-0.00850.496615
47-0.05912-0.45790.324325
48-0.09986-0.77350.221127
490.0124090.09610.461873
500.0752510.58290.281076
51-0.048836-0.37830.353277
520.0385440.29860.383154
530.0524090.4060.34311
540.0329420.25520.399733
55-0.024609-0.19060.424734
560.0775550.60070.275139
570.0944670.73170.233588
58-0.092881-0.71950.237327
59-0.114869-0.88980.188572
60NANANA

\begin{tabular}{lllllllll}
\hline
Partial Autocorrelation Function \tabularnewline
Time lag k & PACF(k) & T-STAT & P-value \tabularnewline
1 & 0.060371 & 0.4676 & 0.320871 \tabularnewline
2 & -0.027763 & -0.2151 & 0.415228 \tabularnewline
3 & 0.14122 & 1.0939 & 0.139189 \tabularnewline
4 & -0.115683 & -0.8961 & 0.186896 \tabularnewline
5 & 0.036019 & 0.279 & 0.390602 \tabularnewline
6 & 0.326504 & 2.5291 & 0.007041 \tabularnewline
7 & 0.037058 & 0.287 & 0.387533 \tabularnewline
8 & -0.094794 & -0.7343 & 0.232823 \tabularnewline
9 & 0.046349 & 0.359 & 0.360421 \tabularnewline
10 & -0.061366 & -0.4753 & 0.318134 \tabularnewline
11 & -0.013287 & -0.1029 & 0.459184 \tabularnewline
12 & 0.70538 & 5.4638 & 0 \tabularnewline
13 & -0.263743 & -2.0429 & 0.022729 \tabularnewline
14 & -0.082908 & -0.6422 & 0.261594 \tabularnewline
15 & -0.020588 & -0.1595 & 0.436917 \tabularnewline
16 & 0.071513 & 0.5539 & 0.290839 \tabularnewline
17 & -0.029947 & -0.232 & 0.408675 \tabularnewline
18 & -0.215123 & -1.6663 & 0.05043 \tabularnewline
19 & -0.086685 & -0.6715 & 0.252252 \tabularnewline
20 & 0.04099 & 0.3175 & 0.375982 \tabularnewline
21 & -0.160917 & -1.2465 & 0.10872 \tabularnewline
22 & 0.064804 & 0.502 & 0.308763 \tabularnewline
23 & -0.03324 & -0.2575 & 0.398847 \tabularnewline
24 & -0.11128 & -0.862 & 0.196068 \tabularnewline
25 & 0.113942 & 0.8826 & 0.190491 \tabularnewline
26 & -0.049602 & -0.3842 & 0.35109 \tabularnewline
27 & -0.042407 & -0.3285 & 0.371844 \tabularnewline
28 & -0.046136 & -0.3574 & 0.361036 \tabularnewline
29 & 0.013549 & 0.1049 & 0.458384 \tabularnewline
30 & -0.058866 & -0.456 & 0.325027 \tabularnewline
31 & -0.042594 & -0.3299 & 0.371299 \tabularnewline
32 & -0.049702 & -0.385 & 0.350803 \tabularnewline
33 & 0.039113 & 0.303 & 0.38148 \tabularnewline
34 & -0.033072 & -0.2562 & 0.399347 \tabularnewline
35 & 0.099928 & 0.774 & 0.220973 \tabularnewline
36 & -0.048939 & -0.3791 & 0.352982 \tabularnewline
37 & 0.002315 & 0.0179 & 0.492877 \tabularnewline
38 & -0.001412 & -0.0109 & 0.495655 \tabularnewline
39 & -0.07863 & -0.6091 & 0.272391 \tabularnewline
40 & -0.021461 & -0.1662 & 0.434266 \tabularnewline
41 & -0.099164 & -0.7681 & 0.222713 \tabularnewline
42 & -0.002457 & -0.019 & 0.492439 \tabularnewline
43 & 0.065558 & 0.5078 & 0.306724 \tabularnewline
44 & -0.1228 & -0.9512 & 0.172658 \tabularnewline
45 & 0.012318 & 0.0954 & 0.462152 \tabularnewline
46 & -0.0011 & -0.0085 & 0.496615 \tabularnewline
47 & -0.05912 & -0.4579 & 0.324325 \tabularnewline
48 & -0.09986 & -0.7735 & 0.221127 \tabularnewline
49 & 0.012409 & 0.0961 & 0.461873 \tabularnewline
50 & 0.075251 & 0.5829 & 0.281076 \tabularnewline
51 & -0.048836 & -0.3783 & 0.353277 \tabularnewline
52 & 0.038544 & 0.2986 & 0.383154 \tabularnewline
53 & 0.052409 & 0.406 & 0.34311 \tabularnewline
54 & 0.032942 & 0.2552 & 0.399733 \tabularnewline
55 & -0.024609 & -0.1906 & 0.424734 \tabularnewline
56 & 0.077555 & 0.6007 & 0.275139 \tabularnewline
57 & 0.094467 & 0.7317 & 0.233588 \tabularnewline
58 & -0.092881 & -0.7195 & 0.237327 \tabularnewline
59 & -0.114869 & -0.8898 & 0.188572 \tabularnewline
60 & NA & NA & NA \tabularnewline
\hline
\end{tabular}
%Source: https://freestatistics.org/blog/index.php?pk=31397&T=2

[TABLE]
[ROW][C]Partial Autocorrelation Function[/C][/ROW]
[ROW][C]Time lag k[/C][C]PACF(k)[/C][C]T-STAT[/C][C]P-value[/C][/ROW]
[ROW][C]1[/C][C]0.060371[/C][C]0.4676[/C][C]0.320871[/C][/ROW]
[ROW][C]2[/C][C]-0.027763[/C][C]-0.2151[/C][C]0.415228[/C][/ROW]
[ROW][C]3[/C][C]0.14122[/C][C]1.0939[/C][C]0.139189[/C][/ROW]
[ROW][C]4[/C][C]-0.115683[/C][C]-0.8961[/C][C]0.186896[/C][/ROW]
[ROW][C]5[/C][C]0.036019[/C][C]0.279[/C][C]0.390602[/C][/ROW]
[ROW][C]6[/C][C]0.326504[/C][C]2.5291[/C][C]0.007041[/C][/ROW]
[ROW][C]7[/C][C]0.037058[/C][C]0.287[/C][C]0.387533[/C][/ROW]
[ROW][C]8[/C][C]-0.094794[/C][C]-0.7343[/C][C]0.232823[/C][/ROW]
[ROW][C]9[/C][C]0.046349[/C][C]0.359[/C][C]0.360421[/C][/ROW]
[ROW][C]10[/C][C]-0.061366[/C][C]-0.4753[/C][C]0.318134[/C][/ROW]
[ROW][C]11[/C][C]-0.013287[/C][C]-0.1029[/C][C]0.459184[/C][/ROW]
[ROW][C]12[/C][C]0.70538[/C][C]5.4638[/C][C]0[/C][/ROW]
[ROW][C]13[/C][C]-0.263743[/C][C]-2.0429[/C][C]0.022729[/C][/ROW]
[ROW][C]14[/C][C]-0.082908[/C][C]-0.6422[/C][C]0.261594[/C][/ROW]
[ROW][C]15[/C][C]-0.020588[/C][C]-0.1595[/C][C]0.436917[/C][/ROW]
[ROW][C]16[/C][C]0.071513[/C][C]0.5539[/C][C]0.290839[/C][/ROW]
[ROW][C]17[/C][C]-0.029947[/C][C]-0.232[/C][C]0.408675[/C][/ROW]
[ROW][C]18[/C][C]-0.215123[/C][C]-1.6663[/C][C]0.05043[/C][/ROW]
[ROW][C]19[/C][C]-0.086685[/C][C]-0.6715[/C][C]0.252252[/C][/ROW]
[ROW][C]20[/C][C]0.04099[/C][C]0.3175[/C][C]0.375982[/C][/ROW]
[ROW][C]21[/C][C]-0.160917[/C][C]-1.2465[/C][C]0.10872[/C][/ROW]
[ROW][C]22[/C][C]0.064804[/C][C]0.502[/C][C]0.308763[/C][/ROW]
[ROW][C]23[/C][C]-0.03324[/C][C]-0.2575[/C][C]0.398847[/C][/ROW]
[ROW][C]24[/C][C]-0.11128[/C][C]-0.862[/C][C]0.196068[/C][/ROW]
[ROW][C]25[/C][C]0.113942[/C][C]0.8826[/C][C]0.190491[/C][/ROW]
[ROW][C]26[/C][C]-0.049602[/C][C]-0.3842[/C][C]0.35109[/C][/ROW]
[ROW][C]27[/C][C]-0.042407[/C][C]-0.3285[/C][C]0.371844[/C][/ROW]
[ROW][C]28[/C][C]-0.046136[/C][C]-0.3574[/C][C]0.361036[/C][/ROW]
[ROW][C]29[/C][C]0.013549[/C][C]0.1049[/C][C]0.458384[/C][/ROW]
[ROW][C]30[/C][C]-0.058866[/C][C]-0.456[/C][C]0.325027[/C][/ROW]
[ROW][C]31[/C][C]-0.042594[/C][C]-0.3299[/C][C]0.371299[/C][/ROW]
[ROW][C]32[/C][C]-0.049702[/C][C]-0.385[/C][C]0.350803[/C][/ROW]
[ROW][C]33[/C][C]0.039113[/C][C]0.303[/C][C]0.38148[/C][/ROW]
[ROW][C]34[/C][C]-0.033072[/C][C]-0.2562[/C][C]0.399347[/C][/ROW]
[ROW][C]35[/C][C]0.099928[/C][C]0.774[/C][C]0.220973[/C][/ROW]
[ROW][C]36[/C][C]-0.048939[/C][C]-0.3791[/C][C]0.352982[/C][/ROW]
[ROW][C]37[/C][C]0.002315[/C][C]0.0179[/C][C]0.492877[/C][/ROW]
[ROW][C]38[/C][C]-0.001412[/C][C]-0.0109[/C][C]0.495655[/C][/ROW]
[ROW][C]39[/C][C]-0.07863[/C][C]-0.6091[/C][C]0.272391[/C][/ROW]
[ROW][C]40[/C][C]-0.021461[/C][C]-0.1662[/C][C]0.434266[/C][/ROW]
[ROW][C]41[/C][C]-0.099164[/C][C]-0.7681[/C][C]0.222713[/C][/ROW]
[ROW][C]42[/C][C]-0.002457[/C][C]-0.019[/C][C]0.492439[/C][/ROW]
[ROW][C]43[/C][C]0.065558[/C][C]0.5078[/C][C]0.306724[/C][/ROW]
[ROW][C]44[/C][C]-0.1228[/C][C]-0.9512[/C][C]0.172658[/C][/ROW]
[ROW][C]45[/C][C]0.012318[/C][C]0.0954[/C][C]0.462152[/C][/ROW]
[ROW][C]46[/C][C]-0.0011[/C][C]-0.0085[/C][C]0.496615[/C][/ROW]
[ROW][C]47[/C][C]-0.05912[/C][C]-0.4579[/C][C]0.324325[/C][/ROW]
[ROW][C]48[/C][C]-0.09986[/C][C]-0.7735[/C][C]0.221127[/C][/ROW]
[ROW][C]49[/C][C]0.012409[/C][C]0.0961[/C][C]0.461873[/C][/ROW]
[ROW][C]50[/C][C]0.075251[/C][C]0.5829[/C][C]0.281076[/C][/ROW]
[ROW][C]51[/C][C]-0.048836[/C][C]-0.3783[/C][C]0.353277[/C][/ROW]
[ROW][C]52[/C][C]0.038544[/C][C]0.2986[/C][C]0.383154[/C][/ROW]
[ROW][C]53[/C][C]0.052409[/C][C]0.406[/C][C]0.34311[/C][/ROW]
[ROW][C]54[/C][C]0.032942[/C][C]0.2552[/C][C]0.399733[/C][/ROW]
[ROW][C]55[/C][C]-0.024609[/C][C]-0.1906[/C][C]0.424734[/C][/ROW]
[ROW][C]56[/C][C]0.077555[/C][C]0.6007[/C][C]0.275139[/C][/ROW]
[ROW][C]57[/C][C]0.094467[/C][C]0.7317[/C][C]0.233588[/C][/ROW]
[ROW][C]58[/C][C]-0.092881[/C][C]-0.7195[/C][C]0.237327[/C][/ROW]
[ROW][C]59[/C][C]-0.114869[/C][C]-0.8898[/C][C]0.188572[/C][/ROW]
[ROW][C]60[/C][C]NA[/C][C]NA[/C][C]NA[/C][/ROW]
[/TABLE]
Source: https://freestatistics.org/blog/index.php?pk=31397&T=2

Globally Unique Identifier (entire table): ba.freestatistics.org/blog/index.php?pk=31397&T=2

As an alternative you can also use a QR Code:  

The GUIDs for individual cells are displayed in the table below:

Partial Autocorrelation Function
Time lag kPACF(k)T-STATP-value
10.0603710.46760.320871
2-0.027763-0.21510.415228
30.141221.09390.139189
4-0.115683-0.89610.186896
50.0360190.2790.390602
60.3265042.52910.007041
70.0370580.2870.387533
8-0.094794-0.73430.232823
90.0463490.3590.360421
10-0.061366-0.47530.318134
11-0.013287-0.10290.459184
120.705385.46380
13-0.263743-2.04290.022729
14-0.082908-0.64220.261594
15-0.020588-0.15950.436917
160.0715130.55390.290839
17-0.029947-0.2320.408675
18-0.215123-1.66630.05043
19-0.086685-0.67150.252252
200.040990.31750.375982
21-0.160917-1.24650.10872
220.0648040.5020.308763
23-0.03324-0.25750.398847
24-0.11128-0.8620.196068
250.1139420.88260.190491
26-0.049602-0.38420.35109
27-0.042407-0.32850.371844
28-0.046136-0.35740.361036
290.0135490.10490.458384
30-0.058866-0.4560.325027
31-0.042594-0.32990.371299
32-0.049702-0.3850.350803
330.0391130.3030.38148
34-0.033072-0.25620.399347
350.0999280.7740.220973
36-0.048939-0.37910.352982
370.0023150.01790.492877
38-0.001412-0.01090.495655
39-0.07863-0.60910.272391
40-0.021461-0.16620.434266
41-0.099164-0.76810.222713
42-0.002457-0.0190.492439
430.0655580.50780.306724
44-0.1228-0.95120.172658
450.0123180.09540.462152
46-0.0011-0.00850.496615
47-0.05912-0.45790.324325
48-0.09986-0.77350.221127
490.0124090.09610.461873
500.0752510.58290.281076
51-0.048836-0.37830.353277
520.0385440.29860.383154
530.0524090.4060.34311
540.0329420.25520.399733
55-0.024609-0.19060.424734
560.0775550.60070.275139
570.0944670.73170.233588
58-0.092881-0.71950.237327
59-0.114869-0.88980.188572
60NANANA


Parameters (Session):
par1 = 12 ;
Parameters (R input):
par1 = 60 ; par2 = 1 ; par3 = 0 ; par4 = 0 ; par5 = 12 ;
R code (references can be found in the software module):
if (par1 == 'Default') {
par1 = 10*log10(length(x))
} else {
par1 <- as.numeric(par1)
}
par2 <- as.numeric(par2)
par3 <- as.numeric(par3)
par4 <- as.numeric(par4)
par5 <- as.numeric(par5)
if (par2 == 0) {
x <- log(x)
} else {
x <- (x ^ par2 - 1) / par2
}
if (par3 > 0) x <- diff(x,lag=1,difference=par3)
if (par4 > 0) x <- diff(x,lag=par5,difference=par4)
bitmap(file='pic1.png')
racf <- acf(x,par1,main='Autocorrelation',xlab='lags',ylab='ACF')
dev.off()
bitmap(file='pic2.png')
rpacf <- pacf(x,par1,main='Partial Autocorrelation',xlab='lags',ylab='PACF')
dev.off()
(myacf <- c(racf$acf))
(mypacf <- c(rpacf$acf))
lengthx <- length(x)
sqrtn <- sqrt(lengthx)
load(file='createtable')
a<-table.start()
a<-table.row.start(a)
a<-table.element(a,'Autocorrelation Function',4,TRUE)
a<-table.row.end(a)
a<-table.row.start(a)
a<-table.element(a,'Time lag k',header=TRUE)
a<-table.element(a,hyperlink('basics.htm','ACF(k)','click here for more information about the Autocorrelation Function'),header=TRUE)
a<-table.element(a,'T-STAT',header=TRUE)
a<-table.element(a,'P-value',header=TRUE)
a<-table.row.end(a)
for (i in 2:(par1+1)) {
a<-table.row.start(a)
a<-table.element(a,i-1,header=TRUE)
a<-table.element(a,round(myacf[i],6))
mytstat <- myacf[i]*sqrtn
a<-table.element(a,round(mytstat,4))
a<-table.element(a,round(1-pt(abs(mytstat),lengthx),6))
a<-table.row.end(a)
}
a<-table.end(a)
table.save(a,file='mytable.tab')
a<-table.start()
a<-table.row.start(a)
a<-table.element(a,'Partial Autocorrelation Function',4,TRUE)
a<-table.row.end(a)
a<-table.row.start(a)
a<-table.element(a,'Time lag k',header=TRUE)
a<-table.element(a,hyperlink('basics.htm','PACF(k)','click here for more information about the Partial Autocorrelation Function'),header=TRUE)
a<-table.element(a,'T-STAT',header=TRUE)
a<-table.element(a,'P-value',header=TRUE)
a<-table.row.end(a)
for (i in 1:par1) {
a<-table.row.start(a)
a<-table.element(a,i,header=TRUE)
a<-table.element(a,round(mypacf[i],6))
mytstat <- mypacf[i]*sqrtn
a<-table.element(a,round(mytstat,4))
a<-table.element(a,round(1-pt(abs(mytstat),lengthx),6))
a<-table.row.end(a)
}
a<-table.end(a)
table.save(a,file='mytable1.tab')