Free Statistics

of Irreproducible Research!

Author's title

Author*The author of this computation has been verified*
R Software Modulerwasp_autocorrelation.wasp
Title produced by software(Partial) Autocorrelation Function
Date of computationSat, 06 Dec 2008 11:12:25 -0700
Cite this page as followsStatistical Computations at FreeStatistics.org, Office for Research Development and Education, URL https://freestatistics.org/blog/index.php?v=date/2008/Dec/06/t12285872596ghzzdgi2nk8dzz.htm/, Retrieved Fri, 17 May 2024 04:43:26 +0000
Statistical Computations at FreeStatistics.org, Office for Research Development and Education, URL https://freestatistics.org/blog/index.php?pk=29788, Retrieved Fri, 17 May 2024 04:43:26 +0000
QR Codes:

Original text written by user:
IsPrivate?No (this computation is public)
User-defined keywords
Estimated Impact218
Family? (F = Feedback message, R = changed R code, M = changed R Module, P = changed Parameters, D = changed Data)
-     [Univariate Data Series] [data set] [2008-12-01 19:54:57] [b98453cac15ba1066b407e146608df68]
F RMP   [Variance Reduction Matrix] [step 2] [2008-12-06 09:12:19] [9f5bfe3b95f9ec3d2ed4c0a560a9648a]
F RMPD      [(Partial) Autocorrelation Function] [step 2] [2008-12-06 18:12:25] [a9e6d7cd6e144e8b311d9f96a24c5a25] [Current]
Feedback Forum
2008-12-13 11:08:25 [Sam De Cuyper] [reply
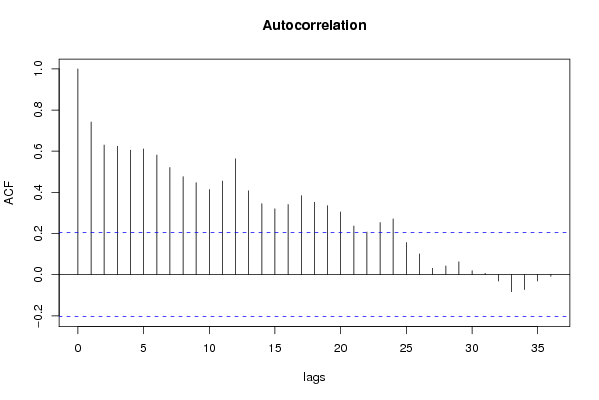
Klopt maar er is ook sprake van seizoenaliteit. Dit is te zien in lag 12 en 24, waar de waarde voor de waarneming iets hoger is. . Alle waarnemingen liggen buiten het 95% betrouwbaarheidsinterval. Dit wil zeggen dat er nog (niet toevallige) voorspelbare componenten aanwezig zijn die moeten geëlimineerd worden. Op het eerste zicht is seizoenaliteit niet aanwezig.
2008-12-16 19:02:14 [Kevin Vermeiren] [reply
Het klopt dat er een duidelijke lange termijn trend zichtbaar is. De student besluit terecht te differentiëren met parameter d=1.

Post a new message
Dataseries X:
2648.9
2669.6
3042.3
2604.2
2732.1
2621.7
2483.7
2479.3
2684.6
2834.7
2566.1
2251.2
2350
2299.8
2542.8
2530.2
2508.1
2616.8
2534.1
2181.8
2578.9
2841.9
2529.9
2103.2
2326.2
2452.6
2782.1
2727.3
2648.2
2760.7
2613
2225.4
2713.9
2923.3
2707
2473.9
2521
2531.8
3068.8
2826.9
2674.2
2966.6
2798.8
2629.6
3124.6
3115.7
3083
2863.9
2728.7
2789.4
3225.7
3148.2
2836.5
3153.5
2656.9
2834.7
3172.5
2998.8
3103.1
2735.6
2818.1
2874.4
3438.5
2949.1
3306.8
3530
3003.8
3206.4
3514.6
3522.6
3525.5
2996.2
3231.1
3030
3541.7
3113.2
3390.8
3424.2
3079.8
3123.4
3317.1
3579.9
3317.9
2668.1
3609.2
3535.2
3644.7
3925.7
3663.2
3905.3
3990
3695.8


Summary of computational transaction
Raw Inputview raw input (R code)
Raw Outputview raw output of R engine
Computing time2 seconds
R Server'George Udny Yule' @ 72.249.76.132

\begin{tabular}{lllllllll}
\hline
Summary of computational transaction \tabularnewline
Raw Input & view raw input (R code)  \tabularnewline
Raw Output & view raw output of R engine  \tabularnewline
Computing time & 2 seconds \tabularnewline
R Server & 'George Udny Yule' @ 72.249.76.132 \tabularnewline
\hline
\end{tabular}
%Source: https://freestatistics.org/blog/index.php?pk=29788&T=0

[TABLE]
[ROW][C]Summary of computational transaction[/C][/ROW]
[ROW][C]Raw Input[/C][C]view raw input (R code) [/C][/ROW]
[ROW][C]Raw Output[/C][C]view raw output of R engine [/C][/ROW]
[ROW][C]Computing time[/C][C]2 seconds[/C][/ROW]
[ROW][C]R Server[/C][C]'George Udny Yule' @ 72.249.76.132[/C][/ROW]
[/TABLE]
Source: https://freestatistics.org/blog/index.php?pk=29788&T=0

Globally Unique Identifier (entire table): ba.freestatistics.org/blog/index.php?pk=29788&T=0

As an alternative you can also use a QR Code:  

The GUIDs for individual cells are displayed in the table below:

Summary of computational transaction
Raw Inputview raw input (R code)
Raw Outputview raw output of R engine
Computing time2 seconds
R Server'George Udny Yule' @ 72.249.76.132


Autocorrelation Function
Time lag kACF(k)T-STATP-value
10.7415827.1130
20.6301086.04380
30.6242965.9880
40.6047435.80050
50.6109145.85970
60.5816145.57860
70.5204664.99211e-06
80.4761324.56698e-06
90.447184.28922.2e-05
100.413353.96477.3e-05
110.4546544.36091.7e-05
120.5631295.40130
130.4074413.9088.9e-05
140.3451933.3110.000665
150.3197553.0670.00142
160.3406813.26770.000763
170.383963.68280.000195
180.3519293.37560.00054
190.3354463.21750.000893
200.3048672.92420.002174
210.2363442.26690.012868
220.2070651.98610.024999
230.2530652.42730.008579
240.271022.59950.005437
250.155661.4930.069425
260.1007890.96670.168107
270.0307250.29470.384443
280.0423490.40620.342769
290.0625550.60.274987
300.018930.18160.428158
310.006510.06240.475173
32-0.031531-0.30240.381501
33-0.082863-0.79480.21439
34-0.072528-0.69570.244198
35-0.030712-0.29460.384489
36-0.008102-0.07770.469112

\begin{tabular}{lllllllll}
\hline
Autocorrelation Function \tabularnewline
Time lag k & ACF(k) & T-STAT & P-value \tabularnewline
1 & 0.741582 & 7.113 & 0 \tabularnewline
2 & 0.630108 & 6.0438 & 0 \tabularnewline
3 & 0.624296 & 5.988 & 0 \tabularnewline
4 & 0.604743 & 5.8005 & 0 \tabularnewline
5 & 0.610914 & 5.8597 & 0 \tabularnewline
6 & 0.581614 & 5.5786 & 0 \tabularnewline
7 & 0.520466 & 4.9921 & 1e-06 \tabularnewline
8 & 0.476132 & 4.5669 & 8e-06 \tabularnewline
9 & 0.44718 & 4.2892 & 2.2e-05 \tabularnewline
10 & 0.41335 & 3.9647 & 7.3e-05 \tabularnewline
11 & 0.454654 & 4.3609 & 1.7e-05 \tabularnewline
12 & 0.563129 & 5.4013 & 0 \tabularnewline
13 & 0.407441 & 3.908 & 8.9e-05 \tabularnewline
14 & 0.345193 & 3.311 & 0.000665 \tabularnewline
15 & 0.319755 & 3.067 & 0.00142 \tabularnewline
16 & 0.340681 & 3.2677 & 0.000763 \tabularnewline
17 & 0.38396 & 3.6828 & 0.000195 \tabularnewline
18 & 0.351929 & 3.3756 & 0.00054 \tabularnewline
19 & 0.335446 & 3.2175 & 0.000893 \tabularnewline
20 & 0.304867 & 2.9242 & 0.002174 \tabularnewline
21 & 0.236344 & 2.2669 & 0.012868 \tabularnewline
22 & 0.207065 & 1.9861 & 0.024999 \tabularnewline
23 & 0.253065 & 2.4273 & 0.008579 \tabularnewline
24 & 0.27102 & 2.5995 & 0.005437 \tabularnewline
25 & 0.15566 & 1.493 & 0.069425 \tabularnewline
26 & 0.100789 & 0.9667 & 0.168107 \tabularnewline
27 & 0.030725 & 0.2947 & 0.384443 \tabularnewline
28 & 0.042349 & 0.4062 & 0.342769 \tabularnewline
29 & 0.062555 & 0.6 & 0.274987 \tabularnewline
30 & 0.01893 & 0.1816 & 0.428158 \tabularnewline
31 & 0.00651 & 0.0624 & 0.475173 \tabularnewline
32 & -0.031531 & -0.3024 & 0.381501 \tabularnewline
33 & -0.082863 & -0.7948 & 0.21439 \tabularnewline
34 & -0.072528 & -0.6957 & 0.244198 \tabularnewline
35 & -0.030712 & -0.2946 & 0.384489 \tabularnewline
36 & -0.008102 & -0.0777 & 0.469112 \tabularnewline
\hline
\end{tabular}
%Source: https://freestatistics.org/blog/index.php?pk=29788&T=1

[TABLE]
[ROW][C]Autocorrelation Function[/C][/ROW]
[ROW][C]Time lag k[/C][C]ACF(k)[/C][C]T-STAT[/C][C]P-value[/C][/ROW]
[ROW][C]1[/C][C]0.741582[/C][C]7.113[/C][C]0[/C][/ROW]
[ROW][C]2[/C][C]0.630108[/C][C]6.0438[/C][C]0[/C][/ROW]
[ROW][C]3[/C][C]0.624296[/C][C]5.988[/C][C]0[/C][/ROW]
[ROW][C]4[/C][C]0.604743[/C][C]5.8005[/C][C]0[/C][/ROW]
[ROW][C]5[/C][C]0.610914[/C][C]5.8597[/C][C]0[/C][/ROW]
[ROW][C]6[/C][C]0.581614[/C][C]5.5786[/C][C]0[/C][/ROW]
[ROW][C]7[/C][C]0.520466[/C][C]4.9921[/C][C]1e-06[/C][/ROW]
[ROW][C]8[/C][C]0.476132[/C][C]4.5669[/C][C]8e-06[/C][/ROW]
[ROW][C]9[/C][C]0.44718[/C][C]4.2892[/C][C]2.2e-05[/C][/ROW]
[ROW][C]10[/C][C]0.41335[/C][C]3.9647[/C][C]7.3e-05[/C][/ROW]
[ROW][C]11[/C][C]0.454654[/C][C]4.3609[/C][C]1.7e-05[/C][/ROW]
[ROW][C]12[/C][C]0.563129[/C][C]5.4013[/C][C]0[/C][/ROW]
[ROW][C]13[/C][C]0.407441[/C][C]3.908[/C][C]8.9e-05[/C][/ROW]
[ROW][C]14[/C][C]0.345193[/C][C]3.311[/C][C]0.000665[/C][/ROW]
[ROW][C]15[/C][C]0.319755[/C][C]3.067[/C][C]0.00142[/C][/ROW]
[ROW][C]16[/C][C]0.340681[/C][C]3.2677[/C][C]0.000763[/C][/ROW]
[ROW][C]17[/C][C]0.38396[/C][C]3.6828[/C][C]0.000195[/C][/ROW]
[ROW][C]18[/C][C]0.351929[/C][C]3.3756[/C][C]0.00054[/C][/ROW]
[ROW][C]19[/C][C]0.335446[/C][C]3.2175[/C][C]0.000893[/C][/ROW]
[ROW][C]20[/C][C]0.304867[/C][C]2.9242[/C][C]0.002174[/C][/ROW]
[ROW][C]21[/C][C]0.236344[/C][C]2.2669[/C][C]0.012868[/C][/ROW]
[ROW][C]22[/C][C]0.207065[/C][C]1.9861[/C][C]0.024999[/C][/ROW]
[ROW][C]23[/C][C]0.253065[/C][C]2.4273[/C][C]0.008579[/C][/ROW]
[ROW][C]24[/C][C]0.27102[/C][C]2.5995[/C][C]0.005437[/C][/ROW]
[ROW][C]25[/C][C]0.15566[/C][C]1.493[/C][C]0.069425[/C][/ROW]
[ROW][C]26[/C][C]0.100789[/C][C]0.9667[/C][C]0.168107[/C][/ROW]
[ROW][C]27[/C][C]0.030725[/C][C]0.2947[/C][C]0.384443[/C][/ROW]
[ROW][C]28[/C][C]0.042349[/C][C]0.4062[/C][C]0.342769[/C][/ROW]
[ROW][C]29[/C][C]0.062555[/C][C]0.6[/C][C]0.274987[/C][/ROW]
[ROW][C]30[/C][C]0.01893[/C][C]0.1816[/C][C]0.428158[/C][/ROW]
[ROW][C]31[/C][C]0.00651[/C][C]0.0624[/C][C]0.475173[/C][/ROW]
[ROW][C]32[/C][C]-0.031531[/C][C]-0.3024[/C][C]0.381501[/C][/ROW]
[ROW][C]33[/C][C]-0.082863[/C][C]-0.7948[/C][C]0.21439[/C][/ROW]
[ROW][C]34[/C][C]-0.072528[/C][C]-0.6957[/C][C]0.244198[/C][/ROW]
[ROW][C]35[/C][C]-0.030712[/C][C]-0.2946[/C][C]0.384489[/C][/ROW]
[ROW][C]36[/C][C]-0.008102[/C][C]-0.0777[/C][C]0.469112[/C][/ROW]
[/TABLE]
Source: https://freestatistics.org/blog/index.php?pk=29788&T=1

Globally Unique Identifier (entire table): ba.freestatistics.org/blog/index.php?pk=29788&T=1

As an alternative you can also use a QR Code:  

The GUIDs for individual cells are displayed in the table below:

Autocorrelation Function
Time lag kACF(k)T-STATP-value
10.7415827.1130
20.6301086.04380
30.6242965.9880
40.6047435.80050
50.6109145.85970
60.5816145.57860
70.5204664.99211e-06
80.4761324.56698e-06
90.447184.28922.2e-05
100.413353.96477.3e-05
110.4546544.36091.7e-05
120.5631295.40130
130.4074413.9088.9e-05
140.3451933.3110.000665
150.3197553.0670.00142
160.3406813.26770.000763
170.383963.68280.000195
180.3519293.37560.00054
190.3354463.21750.000893
200.3048672.92420.002174
210.2363442.26690.012868
220.2070651.98610.024999
230.2530652.42730.008579
240.271022.59950.005437
250.155661.4930.069425
260.1007890.96670.168107
270.0307250.29470.384443
280.0423490.40620.342769
290.0625550.60.274987
300.018930.18160.428158
310.006510.06240.475173
32-0.031531-0.30240.381501
33-0.082863-0.79480.21439
34-0.072528-0.69570.244198
35-0.030712-0.29460.384489
36-0.008102-0.07770.469112


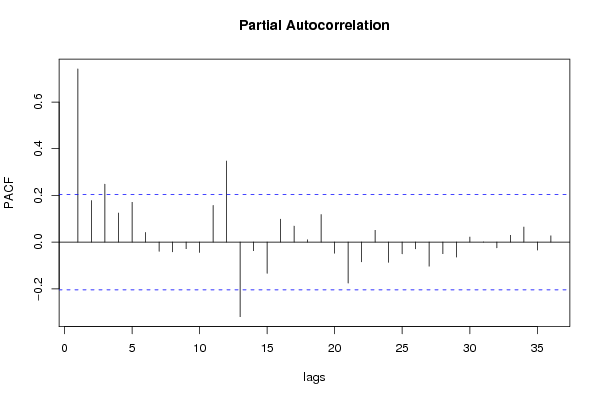
Partial Autocorrelation Function
Time lag kPACF(k)T-STATP-value
10.7415827.1130
20.1781221.70850.045459
30.24822.38060.009672
40.1243821.1930.117962
50.1707141.63740.052479
60.0414970.3980.345766
7-0.039559-0.37940.352618
8-0.041345-0.39660.346302
9-0.02829-0.27130.393365
10-0.044318-0.42510.335884
110.1571941.50780.067522
120.3471263.32950.000626
13-0.319236-3.0620.001441
14-0.036863-0.35360.362234
15-0.133841-1.28380.101225
160.0982170.94210.174314
170.068480.65680.256461
180.0098830.09480.462344
190.1177851.12980.130758
20-0.047266-0.45340.32568
21-0.175564-1.68390.047791
22-0.084479-0.81030.20993
230.0503420.48290.315171
24-0.086571-0.83040.204242
25-0.050149-0.4810.315824
26-0.028847-0.27670.39132
27-0.103169-0.98960.162492
28-0.049753-0.47720.317172
29-0.064254-0.61630.269607
300.021720.20830.417714
310.0005940.00570.497733
32-0.024437-0.23440.407602
330.0293150.28120.389602
340.0643670.61740.269252
35-0.03385-0.32470.373081
360.0271190.26010.397678

\begin{tabular}{lllllllll}
\hline
Partial Autocorrelation Function \tabularnewline
Time lag k & PACF(k) & T-STAT & P-value \tabularnewline
1 & 0.741582 & 7.113 & 0 \tabularnewline
2 & 0.178122 & 1.7085 & 0.045459 \tabularnewline
3 & 0.2482 & 2.3806 & 0.009672 \tabularnewline
4 & 0.124382 & 1.193 & 0.117962 \tabularnewline
5 & 0.170714 & 1.6374 & 0.052479 \tabularnewline
6 & 0.041497 & 0.398 & 0.345766 \tabularnewline
7 & -0.039559 & -0.3794 & 0.352618 \tabularnewline
8 & -0.041345 & -0.3966 & 0.346302 \tabularnewline
9 & -0.02829 & -0.2713 & 0.393365 \tabularnewline
10 & -0.044318 & -0.4251 & 0.335884 \tabularnewline
11 & 0.157194 & 1.5078 & 0.067522 \tabularnewline
12 & 0.347126 & 3.3295 & 0.000626 \tabularnewline
13 & -0.319236 & -3.062 & 0.001441 \tabularnewline
14 & -0.036863 & -0.3536 & 0.362234 \tabularnewline
15 & -0.133841 & -1.2838 & 0.101225 \tabularnewline
16 & 0.098217 & 0.9421 & 0.174314 \tabularnewline
17 & 0.06848 & 0.6568 & 0.256461 \tabularnewline
18 & 0.009883 & 0.0948 & 0.462344 \tabularnewline
19 & 0.117785 & 1.1298 & 0.130758 \tabularnewline
20 & -0.047266 & -0.4534 & 0.32568 \tabularnewline
21 & -0.175564 & -1.6839 & 0.047791 \tabularnewline
22 & -0.084479 & -0.8103 & 0.20993 \tabularnewline
23 & 0.050342 & 0.4829 & 0.315171 \tabularnewline
24 & -0.086571 & -0.8304 & 0.204242 \tabularnewline
25 & -0.050149 & -0.481 & 0.315824 \tabularnewline
26 & -0.028847 & -0.2767 & 0.39132 \tabularnewline
27 & -0.103169 & -0.9896 & 0.162492 \tabularnewline
28 & -0.049753 & -0.4772 & 0.317172 \tabularnewline
29 & -0.064254 & -0.6163 & 0.269607 \tabularnewline
30 & 0.02172 & 0.2083 & 0.417714 \tabularnewline
31 & 0.000594 & 0.0057 & 0.497733 \tabularnewline
32 & -0.024437 & -0.2344 & 0.407602 \tabularnewline
33 & 0.029315 & 0.2812 & 0.389602 \tabularnewline
34 & 0.064367 & 0.6174 & 0.269252 \tabularnewline
35 & -0.03385 & -0.3247 & 0.373081 \tabularnewline
36 & 0.027119 & 0.2601 & 0.397678 \tabularnewline
\hline
\end{tabular}
%Source: https://freestatistics.org/blog/index.php?pk=29788&T=2

[TABLE]
[ROW][C]Partial Autocorrelation Function[/C][/ROW]
[ROW][C]Time lag k[/C][C]PACF(k)[/C][C]T-STAT[/C][C]P-value[/C][/ROW]
[ROW][C]1[/C][C]0.741582[/C][C]7.113[/C][C]0[/C][/ROW]
[ROW][C]2[/C][C]0.178122[/C][C]1.7085[/C][C]0.045459[/C][/ROW]
[ROW][C]3[/C][C]0.2482[/C][C]2.3806[/C][C]0.009672[/C][/ROW]
[ROW][C]4[/C][C]0.124382[/C][C]1.193[/C][C]0.117962[/C][/ROW]
[ROW][C]5[/C][C]0.170714[/C][C]1.6374[/C][C]0.052479[/C][/ROW]
[ROW][C]6[/C][C]0.041497[/C][C]0.398[/C][C]0.345766[/C][/ROW]
[ROW][C]7[/C][C]-0.039559[/C][C]-0.3794[/C][C]0.352618[/C][/ROW]
[ROW][C]8[/C][C]-0.041345[/C][C]-0.3966[/C][C]0.346302[/C][/ROW]
[ROW][C]9[/C][C]-0.02829[/C][C]-0.2713[/C][C]0.393365[/C][/ROW]
[ROW][C]10[/C][C]-0.044318[/C][C]-0.4251[/C][C]0.335884[/C][/ROW]
[ROW][C]11[/C][C]0.157194[/C][C]1.5078[/C][C]0.067522[/C][/ROW]
[ROW][C]12[/C][C]0.347126[/C][C]3.3295[/C][C]0.000626[/C][/ROW]
[ROW][C]13[/C][C]-0.319236[/C][C]-3.062[/C][C]0.001441[/C][/ROW]
[ROW][C]14[/C][C]-0.036863[/C][C]-0.3536[/C][C]0.362234[/C][/ROW]
[ROW][C]15[/C][C]-0.133841[/C][C]-1.2838[/C][C]0.101225[/C][/ROW]
[ROW][C]16[/C][C]0.098217[/C][C]0.9421[/C][C]0.174314[/C][/ROW]
[ROW][C]17[/C][C]0.06848[/C][C]0.6568[/C][C]0.256461[/C][/ROW]
[ROW][C]18[/C][C]0.009883[/C][C]0.0948[/C][C]0.462344[/C][/ROW]
[ROW][C]19[/C][C]0.117785[/C][C]1.1298[/C][C]0.130758[/C][/ROW]
[ROW][C]20[/C][C]-0.047266[/C][C]-0.4534[/C][C]0.32568[/C][/ROW]
[ROW][C]21[/C][C]-0.175564[/C][C]-1.6839[/C][C]0.047791[/C][/ROW]
[ROW][C]22[/C][C]-0.084479[/C][C]-0.8103[/C][C]0.20993[/C][/ROW]
[ROW][C]23[/C][C]0.050342[/C][C]0.4829[/C][C]0.315171[/C][/ROW]
[ROW][C]24[/C][C]-0.086571[/C][C]-0.8304[/C][C]0.204242[/C][/ROW]
[ROW][C]25[/C][C]-0.050149[/C][C]-0.481[/C][C]0.315824[/C][/ROW]
[ROW][C]26[/C][C]-0.028847[/C][C]-0.2767[/C][C]0.39132[/C][/ROW]
[ROW][C]27[/C][C]-0.103169[/C][C]-0.9896[/C][C]0.162492[/C][/ROW]
[ROW][C]28[/C][C]-0.049753[/C][C]-0.4772[/C][C]0.317172[/C][/ROW]
[ROW][C]29[/C][C]-0.064254[/C][C]-0.6163[/C][C]0.269607[/C][/ROW]
[ROW][C]30[/C][C]0.02172[/C][C]0.2083[/C][C]0.417714[/C][/ROW]
[ROW][C]31[/C][C]0.000594[/C][C]0.0057[/C][C]0.497733[/C][/ROW]
[ROW][C]32[/C][C]-0.024437[/C][C]-0.2344[/C][C]0.407602[/C][/ROW]
[ROW][C]33[/C][C]0.029315[/C][C]0.2812[/C][C]0.389602[/C][/ROW]
[ROW][C]34[/C][C]0.064367[/C][C]0.6174[/C][C]0.269252[/C][/ROW]
[ROW][C]35[/C][C]-0.03385[/C][C]-0.3247[/C][C]0.373081[/C][/ROW]
[ROW][C]36[/C][C]0.027119[/C][C]0.2601[/C][C]0.397678[/C][/ROW]
[/TABLE]
Source: https://freestatistics.org/blog/index.php?pk=29788&T=2

Globally Unique Identifier (entire table): ba.freestatistics.org/blog/index.php?pk=29788&T=2

As an alternative you can also use a QR Code:  

The GUIDs for individual cells are displayed in the table below:

Partial Autocorrelation Function
Time lag kPACF(k)T-STATP-value
10.7415827.1130
20.1781221.70850.045459
30.24822.38060.009672
40.1243821.1930.117962
50.1707141.63740.052479
60.0414970.3980.345766
7-0.039559-0.37940.352618
8-0.041345-0.39660.346302
9-0.02829-0.27130.393365
10-0.044318-0.42510.335884
110.1571941.50780.067522
120.3471263.32950.000626
13-0.319236-3.0620.001441
14-0.036863-0.35360.362234
15-0.133841-1.28380.101225
160.0982170.94210.174314
170.068480.65680.256461
180.0098830.09480.462344
190.1177851.12980.130758
20-0.047266-0.45340.32568
21-0.175564-1.68390.047791
22-0.084479-0.81030.20993
230.0503420.48290.315171
24-0.086571-0.83040.204242
25-0.050149-0.4810.315824
26-0.028847-0.27670.39132
27-0.103169-0.98960.162492
28-0.049753-0.47720.317172
29-0.064254-0.61630.269607
300.021720.20830.417714
310.0005940.00570.497733
32-0.024437-0.23440.407602
330.0293150.28120.389602
340.0643670.61740.269252
35-0.03385-0.32470.373081
360.0271190.26010.397678


Parameters (Session):
par1 = 36 ; par2 = 1 ; par3 = 0 ; par4 = 0 ; par5 = 12 ;
Parameters (R input):
par1 = 36 ; par2 = 1 ; par3 = 0 ; par4 = 0 ; par5 = 12 ;
R code (references can be found in the software module):
if (par1 == 'Default') {
par1 = 10*log10(length(x))
} else {
par1 <- as.numeric(par1)
}
par2 <- as.numeric(par2)
par3 <- as.numeric(par3)
par4 <- as.numeric(par4)
par5 <- as.numeric(par5)
if (par2 == 0) {
x <- log(x)
} else {
x <- (x ^ par2 - 1) / par2
}
if (par3 > 0) x <- diff(x,lag=1,difference=par3)
if (par4 > 0) x <- diff(x,lag=par5,difference=par4)
bitmap(file='pic1.png')
racf <- acf(x,par1,main='Autocorrelation',xlab='lags',ylab='ACF')
dev.off()
bitmap(file='pic2.png')
rpacf <- pacf(x,par1,main='Partial Autocorrelation',xlab='lags',ylab='PACF')
dev.off()
(myacf <- c(racf$acf))
(mypacf <- c(rpacf$acf))
lengthx <- length(x)
sqrtn <- sqrt(lengthx)
load(file='createtable')
a<-table.start()
a<-table.row.start(a)
a<-table.element(a,'Autocorrelation Function',4,TRUE)
a<-table.row.end(a)
a<-table.row.start(a)
a<-table.element(a,'Time lag k',header=TRUE)
a<-table.element(a,hyperlink('basics.htm','ACF(k)','click here for more information about the Autocorrelation Function'),header=TRUE)
a<-table.element(a,'T-STAT',header=TRUE)
a<-table.element(a,'P-value',header=TRUE)
a<-table.row.end(a)
for (i in 2:(par1+1)) {
a<-table.row.start(a)
a<-table.element(a,i-1,header=TRUE)
a<-table.element(a,round(myacf[i],6))
mytstat <- myacf[i]*sqrtn
a<-table.element(a,round(mytstat,4))
a<-table.element(a,round(1-pt(abs(mytstat),lengthx),6))
a<-table.row.end(a)
}
a<-table.end(a)
table.save(a,file='mytable.tab')
a<-table.start()
a<-table.row.start(a)
a<-table.element(a,'Partial Autocorrelation Function',4,TRUE)
a<-table.row.end(a)
a<-table.row.start(a)
a<-table.element(a,'Time lag k',header=TRUE)
a<-table.element(a,hyperlink('basics.htm','PACF(k)','click here for more information about the Partial Autocorrelation Function'),header=TRUE)
a<-table.element(a,'T-STAT',header=TRUE)
a<-table.element(a,'P-value',header=TRUE)
a<-table.row.end(a)
for (i in 1:par1) {
a<-table.row.start(a)
a<-table.element(a,i,header=TRUE)
a<-table.element(a,round(mypacf[i],6))
mytstat <- mypacf[i]*sqrtn
a<-table.element(a,round(mytstat,4))
a<-table.element(a,round(1-pt(abs(mytstat),lengthx),6))
a<-table.row.end(a)
}
a<-table.end(a)
table.save(a,file='mytable1.tab')