Free Statistics

of Irreproducible Research!

Author's title

Author*Unverified author*
R Software Modulerwasp_cross.wasp
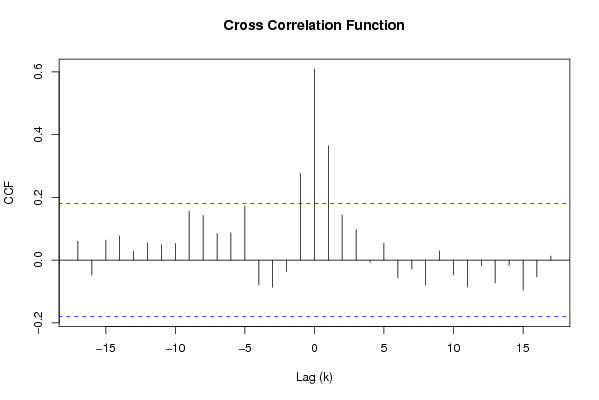
Title produced by softwareCross Correlation Function
Date of computationSat, 06 Dec 2008 05:04:07 -0700
Cite this page as followsStatistical Computations at FreeStatistics.org, Office for Research Development and Education, URL https://freestatistics.org/blog/index.php?v=date/2008/Dec/06/t1228565091px4962l5phuobgy.htm/, Retrieved Fri, 17 May 2024 02:40:52 +0000
Statistical Computations at FreeStatistics.org, Office for Research Development and Education, URL https://freestatistics.org/blog/index.php?pk=29533, Retrieved Fri, 17 May 2024 02:40:52 +0000
QR Codes:

Original text written by user:
IsPrivate?No (this computation is public)
User-defined keywords
Estimated Impact198
Family? (F = Feedback message, R = changed R code, M = changed R Module, P = changed Parameters, D = changed Data)
F     [Univariate Data Series] [Airline data] [2007-10-18 09:58:47] [42daae401fd3def69a25014f2252b4c2]
F RMPD  [Cross Correlation Function] [question 8] [2008-12-02 14:53:11] [31c9f333c18b3396ccf9d2485dd39c8a]
-   P       [Cross Correlation Function] [] [2008-12-06 12:04:07] [86e877ba38171644c8ca01af8044e645] [Current]
Feedback Forum

Post a new message
Dataseries X:
1.2732
1.3322
1.4369
1.4975
1.5770
1.5553
1.5557
1.5750
1.5527
1.4748
1.4718
1.4570
1.4684
1.4227
1.3896
1.3622
1.3716
1.3419
1.3511
1.3516
1.3242
1.3074
1.2999
1.3213
1.2881
1.2611
1.2727
1.2811
1.2684
1.2650
1.2770
1.2271
1.2020
1.1938
1.2103
1.1856
1.1786
1.2015
1.2256
1.2292
1.2037
1.2165
1.2694
1.2938
1.3201
1.3014
1.3119
1.3408
1.2991
1.2490
1.2218
1.2176
1.2266
1.2138
1.2007
1.1985
1.2262
1.2646
1.2613
1.2286
1.1702
1.1692
1.1222
1.1139
1.1372
1.1663
1.1582
1.0848
1.0807
1.0773
1.0622
1.0183
1.0014
0.9811
0.9808
0.9778
0.9922
0.9554
0.9170
0.8858
0.8758
0.8700
0.8833
0.8924
0.8883
0.9059
0.9111
0.9005
0.8607
0.8532
0.8742
0.8920
0.9095
0.9217
0.9383
0.8973
0.8564
0.8552
0.8721
0.9041
0.9397
0.9492
0.9060
0.9470
0.9643
0.9834
1.0137
1.0110
1.0338
1.0706
1.0501
1.0604
1.0353
1.0378
1.0628
1.0704
1.0883
1.1208
1.1608
Dataseries Y:
123.28
133.52
153.20
163.63
168.45
166.26
162.31
161.56
156.59
157.97
158.68
163.55
162.89
164.95
159.82
159.05
166.76
164.55
163.22
160.68
155.24
157.60
156.56
154.82
151.11
149.65
148.99
148.53
146.70
145.11
142.70
143.59
140.96
140.77
139.81
140.58
139.59
138.05
136.06
135.98
134.75
132.22
135.37
138.84
138.83
136.55
135.63
139.14
136.09
135.97
134.51
134.54
134.08
132.86
134.48
129.08
133.13
134.78
134.13
132.43
127.84
128.12
128.94
132.38
134.99
138.05
135.83
130.12
128.16
128.60
126.12
124.20
121.65
121.57
118.38
116.31
117.11
117.80
115.86
115.81
114.75
116.23
117.12
113.38
108.68
109.86
108.20
109.34
107.21
104.30
106.50
110.36
110.33
107.08
109.57
100.61
93.26
92.74
93.11
97.76
101.39
100.71
98.09
99.92
102.59
107.64
106.53
103.72
108.25
113.52
112.39
120.10
123.71
125.32
129.71
128.16
130.20
130.78
131.35


Summary of computational transaction
Raw Inputview raw input (R code)
Raw Outputview raw output of R engine
Computing time2 seconds
R Server'Sir Ronald Aylmer Fisher' @ 193.190.124.24

\begin{tabular}{lllllllll}
\hline
Summary of computational transaction \tabularnewline
Raw Input & view raw input (R code)  \tabularnewline
Raw Output & view raw output of R engine  \tabularnewline
Computing time & 2 seconds \tabularnewline
R Server & 'Sir Ronald Aylmer Fisher' @ 193.190.124.24 \tabularnewline
\hline
\end{tabular}
%Source: https://freestatistics.org/blog/index.php?pk=29533&T=0

[TABLE]
[ROW][C]Summary of computational transaction[/C][/ROW]
[ROW][C]Raw Input[/C][C]view raw input (R code) [/C][/ROW]
[ROW][C]Raw Output[/C][C]view raw output of R engine [/C][/ROW]
[ROW][C]Computing time[/C][C]2 seconds[/C][/ROW]
[ROW][C]R Server[/C][C]'Sir Ronald Aylmer Fisher' @ 193.190.124.24[/C][/ROW]
[/TABLE]
Source: https://freestatistics.org/blog/index.php?pk=29533&T=0

Globally Unique Identifier (entire table): ba.freestatistics.org/blog/index.php?pk=29533&T=0

As an alternative you can also use a QR Code:  

The GUIDs for individual cells are displayed in the table below:

Summary of computational transaction
Raw Inputview raw input (R code)
Raw Outputview raw output of R engine
Computing time2 seconds
R Server'Sir Ronald Aylmer Fisher' @ 193.190.124.24


Cross Correlation Function
ParameterValue
Box-Cox transformation parameter (lambda) of X series1
Degree of non-seasonal differencing (d) of X series1
Degree of seasonal differencing (D) of X series0
Seasonal Period (s)12
Box-Cox transformation parameter (lambda) of Y series1
Degree of non-seasonal differencing (d) of Y series1
Degree of seasonal differencing (D) of Y series0
krho(Y[t],X[t+k])
-170.059659366742594
-16-0.0475197630425506
-150.0636077759236124
-140.0771155489114555
-130.0279223142775275
-120.0546666249076538
-110.0493411576150038
-100.0527328991743114
-90.155569104378844
-80.142287341603591
-70.0844438618785003
-60.0867112354064561
-50.172361140446244
-4-0.0789207296732426
-3-0.0868911226264444
-2-0.0357665844864829
-10.276836425741123
00.60946638513519
10.364574852720265
20.143949790117031
30.0966553535192872
4-0.00682736484490102
50.0536081682717064
6-0.0566204592375451
7-0.0287271270736753
8-0.0790411856254062
90.0292685489956967
10-0.0472425959592205
11-0.086084362752031
12-0.0181262652564343
13-0.0733863750879554
14-0.0164142431404756
15-0.0958477295566867
16-0.0536803852733082
170.0127416832596956

\begin{tabular}{lllllllll}
\hline
Cross Correlation Function \tabularnewline
Parameter & Value \tabularnewline
Box-Cox transformation parameter (lambda) of X series & 1 \tabularnewline
Degree of non-seasonal differencing (d) of X series & 1 \tabularnewline
Degree of seasonal differencing (D) of X series & 0 \tabularnewline
Seasonal Period (s) & 12 \tabularnewline
Box-Cox transformation parameter (lambda) of Y series & 1 \tabularnewline
Degree of non-seasonal differencing (d) of Y series & 1 \tabularnewline
Degree of seasonal differencing (D) of Y series & 0 \tabularnewline
k & rho(Y[t],X[t+k]) \tabularnewline
-17 & 0.059659366742594 \tabularnewline
-16 & -0.0475197630425506 \tabularnewline
-15 & 0.0636077759236124 \tabularnewline
-14 & 0.0771155489114555 \tabularnewline
-13 & 0.0279223142775275 \tabularnewline
-12 & 0.0546666249076538 \tabularnewline
-11 & 0.0493411576150038 \tabularnewline
-10 & 0.0527328991743114 \tabularnewline
-9 & 0.155569104378844 \tabularnewline
-8 & 0.142287341603591 \tabularnewline
-7 & 0.0844438618785003 \tabularnewline
-6 & 0.0867112354064561 \tabularnewline
-5 & 0.172361140446244 \tabularnewline
-4 & -0.0789207296732426 \tabularnewline
-3 & -0.0868911226264444 \tabularnewline
-2 & -0.0357665844864829 \tabularnewline
-1 & 0.276836425741123 \tabularnewline
0 & 0.60946638513519 \tabularnewline
1 & 0.364574852720265 \tabularnewline
2 & 0.143949790117031 \tabularnewline
3 & 0.0966553535192872 \tabularnewline
4 & -0.00682736484490102 \tabularnewline
5 & 0.0536081682717064 \tabularnewline
6 & -0.0566204592375451 \tabularnewline
7 & -0.0287271270736753 \tabularnewline
8 & -0.0790411856254062 \tabularnewline
9 & 0.0292685489956967 \tabularnewline
10 & -0.0472425959592205 \tabularnewline
11 & -0.086084362752031 \tabularnewline
12 & -0.0181262652564343 \tabularnewline
13 & -0.0733863750879554 \tabularnewline
14 & -0.0164142431404756 \tabularnewline
15 & -0.0958477295566867 \tabularnewline
16 & -0.0536803852733082 \tabularnewline
17 & 0.0127416832596956 \tabularnewline
\hline
\end{tabular}
%Source: https://freestatistics.org/blog/index.php?pk=29533&T=1

[TABLE]
[ROW][C]Cross Correlation Function[/C][/ROW]
[ROW][C]Parameter[/C][C]Value[/C][/ROW]
[ROW][C]Box-Cox transformation parameter (lambda) of X series[/C][C]1[/C][/ROW]
[ROW][C]Degree of non-seasonal differencing (d) of X series[/C][C]1[/C][/ROW]
[ROW][C]Degree of seasonal differencing (D) of X series[/C][C]0[/C][/ROW]
[ROW][C]Seasonal Period (s)[/C][C]12[/C][/ROW]
[ROW][C]Box-Cox transformation parameter (lambda) of Y series[/C][C]1[/C][/ROW]
[ROW][C]Degree of non-seasonal differencing (d) of Y series[/C][C]1[/C][/ROW]
[ROW][C]Degree of seasonal differencing (D) of Y series[/C][C]0[/C][/ROW]
[ROW][C]k[/C][C]rho(Y[t],X[t+k])[/C][/ROW]
[ROW][C]-17[/C][C]0.059659366742594[/C][/ROW]
[ROW][C]-16[/C][C]-0.0475197630425506[/C][/ROW]
[ROW][C]-15[/C][C]0.0636077759236124[/C][/ROW]
[ROW][C]-14[/C][C]0.0771155489114555[/C][/ROW]
[ROW][C]-13[/C][C]0.0279223142775275[/C][/ROW]
[ROW][C]-12[/C][C]0.0546666249076538[/C][/ROW]
[ROW][C]-11[/C][C]0.0493411576150038[/C][/ROW]
[ROW][C]-10[/C][C]0.0527328991743114[/C][/ROW]
[ROW][C]-9[/C][C]0.155569104378844[/C][/ROW]
[ROW][C]-8[/C][C]0.142287341603591[/C][/ROW]
[ROW][C]-7[/C][C]0.0844438618785003[/C][/ROW]
[ROW][C]-6[/C][C]0.0867112354064561[/C][/ROW]
[ROW][C]-5[/C][C]0.172361140446244[/C][/ROW]
[ROW][C]-4[/C][C]-0.0789207296732426[/C][/ROW]
[ROW][C]-3[/C][C]-0.0868911226264444[/C][/ROW]
[ROW][C]-2[/C][C]-0.0357665844864829[/C][/ROW]
[ROW][C]-1[/C][C]0.276836425741123[/C][/ROW]
[ROW][C]0[/C][C]0.60946638513519[/C][/ROW]
[ROW][C]1[/C][C]0.364574852720265[/C][/ROW]
[ROW][C]2[/C][C]0.143949790117031[/C][/ROW]
[ROW][C]3[/C][C]0.0966553535192872[/C][/ROW]
[ROW][C]4[/C][C]-0.00682736484490102[/C][/ROW]
[ROW][C]5[/C][C]0.0536081682717064[/C][/ROW]
[ROW][C]6[/C][C]-0.0566204592375451[/C][/ROW]
[ROW][C]7[/C][C]-0.0287271270736753[/C][/ROW]
[ROW][C]8[/C][C]-0.0790411856254062[/C][/ROW]
[ROW][C]9[/C][C]0.0292685489956967[/C][/ROW]
[ROW][C]10[/C][C]-0.0472425959592205[/C][/ROW]
[ROW][C]11[/C][C]-0.086084362752031[/C][/ROW]
[ROW][C]12[/C][C]-0.0181262652564343[/C][/ROW]
[ROW][C]13[/C][C]-0.0733863750879554[/C][/ROW]
[ROW][C]14[/C][C]-0.0164142431404756[/C][/ROW]
[ROW][C]15[/C][C]-0.0958477295566867[/C][/ROW]
[ROW][C]16[/C][C]-0.0536803852733082[/C][/ROW]
[ROW][C]17[/C][C]0.0127416832596956[/C][/ROW]
[/TABLE]
Source: https://freestatistics.org/blog/index.php?pk=29533&T=1

Globally Unique Identifier (entire table): ba.freestatistics.org/blog/index.php?pk=29533&T=1

As an alternative you can also use a QR Code:  

The GUIDs for individual cells are displayed in the table below:

Cross Correlation Function
ParameterValue
Box-Cox transformation parameter (lambda) of X series1
Degree of non-seasonal differencing (d) of X series1
Degree of seasonal differencing (D) of X series0
Seasonal Period (s)12
Box-Cox transformation parameter (lambda) of Y series1
Degree of non-seasonal differencing (d) of Y series1
Degree of seasonal differencing (D) of Y series0
krho(Y[t],X[t+k])
-170.059659366742594
-16-0.0475197630425506
-150.0636077759236124
-140.0771155489114555
-130.0279223142775275
-120.0546666249076538
-110.0493411576150038
-100.0527328991743114
-90.155569104378844
-80.142287341603591
-70.0844438618785003
-60.0867112354064561
-50.172361140446244
-4-0.0789207296732426
-3-0.0868911226264444
-2-0.0357665844864829
-10.276836425741123
00.60946638513519
10.364574852720265
20.143949790117031
30.0966553535192872
4-0.00682736484490102
50.0536081682717064
6-0.0566204592375451
7-0.0287271270736753
8-0.0790411856254062
90.0292685489956967
10-0.0472425959592205
11-0.086084362752031
12-0.0181262652564343
13-0.0733863750879554
14-0.0164142431404756
15-0.0958477295566867
16-0.0536803852733082
170.0127416832596956


Parameters (Session):
par1 = 1 ; par2 = 1 ; par3 = 0 ; par4 = 12 ; par5 = 1 ; par6 = 1 ; par7 = 0 ;
Parameters (R input):
par1 = 1 ; par2 = 1 ; par3 = 0 ; par4 = 12 ; par5 = 1 ; par6 = 1 ; par7 = 0 ;
R code (references can be found in the software module):
par1 <- as.numeric(par1)
par2 <- as.numeric(par2)
par3 <- as.numeric(par3)
par4 <- as.numeric(par4)
par5 <- as.numeric(par5)
par6 <- as.numeric(par6)
par7 <- as.numeric(par7)
if (par1 == 0) {
x <- log(x)
} else {
x <- (x ^ par1 - 1) / par1
}
if (par5 == 0) {
y <- log(y)
} else {
y <- (y ^ par5 - 1) / par5
}
if (par2 > 0) x <- diff(x,lag=1,difference=par2)
if (par6 > 0) y <- diff(y,lag=1,difference=par6)
if (par3 > 0) x <- diff(x,lag=par4,difference=par3)
if (par7 > 0) y <- diff(y,lag=par4,difference=par7)
x
y
bitmap(file='test1.png')
(r <- ccf(x,y,main='Cross Correlation Function',ylab='CCF',xlab='Lag (k)'))
dev.off()
load(file='createtable')
a<-table.start()
a<-table.row.start(a)
a<-table.element(a,'Cross Correlation Function',2,TRUE)
a<-table.row.end(a)
a<-table.row.start(a)
a<-table.element(a,'Parameter',header=TRUE)
a<-table.element(a,'Value',header=TRUE)
a<-table.row.end(a)
a<-table.row.start(a)
a<-table.element(a,'Box-Cox transformation parameter (lambda) of X series',header=TRUE)
a<-table.element(a,par1)
a<-table.row.end(a)
a<-table.row.start(a)
a<-table.element(a,'Degree of non-seasonal differencing (d) of X series',header=TRUE)
a<-table.element(a,par2)
a<-table.row.end(a)
a<-table.row.start(a)
a<-table.element(a,'Degree of seasonal differencing (D) of X series',header=TRUE)
a<-table.element(a,par3)
a<-table.row.end(a)
a<-table.row.start(a)
a<-table.element(a,'Seasonal Period (s)',header=TRUE)
a<-table.element(a,par4)
a<-table.row.end(a)
a<-table.row.start(a)
a<-table.element(a,'Box-Cox transformation parameter (lambda) of Y series',header=TRUE)
a<-table.element(a,par5)
a<-table.row.end(a)
a<-table.row.start(a)
a<-table.element(a,'Degree of non-seasonal differencing (d) of Y series',header=TRUE)
a<-table.element(a,par6)
a<-table.row.end(a)
a<-table.row.start(a)
a<-table.element(a,'Degree of seasonal differencing (D) of Y series',header=TRUE)
a<-table.element(a,par7)
a<-table.row.end(a)
a<-table.row.start(a)
a<-table.element(a,'k',header=TRUE)
a<-table.element(a,'rho(Y[t],X[t+k])',header=TRUE)
a<-table.row.end(a)
mylength <- length(r$acf)
myhalf <- floor((mylength-1)/2)
for (i in 1:mylength) {
a<-table.row.start(a)
a<-table.element(a,i-myhalf-1,header=TRUE)
a<-table.element(a,r$acf[i])
a<-table.row.end(a)
}
a<-table.end(a)
table.save(a,file='mytable.tab')