Free Statistics

of Irreproducible Research!

Author's title

Author*The author of this computation has been verified*
R Software Modulerwasp_cross.wasp
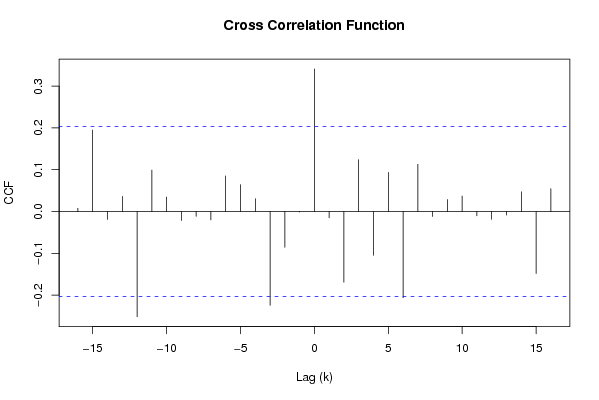
Title produced by softwareCross Correlation Function
Date of computationTue, 02 Dec 2008 07:53:11 -0700
Cite this page as followsStatistical Computations at FreeStatistics.org, Office for Research Development and Education, URL https://freestatistics.org/blog/index.php?v=date/2008/Dec/02/t1228229645l71lkg05r6b96q3.htm/, Retrieved Sat, 25 May 2024 14:07:03 +0000
Statistical Computations at FreeStatistics.org, Office for Research Development and Education, URL https://freestatistics.org/blog/index.php?pk=27898, Retrieved Sat, 25 May 2024 14:07:03 +0000
QR Codes:

Original text written by user:
IsPrivate?No (this computation is public)
User-defined keywords
Estimated Impact187
Family? (F = Feedback message, R = changed R code, M = changed R Module, P = changed Parameters, D = changed Data)
F     [Univariate Data Series] [Airline data] [2007-10-18 09:58:47] [42daae401fd3def69a25014f2252b4c2]
F RMPD    [Cross Correlation Function] [question 8] [2008-12-02 14:53:11] [f7fbcd402030df685d3fe4ce577d7846] [Current]
- RMPD      [Variance Reduction Matrix] [] [2008-12-06 11:57:17] [3ba9e05a140f75dbe22af2042ab9e185]
- RMPD      [Variance Reduction Matrix] [] [2008-12-06 11:59:34] [3ba9e05a140f75dbe22af2042ab9e185]
-   P       [Cross Correlation Function] [] [2008-12-06 12:04:07] [3ba9e05a140f75dbe22af2042ab9e185]
Feedback Forum
2008-12-06 12:06:34 [Glenn Maras] [reply
De student heeft hier d=2 en D=2 voor zowal X en Y. Ik weet niet of dit klopt omdat er niet bijstaat hoe dit bekomen is. Om dit te achterhalen kunnen we best de X en Y tijdreeks invoeren in de VRM, enzo achterhalen welke de beste waarden voor d en D zijn.
Voor X: http://www.freestatistics.org/blog/index.php?v=date/2008/Dec/06/t12285646937we0hzage6fx6yl.htm
Voor Y: http://www.freestatistics.org/blog/index.php?v=date/2008/Dec/06/t12285648301xkm3ecq46z0p3a.htm
Als we deze waarden dan invullen in de crosscorrelatie functie moeten we d=1 en D=1 voor X en hetzelfde voor Y.
2008-12-06 12:09:37 [Glenn Maras] [reply
De waarden voor d en D die de student hier heeft ingegeven kloppen niet. Op het feedbackforum staat de juiste cross correlatie die je bekomt na de waarden van d en D juist in te geven.
Deze ziet er dus anders uit als in Q7, alleen zijn er nog 2uitschieters rond 0.
De nieuwe crosscorrelatie: http://www.freestatistics.org/blog/index.php?v=date/2008/Dec/06/t1228565091px4962l5phuobgy.htm/

Post a new message
Dataseries X:
1.2732
1.3322
1.4369
1.4975
1.5770
1.5553
1.5557
1.5750
1.5527
1.4748
1.4718
1.4570
1.4684
1.4227
1.3896
1.3622
1.3716
1.3419
1.3511
1.3516
1.3242
1.3074
1.2999
1.3213
1.2881
1.2611
1.2727
1.2811
1.2684
1.2650
1.2770
1.2271
1.2020
1.1938
1.2103
1.1856
1.1786
1.2015
1.2256
1.2292
1.2037
1.2165
1.2694
1.2938
1.3201
1.3014
1.3119
1.3408
1.2991
1.2490
1.2218
1.2176
1.2266
1.2138
1.2007
1.1985
1.2262
1.2646
1.2613
1.2286
1.1702
1.1692
1.1222
1.1139
1.1372
1.1663
1.1582
1.0848
1.0807
1.0773
1.0622
1.0183
1.0014
0.9811
0.9808
0.9778
0.9922
0.9554
0.9170
0.8858
0.8758
0.8700
0.8833
0.8924
0.8883
0.9059
0.9111
0.9005
0.8607
0.8532
0.8742
0.8920
0.9095
0.9217
0.9383
0.8973
0.8564
0.8552
0.8721
0.9041
0.9397
0.9492
0.9060
0.9470
0.9643
0.9834
1.0137
1.0110
1.0338
1.0706
1.0501
1.0604
1.0353
1.0378
1.0628
1.0704
1.0883
1.1208
1.1608
Dataseries Y:
123.28
133.52
153.20
163.63
168.45
166.26
162.31
161.56
156.59
157.97
158.68
163.55
162.89
164.95
159.82
159.05
166.76
164.55
163.22
160.68
155.24
157.60
156.56
154.82
151.11
149.65
148.99
148.53
146.70
145.11
142.70
143.59
140.96
140.77
139.81
140.58
139.59
138.05
136.06
135.98
134.75
132.22
135.37
138.84
138.83
136.55
135.63
139.14
136.09
135.97
134.51
134.54
134.08
132.86
134.48
129.08
133.13
134.78
134.13
132.43
127.84
128.12
128.94
132.38
134.99
138.05
135.83
130.12
128.16
128.60
126.12
124.20
121.65
121.57
118.38
116.31
117.11
117.80
115.86
115.81
114.75
116.23
117.12
113.38
108.68
109.86
108.20
109.34
107.21
104.30
106.50
110.36
110.33
107.08
109.57
100.61
93.26
92.74
93.11
97.76
101.39
100.71
98.09
99.92
102.59
107.64
106.53
103.72
108.25
113.52
112.39
120.10
123.71
125.32
129.71
128.16
130.20
130.78
131.35


Summary of computational transaction
Raw Inputview raw input (R code)
Raw Outputview raw output of R engine
Computing time0 seconds
R Server'Gwilym Jenkins' @ 72.249.127.135

\begin{tabular}{lllllllll}
\hline
Summary of computational transaction \tabularnewline
Raw Input & view raw input (R code)  \tabularnewline
Raw Output & view raw output of R engine  \tabularnewline
Computing time & 0 seconds \tabularnewline
R Server & 'Gwilym Jenkins' @ 72.249.127.135 \tabularnewline
\hline
\end{tabular}
%Source: https://freestatistics.org/blog/index.php?pk=27898&T=0

[TABLE]
[ROW][C]Summary of computational transaction[/C][/ROW]
[ROW][C]Raw Input[/C][C]view raw input (R code) [/C][/ROW]
[ROW][C]Raw Output[/C][C]view raw output of R engine [/C][/ROW]
[ROW][C]Computing time[/C][C]0 seconds[/C][/ROW]
[ROW][C]R Server[/C][C]'Gwilym Jenkins' @ 72.249.127.135[/C][/ROW]
[/TABLE]
Source: https://freestatistics.org/blog/index.php?pk=27898&T=0

Globally Unique Identifier (entire table): ba.freestatistics.org/blog/index.php?pk=27898&T=0

As an alternative you can also use a QR Code:  

The GUIDs for individual cells are displayed in the table below:

Summary of computational transaction
Raw Inputview raw input (R code)
Raw Outputview raw output of R engine
Computing time0 seconds
R Server'Gwilym Jenkins' @ 72.249.127.135


Cross Correlation Function
ParameterValue
Box-Cox transformation parameter (lambda) of X series1
Degree of non-seasonal differencing (d) of X series2
Degree of seasonal differencing (D) of X series2
Seasonal Period (s)12
Box-Cox transformation parameter (lambda) of Y series1
Degree of non-seasonal differencing (d) of Y series2
Degree of seasonal differencing (D) of Y series2
krho(Y[t],X[t+k])
-160.00770210296351372
-150.194940753992109
-14-0.0191907933427058
-130.0359703689476823
-12-0.251822298217016
-110.0990317681643233
-100.0344905687996299
-9-0.0216087192257526
-8-0.0116004805425858
-7-0.0202104895132123
-60.0850885089645107
-50.0642349106054009
-40.0306781572725512
-3-0.22474702987158
-2-0.085798432444891
-1-0.0014854944666661
00.341284468752588
1-0.0150646567422097
2-0.169361496488839
30.124163520310539
4-0.105064913753087
50.0935779972696758
6-0.206570521992222
70.112975156289379
8-0.0118146474005703
90.0285622971549137
100.0368705690532949
11-0.0102668599520671
12-0.0187588361171756
13-0.00844767048168016
140.0470719284814468
15-0.148445177985215
160.0546069620857489

\begin{tabular}{lllllllll}
\hline
Cross Correlation Function \tabularnewline
Parameter & Value \tabularnewline
Box-Cox transformation parameter (lambda) of X series & 1 \tabularnewline
Degree of non-seasonal differencing (d) of X series & 2 \tabularnewline
Degree of seasonal differencing (D) of X series & 2 \tabularnewline
Seasonal Period (s) & 12 \tabularnewline
Box-Cox transformation parameter (lambda) of Y series & 1 \tabularnewline
Degree of non-seasonal differencing (d) of Y series & 2 \tabularnewline
Degree of seasonal differencing (D) of Y series & 2 \tabularnewline
k & rho(Y[t],X[t+k]) \tabularnewline
-16 & 0.00770210296351372 \tabularnewline
-15 & 0.194940753992109 \tabularnewline
-14 & -0.0191907933427058 \tabularnewline
-13 & 0.0359703689476823 \tabularnewline
-12 & -0.251822298217016 \tabularnewline
-11 & 0.0990317681643233 \tabularnewline
-10 & 0.0344905687996299 \tabularnewline
-9 & -0.0216087192257526 \tabularnewline
-8 & -0.0116004805425858 \tabularnewline
-7 & -0.0202104895132123 \tabularnewline
-6 & 0.0850885089645107 \tabularnewline
-5 & 0.0642349106054009 \tabularnewline
-4 & 0.0306781572725512 \tabularnewline
-3 & -0.22474702987158 \tabularnewline
-2 & -0.085798432444891 \tabularnewline
-1 & -0.0014854944666661 \tabularnewline
0 & 0.341284468752588 \tabularnewline
1 & -0.0150646567422097 \tabularnewline
2 & -0.169361496488839 \tabularnewline
3 & 0.124163520310539 \tabularnewline
4 & -0.105064913753087 \tabularnewline
5 & 0.0935779972696758 \tabularnewline
6 & -0.206570521992222 \tabularnewline
7 & 0.112975156289379 \tabularnewline
8 & -0.0118146474005703 \tabularnewline
9 & 0.0285622971549137 \tabularnewline
10 & 0.0368705690532949 \tabularnewline
11 & -0.0102668599520671 \tabularnewline
12 & -0.0187588361171756 \tabularnewline
13 & -0.00844767048168016 \tabularnewline
14 & 0.0470719284814468 \tabularnewline
15 & -0.148445177985215 \tabularnewline
16 & 0.0546069620857489 \tabularnewline
\hline
\end{tabular}
%Source: https://freestatistics.org/blog/index.php?pk=27898&T=1

[TABLE]
[ROW][C]Cross Correlation Function[/C][/ROW]
[ROW][C]Parameter[/C][C]Value[/C][/ROW]
[ROW][C]Box-Cox transformation parameter (lambda) of X series[/C][C]1[/C][/ROW]
[ROW][C]Degree of non-seasonal differencing (d) of X series[/C][C]2[/C][/ROW]
[ROW][C]Degree of seasonal differencing (D) of X series[/C][C]2[/C][/ROW]
[ROW][C]Seasonal Period (s)[/C][C]12[/C][/ROW]
[ROW][C]Box-Cox transformation parameter (lambda) of Y series[/C][C]1[/C][/ROW]
[ROW][C]Degree of non-seasonal differencing (d) of Y series[/C][C]2[/C][/ROW]
[ROW][C]Degree of seasonal differencing (D) of Y series[/C][C]2[/C][/ROW]
[ROW][C]k[/C][C]rho(Y[t],X[t+k])[/C][/ROW]
[ROW][C]-16[/C][C]0.00770210296351372[/C][/ROW]
[ROW][C]-15[/C][C]0.194940753992109[/C][/ROW]
[ROW][C]-14[/C][C]-0.0191907933427058[/C][/ROW]
[ROW][C]-13[/C][C]0.0359703689476823[/C][/ROW]
[ROW][C]-12[/C][C]-0.251822298217016[/C][/ROW]
[ROW][C]-11[/C][C]0.0990317681643233[/C][/ROW]
[ROW][C]-10[/C][C]0.0344905687996299[/C][/ROW]
[ROW][C]-9[/C][C]-0.0216087192257526[/C][/ROW]
[ROW][C]-8[/C][C]-0.0116004805425858[/C][/ROW]
[ROW][C]-7[/C][C]-0.0202104895132123[/C][/ROW]
[ROW][C]-6[/C][C]0.0850885089645107[/C][/ROW]
[ROW][C]-5[/C][C]0.0642349106054009[/C][/ROW]
[ROW][C]-4[/C][C]0.0306781572725512[/C][/ROW]
[ROW][C]-3[/C][C]-0.22474702987158[/C][/ROW]
[ROW][C]-2[/C][C]-0.085798432444891[/C][/ROW]
[ROW][C]-1[/C][C]-0.0014854944666661[/C][/ROW]
[ROW][C]0[/C][C]0.341284468752588[/C][/ROW]
[ROW][C]1[/C][C]-0.0150646567422097[/C][/ROW]
[ROW][C]2[/C][C]-0.169361496488839[/C][/ROW]
[ROW][C]3[/C][C]0.124163520310539[/C][/ROW]
[ROW][C]4[/C][C]-0.105064913753087[/C][/ROW]
[ROW][C]5[/C][C]0.0935779972696758[/C][/ROW]
[ROW][C]6[/C][C]-0.206570521992222[/C][/ROW]
[ROW][C]7[/C][C]0.112975156289379[/C][/ROW]
[ROW][C]8[/C][C]-0.0118146474005703[/C][/ROW]
[ROW][C]9[/C][C]0.0285622971549137[/C][/ROW]
[ROW][C]10[/C][C]0.0368705690532949[/C][/ROW]
[ROW][C]11[/C][C]-0.0102668599520671[/C][/ROW]
[ROW][C]12[/C][C]-0.0187588361171756[/C][/ROW]
[ROW][C]13[/C][C]-0.00844767048168016[/C][/ROW]
[ROW][C]14[/C][C]0.0470719284814468[/C][/ROW]
[ROW][C]15[/C][C]-0.148445177985215[/C][/ROW]
[ROW][C]16[/C][C]0.0546069620857489[/C][/ROW]
[/TABLE]
Source: https://freestatistics.org/blog/index.php?pk=27898&T=1

Globally Unique Identifier (entire table): ba.freestatistics.org/blog/index.php?pk=27898&T=1

As an alternative you can also use a QR Code:  

The GUIDs for individual cells are displayed in the table below:

Cross Correlation Function
ParameterValue
Box-Cox transformation parameter (lambda) of X series1
Degree of non-seasonal differencing (d) of X series2
Degree of seasonal differencing (D) of X series2
Seasonal Period (s)12
Box-Cox transformation parameter (lambda) of Y series1
Degree of non-seasonal differencing (d) of Y series2
Degree of seasonal differencing (D) of Y series2
krho(Y[t],X[t+k])
-160.00770210296351372
-150.194940753992109
-14-0.0191907933427058
-130.0359703689476823
-12-0.251822298217016
-110.0990317681643233
-100.0344905687996299
-9-0.0216087192257526
-8-0.0116004805425858
-7-0.0202104895132123
-60.0850885089645107
-50.0642349106054009
-40.0306781572725512
-3-0.22474702987158
-2-0.085798432444891
-1-0.0014854944666661
00.341284468752588
1-0.0150646567422097
2-0.169361496488839
30.124163520310539
4-0.105064913753087
50.0935779972696758
6-0.206570521992222
70.112975156289379
8-0.0118146474005703
90.0285622971549137
100.0368705690532949
11-0.0102668599520671
12-0.0187588361171756
13-0.00844767048168016
140.0470719284814468
15-0.148445177985215
160.0546069620857489


Parameters (Session):
par1 = 1 ; par2 = 2 ; par3 = 2 ; par4 = 12 ; par5 = 1 ; par6 = 2 ; par7 = 2 ;
Parameters (R input):
par1 = 1 ; par2 = 2 ; par3 = 2 ; par4 = 12 ; par5 = 1 ; par6 = 2 ; par7 = 2 ;
R code (references can be found in the software module):
par1 <- as.numeric(par1)
par2 <- as.numeric(par2)
par3 <- as.numeric(par3)
par4 <- as.numeric(par4)
par5 <- as.numeric(par5)
par6 <- as.numeric(par6)
par7 <- as.numeric(par7)
if (par1 == 0) {
x <- log(x)
} else {
x <- (x ^ par1 - 1) / par1
}
if (par5 == 0) {
y <- log(y)
} else {
y <- (y ^ par5 - 1) / par5
}
if (par2 > 0) x <- diff(x,lag=1,difference=par2)
if (par6 > 0) y <- diff(y,lag=1,difference=par6)
if (par3 > 0) x <- diff(x,lag=par4,difference=par3)
if (par7 > 0) y <- diff(y,lag=par4,difference=par7)
x
y
bitmap(file='test1.png')
(r <- ccf(x,y,main='Cross Correlation Function',ylab='CCF',xlab='Lag (k)'))
dev.off()
load(file='createtable')
a<-table.start()
a<-table.row.start(a)
a<-table.element(a,'Cross Correlation Function',2,TRUE)
a<-table.row.end(a)
a<-table.row.start(a)
a<-table.element(a,'Parameter',header=TRUE)
a<-table.element(a,'Value',header=TRUE)
a<-table.row.end(a)
a<-table.row.start(a)
a<-table.element(a,'Box-Cox transformation parameter (lambda) of X series',header=TRUE)
a<-table.element(a,par1)
a<-table.row.end(a)
a<-table.row.start(a)
a<-table.element(a,'Degree of non-seasonal differencing (d) of X series',header=TRUE)
a<-table.element(a,par2)
a<-table.row.end(a)
a<-table.row.start(a)
a<-table.element(a,'Degree of seasonal differencing (D) of X series',header=TRUE)
a<-table.element(a,par3)
a<-table.row.end(a)
a<-table.row.start(a)
a<-table.element(a,'Seasonal Period (s)',header=TRUE)
a<-table.element(a,par4)
a<-table.row.end(a)
a<-table.row.start(a)
a<-table.element(a,'Box-Cox transformation parameter (lambda) of Y series',header=TRUE)
a<-table.element(a,par5)
a<-table.row.end(a)
a<-table.row.start(a)
a<-table.element(a,'Degree of non-seasonal differencing (d) of Y series',header=TRUE)
a<-table.element(a,par6)
a<-table.row.end(a)
a<-table.row.start(a)
a<-table.element(a,'Degree of seasonal differencing (D) of Y series',header=TRUE)
a<-table.element(a,par7)
a<-table.row.end(a)
a<-table.row.start(a)
a<-table.element(a,'k',header=TRUE)
a<-table.element(a,'rho(Y[t],X[t+k])',header=TRUE)
a<-table.row.end(a)
mylength <- length(r$acf)
myhalf <- floor((mylength-1)/2)
for (i in 1:mylength) {
a<-table.row.start(a)
a<-table.element(a,i-myhalf-1,header=TRUE)
a<-table.element(a,r$acf[i])
a<-table.row.end(a)
}
a<-table.end(a)
table.save(a,file='mytable.tab')