Free Statistics

of Irreproducible Research!

Author's title

Author*Unverified author*
R Software Modulerwasp_autocorrelation.wasp
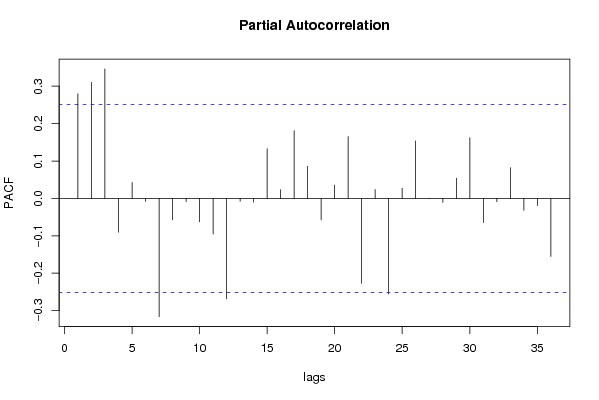
Title produced by software(Partial) Autocorrelation Function
Date of computationWed, 03 Dec 2008 10:38:11 -0700
Cite this page as followsStatistical Computations at FreeStatistics.org, Office for Research Development and Education, URL https://freestatistics.org/blog/index.php?v=date/2008/Dec/03/t1228326256m112hydkkejfd68.htm/, Retrieved Fri, 17 May 2024 14:27:42 +0000
Statistical Computations at FreeStatistics.org, Office for Research Development and Education, URL https://freestatistics.org/blog/index.php?pk=28817, Retrieved Fri, 17 May 2024 14:27:42 +0000
QR Codes:

Original text written by user:
IsPrivate?No (this computation is public)
User-defined keywords
Estimated Impact165
Family? (F = Feedback message, R = changed R code, M = changed R Module, P = changed Parameters, D = changed Data)
-       [(Partial) Autocorrelation Function] [(P)ACF Algemeen i...] [2008-12-03 17:38:11] [d41d8cd98f00b204e9800998ecf8427e] [Current]
F   P     [(Partial) Autocorrelation Function] [(P)ACF Algemeen i...] [2008-12-09 15:27:54] [74be16979710d4c4e7c6647856088456]
Feedback Forum

Post a new message
Dataseries X:
92
95.9
108.8
103.4
102.1
110.1
83.2
82.7
106.8
113.7
102.5
96.6
92.1
95.6
102.3
98.6
98.2
104.5
84
73.8
103.9
106
97.2
102.6
89
93.8
116.7
106.8
98.5
118.7
90
91.9
113.3
113.1
104.1
108.7
96.7
101
116.9
105.8
99
129.4
83
88.9
115.9
104.2
113.4
112.2
100.8
107.3
126.6
102.9
117.9
128.8
87.5
93.8
122.7
126.2
124.6
116.7
115.2
111.1
129.9
113.3
118.5
137.9
103.6
101.7
127.4
137.5
128.3
118.2
117.1


Summary of computational transaction
Raw Inputview raw input (R code)
Raw Outputview raw output of R engine
Computing time2 seconds
R Server'Sir Ronald Aylmer Fisher' @ 193.190.124.24

\begin{tabular}{lllllllll}
\hline
Summary of computational transaction \tabularnewline
Raw Input & view raw input (R code)  \tabularnewline
Raw Output & view raw output of R engine  \tabularnewline
Computing time & 2 seconds \tabularnewline
R Server & 'Sir Ronald Aylmer Fisher' @ 193.190.124.24 \tabularnewline
\hline
\end{tabular}
%Source: https://freestatistics.org/blog/index.php?pk=28817&T=0

[TABLE]
[ROW][C]Summary of computational transaction[/C][/ROW]
[ROW][C]Raw Input[/C][C]view raw input (R code) [/C][/ROW]
[ROW][C]Raw Output[/C][C]view raw output of R engine [/C][/ROW]
[ROW][C]Computing time[/C][C]2 seconds[/C][/ROW]
[ROW][C]R Server[/C][C]'Sir Ronald Aylmer Fisher' @ 193.190.124.24[/C][/ROW]
[/TABLE]
Source: https://freestatistics.org/blog/index.php?pk=28817&T=0

Globally Unique Identifier (entire table): ba.freestatistics.org/blog/index.php?pk=28817&T=0

As an alternative you can also use a QR Code:  

The GUIDs for individual cells are displayed in the table below:

Summary of computational transaction
Raw Inputview raw input (R code)
Raw Outputview raw output of R engine
Computing time2 seconds
R Server'Sir Ronald Aylmer Fisher' @ 193.190.124.24


Autocorrelation Function
Time lag kACF(k)T-STATP-value
10.2800922.18760.016271
20.3640262.84310.003035
30.445543.47980.000466
40.1575351.23040.111638
50.2710112.11670.019188
60.1962761.5330.065228
7-0.111711-0.87250.193181
80.0659780.51530.304101
9-0.04659-0.36390.358604
10-0.174707-1.36450.088711
11-0.111945-0.87430.192686
12-0.362095-2.8280.003164
13-0.241975-1.88990.031764
14-0.215402-1.68230.048807
15-0.243728-1.90360.030843
16-0.205918-1.60830.05647
17-0.088965-0.69480.244897
18-0.110301-0.86150.196174
19-0.025581-0.19980.421153
200.0372420.29090.38607
210.1104320.86250.195896
22-0.024407-0.19060.424725
230.190881.49080.07058
240.0247270.19310.423753
250.1146990.89580.186933
260.2787562.17720.016674
270.0483120.37730.353619
280.1119720.87450.192631
290.1728811.35020.090963
300.0619680.4840.315066
310.0791040.61780.269495
320.0471460.36820.35699
33-0.097915-0.76470.223687
340.0772770.60360.274189
35-0.035129-0.27440.392366
36-0.065894-0.51470.304328

\begin{tabular}{lllllllll}
\hline
Autocorrelation Function \tabularnewline
Time lag k & ACF(k) & T-STAT & P-value \tabularnewline
1 & 0.280092 & 2.1876 & 0.016271 \tabularnewline
2 & 0.364026 & 2.8431 & 0.003035 \tabularnewline
3 & 0.44554 & 3.4798 & 0.000466 \tabularnewline
4 & 0.157535 & 1.2304 & 0.111638 \tabularnewline
5 & 0.271011 & 2.1167 & 0.019188 \tabularnewline
6 & 0.196276 & 1.533 & 0.065228 \tabularnewline
7 & -0.111711 & -0.8725 & 0.193181 \tabularnewline
8 & 0.065978 & 0.5153 & 0.304101 \tabularnewline
9 & -0.04659 & -0.3639 & 0.358604 \tabularnewline
10 & -0.174707 & -1.3645 & 0.088711 \tabularnewline
11 & -0.111945 & -0.8743 & 0.192686 \tabularnewline
12 & -0.362095 & -2.828 & 0.003164 \tabularnewline
13 & -0.241975 & -1.8899 & 0.031764 \tabularnewline
14 & -0.215402 & -1.6823 & 0.048807 \tabularnewline
15 & -0.243728 & -1.9036 & 0.030843 \tabularnewline
16 & -0.205918 & -1.6083 & 0.05647 \tabularnewline
17 & -0.088965 & -0.6948 & 0.244897 \tabularnewline
18 & -0.110301 & -0.8615 & 0.196174 \tabularnewline
19 & -0.025581 & -0.1998 & 0.421153 \tabularnewline
20 & 0.037242 & 0.2909 & 0.38607 \tabularnewline
21 & 0.110432 & 0.8625 & 0.195896 \tabularnewline
22 & -0.024407 & -0.1906 & 0.424725 \tabularnewline
23 & 0.19088 & 1.4908 & 0.07058 \tabularnewline
24 & 0.024727 & 0.1931 & 0.423753 \tabularnewline
25 & 0.114699 & 0.8958 & 0.186933 \tabularnewline
26 & 0.278756 & 2.1772 & 0.016674 \tabularnewline
27 & 0.048312 & 0.3773 & 0.353619 \tabularnewline
28 & 0.111972 & 0.8745 & 0.192631 \tabularnewline
29 & 0.172881 & 1.3502 & 0.090963 \tabularnewline
30 & 0.061968 & 0.484 & 0.315066 \tabularnewline
31 & 0.079104 & 0.6178 & 0.269495 \tabularnewline
32 & 0.047146 & 0.3682 & 0.35699 \tabularnewline
33 & -0.097915 & -0.7647 & 0.223687 \tabularnewline
34 & 0.077277 & 0.6036 & 0.274189 \tabularnewline
35 & -0.035129 & -0.2744 & 0.392366 \tabularnewline
36 & -0.065894 & -0.5147 & 0.304328 \tabularnewline
\hline
\end{tabular}
%Source: https://freestatistics.org/blog/index.php?pk=28817&T=1

[TABLE]
[ROW][C]Autocorrelation Function[/C][/ROW]
[ROW][C]Time lag k[/C][C]ACF(k)[/C][C]T-STAT[/C][C]P-value[/C][/ROW]
[ROW][C]1[/C][C]0.280092[/C][C]2.1876[/C][C]0.016271[/C][/ROW]
[ROW][C]2[/C][C]0.364026[/C][C]2.8431[/C][C]0.003035[/C][/ROW]
[ROW][C]3[/C][C]0.44554[/C][C]3.4798[/C][C]0.000466[/C][/ROW]
[ROW][C]4[/C][C]0.157535[/C][C]1.2304[/C][C]0.111638[/C][/ROW]
[ROW][C]5[/C][C]0.271011[/C][C]2.1167[/C][C]0.019188[/C][/ROW]
[ROW][C]6[/C][C]0.196276[/C][C]1.533[/C][C]0.065228[/C][/ROW]
[ROW][C]7[/C][C]-0.111711[/C][C]-0.8725[/C][C]0.193181[/C][/ROW]
[ROW][C]8[/C][C]0.065978[/C][C]0.5153[/C][C]0.304101[/C][/ROW]
[ROW][C]9[/C][C]-0.04659[/C][C]-0.3639[/C][C]0.358604[/C][/ROW]
[ROW][C]10[/C][C]-0.174707[/C][C]-1.3645[/C][C]0.088711[/C][/ROW]
[ROW][C]11[/C][C]-0.111945[/C][C]-0.8743[/C][C]0.192686[/C][/ROW]
[ROW][C]12[/C][C]-0.362095[/C][C]-2.828[/C][C]0.003164[/C][/ROW]
[ROW][C]13[/C][C]-0.241975[/C][C]-1.8899[/C][C]0.031764[/C][/ROW]
[ROW][C]14[/C][C]-0.215402[/C][C]-1.6823[/C][C]0.048807[/C][/ROW]
[ROW][C]15[/C][C]-0.243728[/C][C]-1.9036[/C][C]0.030843[/C][/ROW]
[ROW][C]16[/C][C]-0.205918[/C][C]-1.6083[/C][C]0.05647[/C][/ROW]
[ROW][C]17[/C][C]-0.088965[/C][C]-0.6948[/C][C]0.244897[/C][/ROW]
[ROW][C]18[/C][C]-0.110301[/C][C]-0.8615[/C][C]0.196174[/C][/ROW]
[ROW][C]19[/C][C]-0.025581[/C][C]-0.1998[/C][C]0.421153[/C][/ROW]
[ROW][C]20[/C][C]0.037242[/C][C]0.2909[/C][C]0.38607[/C][/ROW]
[ROW][C]21[/C][C]0.110432[/C][C]0.8625[/C][C]0.195896[/C][/ROW]
[ROW][C]22[/C][C]-0.024407[/C][C]-0.1906[/C][C]0.424725[/C][/ROW]
[ROW][C]23[/C][C]0.19088[/C][C]1.4908[/C][C]0.07058[/C][/ROW]
[ROW][C]24[/C][C]0.024727[/C][C]0.1931[/C][C]0.423753[/C][/ROW]
[ROW][C]25[/C][C]0.114699[/C][C]0.8958[/C][C]0.186933[/C][/ROW]
[ROW][C]26[/C][C]0.278756[/C][C]2.1772[/C][C]0.016674[/C][/ROW]
[ROW][C]27[/C][C]0.048312[/C][C]0.3773[/C][C]0.353619[/C][/ROW]
[ROW][C]28[/C][C]0.111972[/C][C]0.8745[/C][C]0.192631[/C][/ROW]
[ROW][C]29[/C][C]0.172881[/C][C]1.3502[/C][C]0.090963[/C][/ROW]
[ROW][C]30[/C][C]0.061968[/C][C]0.484[/C][C]0.315066[/C][/ROW]
[ROW][C]31[/C][C]0.079104[/C][C]0.6178[/C][C]0.269495[/C][/ROW]
[ROW][C]32[/C][C]0.047146[/C][C]0.3682[/C][C]0.35699[/C][/ROW]
[ROW][C]33[/C][C]-0.097915[/C][C]-0.7647[/C][C]0.223687[/C][/ROW]
[ROW][C]34[/C][C]0.077277[/C][C]0.6036[/C][C]0.274189[/C][/ROW]
[ROW][C]35[/C][C]-0.035129[/C][C]-0.2744[/C][C]0.392366[/C][/ROW]
[ROW][C]36[/C][C]-0.065894[/C][C]-0.5147[/C][C]0.304328[/C][/ROW]
[/TABLE]
Source: https://freestatistics.org/blog/index.php?pk=28817&T=1

Globally Unique Identifier (entire table): ba.freestatistics.org/blog/index.php?pk=28817&T=1

As an alternative you can also use a QR Code:  

The GUIDs for individual cells are displayed in the table below:

Autocorrelation Function
Time lag kACF(k)T-STATP-value
10.2800922.18760.016271
20.3640262.84310.003035
30.445543.47980.000466
40.1575351.23040.111638
50.2710112.11670.019188
60.1962761.5330.065228
7-0.111711-0.87250.193181
80.0659780.51530.304101
9-0.04659-0.36390.358604
10-0.174707-1.36450.088711
11-0.111945-0.87430.192686
12-0.362095-2.8280.003164
13-0.241975-1.88990.031764
14-0.215402-1.68230.048807
15-0.243728-1.90360.030843
16-0.205918-1.60830.05647
17-0.088965-0.69480.244897
18-0.110301-0.86150.196174
19-0.025581-0.19980.421153
200.0372420.29090.38607
210.1104320.86250.195896
22-0.024407-0.19060.424725
230.190881.49080.07058
240.0247270.19310.423753
250.1146990.89580.186933
260.2787562.17720.016674
270.0483120.37730.353619
280.1119720.87450.192631
290.1728811.35020.090963
300.0619680.4840.315066
310.0791040.61780.269495
320.0471460.36820.35699
33-0.097915-0.76470.223687
340.0772770.60360.274189
35-0.035129-0.27440.392366
36-0.065894-0.51470.304328


Partial Autocorrelation Function
Time lag kPACF(k)T-STATP-value
10.2800922.18760.016271
20.3098852.42030.009251
30.3461712.70370.004437
4-0.090285-0.70520.2417
50.0425640.33240.370351
6-0.008012-0.06260.475154
7-0.316185-2.46950.008173
8-0.057309-0.44760.328015
9-0.008187-0.06390.474613
10-0.062471-0.48790.313679
11-0.094888-0.74110.230739
12-0.268344-2.09580.020127
13-0.007663-0.05980.476236
14-0.00947-0.0740.470641
150.1328971.0380.151693
160.0231820.18110.42846
170.1808341.41240.081463
180.0856760.66910.252963
19-0.057378-0.44810.327822
200.0353940.27640.391574
210.1653321.29130.100739
22-0.227296-1.77520.040424
230.0235230.18370.427421
24-0.255875-1.99850.025065
250.0273920.21390.415656
260.1537561.20090.117222
270.0007520.00590.497667
28-0.010282-0.08030.468129
290.0538170.42030.337863
300.1624711.26890.104642
31-0.064579-0.50440.307908
32-0.008931-0.06980.472309
330.0821970.6420.261647
34-0.031528-0.24620.403161
35-0.018819-0.1470.441815
36-0.155153-1.21180.115134

\begin{tabular}{lllllllll}
\hline
Partial Autocorrelation Function \tabularnewline
Time lag k & PACF(k) & T-STAT & P-value \tabularnewline
1 & 0.280092 & 2.1876 & 0.016271 \tabularnewline
2 & 0.309885 & 2.4203 & 0.009251 \tabularnewline
3 & 0.346171 & 2.7037 & 0.004437 \tabularnewline
4 & -0.090285 & -0.7052 & 0.2417 \tabularnewline
5 & 0.042564 & 0.3324 & 0.370351 \tabularnewline
6 & -0.008012 & -0.0626 & 0.475154 \tabularnewline
7 & -0.316185 & -2.4695 & 0.008173 \tabularnewline
8 & -0.057309 & -0.4476 & 0.328015 \tabularnewline
9 & -0.008187 & -0.0639 & 0.474613 \tabularnewline
10 & -0.062471 & -0.4879 & 0.313679 \tabularnewline
11 & -0.094888 & -0.7411 & 0.230739 \tabularnewline
12 & -0.268344 & -2.0958 & 0.020127 \tabularnewline
13 & -0.007663 & -0.0598 & 0.476236 \tabularnewline
14 & -0.00947 & -0.074 & 0.470641 \tabularnewline
15 & 0.132897 & 1.038 & 0.151693 \tabularnewline
16 & 0.023182 & 0.1811 & 0.42846 \tabularnewline
17 & 0.180834 & 1.4124 & 0.081463 \tabularnewline
18 & 0.085676 & 0.6691 & 0.252963 \tabularnewline
19 & -0.057378 & -0.4481 & 0.327822 \tabularnewline
20 & 0.035394 & 0.2764 & 0.391574 \tabularnewline
21 & 0.165332 & 1.2913 & 0.100739 \tabularnewline
22 & -0.227296 & -1.7752 & 0.040424 \tabularnewline
23 & 0.023523 & 0.1837 & 0.427421 \tabularnewline
24 & -0.255875 & -1.9985 & 0.025065 \tabularnewline
25 & 0.027392 & 0.2139 & 0.415656 \tabularnewline
26 & 0.153756 & 1.2009 & 0.117222 \tabularnewline
27 & 0.000752 & 0.0059 & 0.497667 \tabularnewline
28 & -0.010282 & -0.0803 & 0.468129 \tabularnewline
29 & 0.053817 & 0.4203 & 0.337863 \tabularnewline
30 & 0.162471 & 1.2689 & 0.104642 \tabularnewline
31 & -0.064579 & -0.5044 & 0.307908 \tabularnewline
32 & -0.008931 & -0.0698 & 0.472309 \tabularnewline
33 & 0.082197 & 0.642 & 0.261647 \tabularnewline
34 & -0.031528 & -0.2462 & 0.403161 \tabularnewline
35 & -0.018819 & -0.147 & 0.441815 \tabularnewline
36 & -0.155153 & -1.2118 & 0.115134 \tabularnewline
\hline
\end{tabular}
%Source: https://freestatistics.org/blog/index.php?pk=28817&T=2

[TABLE]
[ROW][C]Partial Autocorrelation Function[/C][/ROW]
[ROW][C]Time lag k[/C][C]PACF(k)[/C][C]T-STAT[/C][C]P-value[/C][/ROW]
[ROW][C]1[/C][C]0.280092[/C][C]2.1876[/C][C]0.016271[/C][/ROW]
[ROW][C]2[/C][C]0.309885[/C][C]2.4203[/C][C]0.009251[/C][/ROW]
[ROW][C]3[/C][C]0.346171[/C][C]2.7037[/C][C]0.004437[/C][/ROW]
[ROW][C]4[/C][C]-0.090285[/C][C]-0.7052[/C][C]0.2417[/C][/ROW]
[ROW][C]5[/C][C]0.042564[/C][C]0.3324[/C][C]0.370351[/C][/ROW]
[ROW][C]6[/C][C]-0.008012[/C][C]-0.0626[/C][C]0.475154[/C][/ROW]
[ROW][C]7[/C][C]-0.316185[/C][C]-2.4695[/C][C]0.008173[/C][/ROW]
[ROW][C]8[/C][C]-0.057309[/C][C]-0.4476[/C][C]0.328015[/C][/ROW]
[ROW][C]9[/C][C]-0.008187[/C][C]-0.0639[/C][C]0.474613[/C][/ROW]
[ROW][C]10[/C][C]-0.062471[/C][C]-0.4879[/C][C]0.313679[/C][/ROW]
[ROW][C]11[/C][C]-0.094888[/C][C]-0.7411[/C][C]0.230739[/C][/ROW]
[ROW][C]12[/C][C]-0.268344[/C][C]-2.0958[/C][C]0.020127[/C][/ROW]
[ROW][C]13[/C][C]-0.007663[/C][C]-0.0598[/C][C]0.476236[/C][/ROW]
[ROW][C]14[/C][C]-0.00947[/C][C]-0.074[/C][C]0.470641[/C][/ROW]
[ROW][C]15[/C][C]0.132897[/C][C]1.038[/C][C]0.151693[/C][/ROW]
[ROW][C]16[/C][C]0.023182[/C][C]0.1811[/C][C]0.42846[/C][/ROW]
[ROW][C]17[/C][C]0.180834[/C][C]1.4124[/C][C]0.081463[/C][/ROW]
[ROW][C]18[/C][C]0.085676[/C][C]0.6691[/C][C]0.252963[/C][/ROW]
[ROW][C]19[/C][C]-0.057378[/C][C]-0.4481[/C][C]0.327822[/C][/ROW]
[ROW][C]20[/C][C]0.035394[/C][C]0.2764[/C][C]0.391574[/C][/ROW]
[ROW][C]21[/C][C]0.165332[/C][C]1.2913[/C][C]0.100739[/C][/ROW]
[ROW][C]22[/C][C]-0.227296[/C][C]-1.7752[/C][C]0.040424[/C][/ROW]
[ROW][C]23[/C][C]0.023523[/C][C]0.1837[/C][C]0.427421[/C][/ROW]
[ROW][C]24[/C][C]-0.255875[/C][C]-1.9985[/C][C]0.025065[/C][/ROW]
[ROW][C]25[/C][C]0.027392[/C][C]0.2139[/C][C]0.415656[/C][/ROW]
[ROW][C]26[/C][C]0.153756[/C][C]1.2009[/C][C]0.117222[/C][/ROW]
[ROW][C]27[/C][C]0.000752[/C][C]0.0059[/C][C]0.497667[/C][/ROW]
[ROW][C]28[/C][C]-0.010282[/C][C]-0.0803[/C][C]0.468129[/C][/ROW]
[ROW][C]29[/C][C]0.053817[/C][C]0.4203[/C][C]0.337863[/C][/ROW]
[ROW][C]30[/C][C]0.162471[/C][C]1.2689[/C][C]0.104642[/C][/ROW]
[ROW][C]31[/C][C]-0.064579[/C][C]-0.5044[/C][C]0.307908[/C][/ROW]
[ROW][C]32[/C][C]-0.008931[/C][C]-0.0698[/C][C]0.472309[/C][/ROW]
[ROW][C]33[/C][C]0.082197[/C][C]0.642[/C][C]0.261647[/C][/ROW]
[ROW][C]34[/C][C]-0.031528[/C][C]-0.2462[/C][C]0.403161[/C][/ROW]
[ROW][C]35[/C][C]-0.018819[/C][C]-0.147[/C][C]0.441815[/C][/ROW]
[ROW][C]36[/C][C]-0.155153[/C][C]-1.2118[/C][C]0.115134[/C][/ROW]
[/TABLE]
Source: https://freestatistics.org/blog/index.php?pk=28817&T=2

Globally Unique Identifier (entire table): ba.freestatistics.org/blog/index.php?pk=28817&T=2

As an alternative you can also use a QR Code:  

The GUIDs for individual cells are displayed in the table below:

Partial Autocorrelation Function
Time lag kPACF(k)T-STATP-value
10.2800922.18760.016271
20.3098852.42030.009251
30.3461712.70370.004437
4-0.090285-0.70520.2417
50.0425640.33240.370351
6-0.008012-0.06260.475154
7-0.316185-2.46950.008173
8-0.057309-0.44760.328015
9-0.008187-0.06390.474613
10-0.062471-0.48790.313679
11-0.094888-0.74110.230739
12-0.268344-2.09580.020127
13-0.007663-0.05980.476236
14-0.00947-0.0740.470641
150.1328971.0380.151693
160.0231820.18110.42846
170.1808341.41240.081463
180.0856760.66910.252963
19-0.057378-0.44810.327822
200.0353940.27640.391574
210.1653321.29130.100739
22-0.227296-1.77520.040424
230.0235230.18370.427421
24-0.255875-1.99850.025065
250.0273920.21390.415656
260.1537561.20090.117222
270.0007520.00590.497667
28-0.010282-0.08030.468129
290.0538170.42030.337863
300.1624711.26890.104642
31-0.064579-0.50440.307908
32-0.008931-0.06980.472309
330.0821970.6420.261647
34-0.031528-0.24620.403161
35-0.018819-0.1470.441815
36-0.155153-1.21180.115134


Parameters (Session):
par1 = 36 ; par2 = -0.4 ; par3 = 0 ; par4 = 1 ; par5 = 12 ;
Parameters (R input):
par1 = 36 ; par2 = -0.4 ; par3 = 0 ; par4 = 1 ; par5 = 12 ;
R code (references can be found in the software module):
if (par1 == 'Default') {
par1 = 10*log10(length(x))
} else {
par1 <- as.numeric(par1)
}
par2 <- as.numeric(par2)
par3 <- as.numeric(par3)
par4 <- as.numeric(par4)
par5 <- as.numeric(par5)
if (par2 == 0) {
x <- log(x)
} else {
x <- (x ^ par2 - 1) / par2
}
if (par3 > 0) x <- diff(x,lag=1,difference=par3)
if (par4 > 0) x <- diff(x,lag=par5,difference=par4)
bitmap(file='pic1.png')
racf <- acf(x,par1,main='Autocorrelation',xlab='lags',ylab='ACF')
dev.off()
bitmap(file='pic2.png')
rpacf <- pacf(x,par1,main='Partial Autocorrelation',xlab='lags',ylab='PACF')
dev.off()
(myacf <- c(racf$acf))
(mypacf <- c(rpacf$acf))
lengthx <- length(x)
sqrtn <- sqrt(lengthx)
load(file='createtable')
a<-table.start()
a<-table.row.start(a)
a<-table.element(a,'Autocorrelation Function',4,TRUE)
a<-table.row.end(a)
a<-table.row.start(a)
a<-table.element(a,'Time lag k',header=TRUE)
a<-table.element(a,hyperlink('basics.htm','ACF(k)','click here for more information about the Autocorrelation Function'),header=TRUE)
a<-table.element(a,'T-STAT',header=TRUE)
a<-table.element(a,'P-value',header=TRUE)
a<-table.row.end(a)
for (i in 2:(par1+1)) {
a<-table.row.start(a)
a<-table.element(a,i-1,header=TRUE)
a<-table.element(a,round(myacf[i],6))
mytstat <- myacf[i]*sqrtn
a<-table.element(a,round(mytstat,4))
a<-table.element(a,round(1-pt(abs(mytstat),lengthx),6))
a<-table.row.end(a)
}
a<-table.end(a)
table.save(a,file='mytable.tab')
a<-table.start()
a<-table.row.start(a)
a<-table.element(a,'Partial Autocorrelation Function',4,TRUE)
a<-table.row.end(a)
a<-table.row.start(a)
a<-table.element(a,'Time lag k',header=TRUE)
a<-table.element(a,hyperlink('basics.htm','PACF(k)','click here for more information about the Partial Autocorrelation Function'),header=TRUE)
a<-table.element(a,'T-STAT',header=TRUE)
a<-table.element(a,'P-value',header=TRUE)
a<-table.row.end(a)
for (i in 1:par1) {
a<-table.row.start(a)
a<-table.element(a,i,header=TRUE)
a<-table.element(a,round(mypacf[i],6))
mytstat <- mypacf[i]*sqrtn
a<-table.element(a,round(mytstat,4))
a<-table.element(a,round(1-pt(abs(mytstat),lengthx),6))
a<-table.row.end(a)
}
a<-table.end(a)
table.save(a,file='mytable1.tab')