Free Statistics

of Irreproducible Research!

Author's title

Author*Unverified author*
R Software Modulerwasp_autocorrelation.wasp
Title produced by software(Partial) Autocorrelation Function
Date of computationTue, 09 Dec 2008 08:27:54 -0700
Cite this page as followsStatistical Computations at FreeStatistics.org, Office for Research Development and Education, URL https://freestatistics.org/blog/index.php?v=date/2008/Dec/09/t1228836586r0utvno6a9ncjx5.htm/, Retrieved Sat, 25 May 2024 05:17:01 +0000
Statistical Computations at FreeStatistics.org, Office for Research Development and Education, URL https://freestatistics.org/blog/index.php?pk=31516, Retrieved Sat, 25 May 2024 05:17:01 +0000
QR Codes:

Original text written by user:
IsPrivate?No (this computation is public)
User-defined keywords
Estimated Impact149
Family? (F = Feedback message, R = changed R code, M = changed R Module, P = changed Parameters, D = changed Data)
-     [(Partial) Autocorrelation Function] [(P)ACF Algemeen i...] [2008-12-03 17:38:11] [74be16979710d4c4e7c6647856088456]
F   P     [(Partial) Autocorrelation Function] [(P)ACF Algemeen i...] [2008-12-09 15:27:54] [d41d8cd98f00b204e9800998ecf8427e] [Current]
Feedback Forum
2008-12-13 11:50:20 [Maarten Van Gucht] [reply
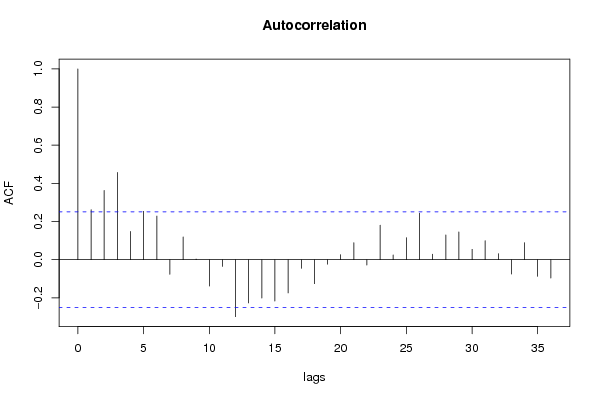
zoals de student ook heeft vermeld is, doordat de student de tijdreeks heeft gedifferentieerd met d= 0, D = 1 en lambda =1 kan je nu zien dat de meeste lijnen zich binnen het betrouwbaarheidsinterval bevinden. De seizoenaliteit is weggewerkt en de student heeft een goede conclusie weergegeven, namelijk de tijdreeks is nu stationair.
2008-12-13 12:31:21 [Maarten Van Gucht] [reply
de stappen die je moet overlopen voor het analyseren van een AR proces zijn de volgende:
- Is er een lange termijn trend?
We kijken hiervoor enkel naar ongeveer de vijf eerste lijntjes bij de ACF. De eerste drie vertonen gelijkenissen met de ACF van het AR proces. er is namelijk een dalend patroon te herkennen in de eerste 3 lijntjes en ze zijn alle 3 significant positief.
Welke orde?
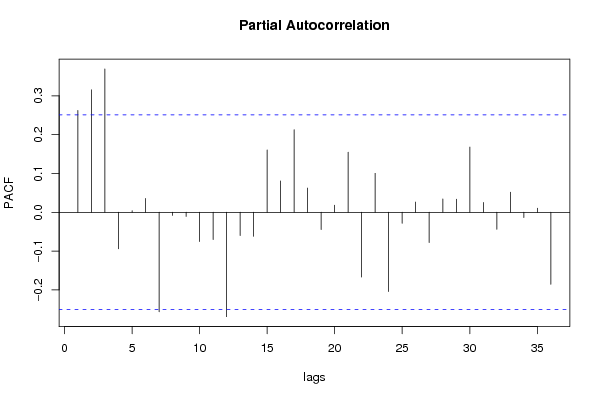
Hiervoor kijken we naar PACF, je ziet dat er 3 streepjes significant zijn. p moet dus gelijk zijn aan 3 er is hier dus sprake van een AR(3) proces

- Is er een seizoenaal patroon?
We kijken hiervoor naar lag 12,24,36,48.. je ziet hier een afwisselend patroon. de ene keer negatief, de andere keer postief. en omdat de lag 12 in de PACF buiten het betrouwbaarheidsinterval ligt hebben we hier te maken met een SAR (1)
P=1

de conclusie is een AR(3) proces en een SAR(1) prcoes. dit heeft de student ook bekomen en heeft dus de opdracht tot een goed einde gebracht.

dezelfde stappen doen we ook met het analyseren van een MA proces.
- Is er een niet- seizoenaal patroon/ lange termijn trend? we moeten zien naar de eerste 5 lijntjes van de PACF. maar deze vertonen geen gelijkenis met een MA proces.
Je ziet geen MA- process.  q = 0.
- Seizoenaal patroon?
Komt overeen met PACF grafiek. je ziet in de PACF een seizoenaal patroon, want op de lag 12, 24,36 zie je een dalend patroon van streepjes die groter zijn dan de andere, wat wijst op seizoenaliteit. Welke orde? Kijken naar ACF en de lijntjes (die op 12,24,26.. ) tellen die buiten het betrouwbaarheidsinterval liggen. dat is er 1, namelijk lag 12 dus Q=1
er is dus een SMA(1) proces zoals de student ook vermeld in zijn antwoord.

de student heeft deze opdracht goed begrepen en tot een goed einde gebracht. goede antwoorden zijn weergegeven

Post a new message
Dataseries X:
92
95.9
108.8
103.4
102.1
110.1
83.2
82.7
106.8
113.7
102.5
96.6
92.1
95.6
102.3
98.6
98.2
104.5
84
73.8
103.9
106
97.2
102.6
89
93.8
116.7
106.8
98.5
118.7
90
91.9
113.3
113.1
104.1
108.7
96.7
101
116.9
105.8
99
129.4
83
88.9
115.9
104.2
113.4
112.2
100.8
107.3
126.6
102.9
117.9
128.8
87.5
93.8
122.7
126.2
124.6
116.7
115.2
111.1
129.9
113.3
118.5
137.9
103.6
101.7
127.4
137.5
128.3
118.2
117.1


Summary of computational transaction
Raw Inputview raw input (R code)
Raw Outputview raw output of R engine
Computing time2 seconds
R Server'Sir Ronald Aylmer Fisher' @ 193.190.124.24

\begin{tabular}{lllllllll}
\hline
Summary of computational transaction \tabularnewline
Raw Input & view raw input (R code)  \tabularnewline
Raw Output & view raw output of R engine  \tabularnewline
Computing time & 2 seconds \tabularnewline
R Server & 'Sir Ronald Aylmer Fisher' @ 193.190.124.24 \tabularnewline
\hline
\end{tabular}
%Source: https://freestatistics.org/blog/index.php?pk=31516&T=0

[TABLE]
[ROW][C]Summary of computational transaction[/C][/ROW]
[ROW][C]Raw Input[/C][C]view raw input (R code) [/C][/ROW]
[ROW][C]Raw Output[/C][C]view raw output of R engine [/C][/ROW]
[ROW][C]Computing time[/C][C]2 seconds[/C][/ROW]
[ROW][C]R Server[/C][C]'Sir Ronald Aylmer Fisher' @ 193.190.124.24[/C][/ROW]
[/TABLE]
Source: https://freestatistics.org/blog/index.php?pk=31516&T=0

Globally Unique Identifier (entire table): ba.freestatistics.org/blog/index.php?pk=31516&T=0

As an alternative you can also use a QR Code:  

The GUIDs for individual cells are displayed in the table below:

Summary of computational transaction
Raw Inputview raw input (R code)
Raw Outputview raw output of R engine
Computing time2 seconds
R Server'Sir Ronald Aylmer Fisher' @ 193.190.124.24


Autocorrelation Function
Time lag kACF(k)T-STATP-value
10.2621412.04740.022467
20.3623352.82990.003147
30.4572753.57140.00035
40.1478271.15460.126385
50.2533031.97840.026204
60.2284811.78450.039658
7-0.076432-0.5970.276373
80.1192950.93170.177576
90.0029220.02280.490935
10-0.13819-1.07930.142352
11-0.035582-0.27790.391011
12-0.299-2.33530.011418
13-0.226853-1.77180.040713
14-0.201416-1.57310.060434
15-0.217057-1.69530.047562
16-0.174561-1.36340.088889
17-0.045362-0.35430.362173
18-0.125994-0.9840.16449
19-0.023743-0.18540.426751
200.0255660.19970.4212
210.0887570.69320.245403
22-0.028556-0.2230.412128
230.1803131.40830.082061
240.0248570.19410.423356
250.114970.89790.186373
260.2438681.90470.03077
270.0281840.22010.413256
280.1298291.0140.157295
290.1447351.13040.131362
300.0539120.42110.337594
310.0988360.77190.221566
320.0310450.24250.404616
33-0.075119-0.58670.279785
340.0884390.69070.246178
35-0.0877-0.6850.247982
36-0.095983-0.74960.228174

\begin{tabular}{lllllllll}
\hline
Autocorrelation Function \tabularnewline
Time lag k & ACF(k) & T-STAT & P-value \tabularnewline
1 & 0.262141 & 2.0474 & 0.022467 \tabularnewline
2 & 0.362335 & 2.8299 & 0.003147 \tabularnewline
3 & 0.457275 & 3.5714 & 0.00035 \tabularnewline
4 & 0.147827 & 1.1546 & 0.126385 \tabularnewline
5 & 0.253303 & 1.9784 & 0.026204 \tabularnewline
6 & 0.228481 & 1.7845 & 0.039658 \tabularnewline
7 & -0.076432 & -0.597 & 0.276373 \tabularnewline
8 & 0.119295 & 0.9317 & 0.177576 \tabularnewline
9 & 0.002922 & 0.0228 & 0.490935 \tabularnewline
10 & -0.13819 & -1.0793 & 0.142352 \tabularnewline
11 & -0.035582 & -0.2779 & 0.391011 \tabularnewline
12 & -0.299 & -2.3353 & 0.011418 \tabularnewline
13 & -0.226853 & -1.7718 & 0.040713 \tabularnewline
14 & -0.201416 & -1.5731 & 0.060434 \tabularnewline
15 & -0.217057 & -1.6953 & 0.047562 \tabularnewline
16 & -0.174561 & -1.3634 & 0.088889 \tabularnewline
17 & -0.045362 & -0.3543 & 0.362173 \tabularnewline
18 & -0.125994 & -0.984 & 0.16449 \tabularnewline
19 & -0.023743 & -0.1854 & 0.426751 \tabularnewline
20 & 0.025566 & 0.1997 & 0.4212 \tabularnewline
21 & 0.088757 & 0.6932 & 0.245403 \tabularnewline
22 & -0.028556 & -0.223 & 0.412128 \tabularnewline
23 & 0.180313 & 1.4083 & 0.082061 \tabularnewline
24 & 0.024857 & 0.1941 & 0.423356 \tabularnewline
25 & 0.11497 & 0.8979 & 0.186373 \tabularnewline
26 & 0.243868 & 1.9047 & 0.03077 \tabularnewline
27 & 0.028184 & 0.2201 & 0.413256 \tabularnewline
28 & 0.129829 & 1.014 & 0.157295 \tabularnewline
29 & 0.144735 & 1.1304 & 0.131362 \tabularnewline
30 & 0.053912 & 0.4211 & 0.337594 \tabularnewline
31 & 0.098836 & 0.7719 & 0.221566 \tabularnewline
32 & 0.031045 & 0.2425 & 0.404616 \tabularnewline
33 & -0.075119 & -0.5867 & 0.279785 \tabularnewline
34 & 0.088439 & 0.6907 & 0.246178 \tabularnewline
35 & -0.0877 & -0.685 & 0.247982 \tabularnewline
36 & -0.095983 & -0.7496 & 0.228174 \tabularnewline
\hline
\end{tabular}
%Source: https://freestatistics.org/blog/index.php?pk=31516&T=1

[TABLE]
[ROW][C]Autocorrelation Function[/C][/ROW]
[ROW][C]Time lag k[/C][C]ACF(k)[/C][C]T-STAT[/C][C]P-value[/C][/ROW]
[ROW][C]1[/C][C]0.262141[/C][C]2.0474[/C][C]0.022467[/C][/ROW]
[ROW][C]2[/C][C]0.362335[/C][C]2.8299[/C][C]0.003147[/C][/ROW]
[ROW][C]3[/C][C]0.457275[/C][C]3.5714[/C][C]0.00035[/C][/ROW]
[ROW][C]4[/C][C]0.147827[/C][C]1.1546[/C][C]0.126385[/C][/ROW]
[ROW][C]5[/C][C]0.253303[/C][C]1.9784[/C][C]0.026204[/C][/ROW]
[ROW][C]6[/C][C]0.228481[/C][C]1.7845[/C][C]0.039658[/C][/ROW]
[ROW][C]7[/C][C]-0.076432[/C][C]-0.597[/C][C]0.276373[/C][/ROW]
[ROW][C]8[/C][C]0.119295[/C][C]0.9317[/C][C]0.177576[/C][/ROW]
[ROW][C]9[/C][C]0.002922[/C][C]0.0228[/C][C]0.490935[/C][/ROW]
[ROW][C]10[/C][C]-0.13819[/C][C]-1.0793[/C][C]0.142352[/C][/ROW]
[ROW][C]11[/C][C]-0.035582[/C][C]-0.2779[/C][C]0.391011[/C][/ROW]
[ROW][C]12[/C][C]-0.299[/C][C]-2.3353[/C][C]0.011418[/C][/ROW]
[ROW][C]13[/C][C]-0.226853[/C][C]-1.7718[/C][C]0.040713[/C][/ROW]
[ROW][C]14[/C][C]-0.201416[/C][C]-1.5731[/C][C]0.060434[/C][/ROW]
[ROW][C]15[/C][C]-0.217057[/C][C]-1.6953[/C][C]0.047562[/C][/ROW]
[ROW][C]16[/C][C]-0.174561[/C][C]-1.3634[/C][C]0.088889[/C][/ROW]
[ROW][C]17[/C][C]-0.045362[/C][C]-0.3543[/C][C]0.362173[/C][/ROW]
[ROW][C]18[/C][C]-0.125994[/C][C]-0.984[/C][C]0.16449[/C][/ROW]
[ROW][C]19[/C][C]-0.023743[/C][C]-0.1854[/C][C]0.426751[/C][/ROW]
[ROW][C]20[/C][C]0.025566[/C][C]0.1997[/C][C]0.4212[/C][/ROW]
[ROW][C]21[/C][C]0.088757[/C][C]0.6932[/C][C]0.245403[/C][/ROW]
[ROW][C]22[/C][C]-0.028556[/C][C]-0.223[/C][C]0.412128[/C][/ROW]
[ROW][C]23[/C][C]0.180313[/C][C]1.4083[/C][C]0.082061[/C][/ROW]
[ROW][C]24[/C][C]0.024857[/C][C]0.1941[/C][C]0.423356[/C][/ROW]
[ROW][C]25[/C][C]0.11497[/C][C]0.8979[/C][C]0.186373[/C][/ROW]
[ROW][C]26[/C][C]0.243868[/C][C]1.9047[/C][C]0.03077[/C][/ROW]
[ROW][C]27[/C][C]0.028184[/C][C]0.2201[/C][C]0.413256[/C][/ROW]
[ROW][C]28[/C][C]0.129829[/C][C]1.014[/C][C]0.157295[/C][/ROW]
[ROW][C]29[/C][C]0.144735[/C][C]1.1304[/C][C]0.131362[/C][/ROW]
[ROW][C]30[/C][C]0.053912[/C][C]0.4211[/C][C]0.337594[/C][/ROW]
[ROW][C]31[/C][C]0.098836[/C][C]0.7719[/C][C]0.221566[/C][/ROW]
[ROW][C]32[/C][C]0.031045[/C][C]0.2425[/C][C]0.404616[/C][/ROW]
[ROW][C]33[/C][C]-0.075119[/C][C]-0.5867[/C][C]0.279785[/C][/ROW]
[ROW][C]34[/C][C]0.088439[/C][C]0.6907[/C][C]0.246178[/C][/ROW]
[ROW][C]35[/C][C]-0.0877[/C][C]-0.685[/C][C]0.247982[/C][/ROW]
[ROW][C]36[/C][C]-0.095983[/C][C]-0.7496[/C][C]0.228174[/C][/ROW]
[/TABLE]
Source: https://freestatistics.org/blog/index.php?pk=31516&T=1

Globally Unique Identifier (entire table): ba.freestatistics.org/blog/index.php?pk=31516&T=1

As an alternative you can also use a QR Code:  

The GUIDs for individual cells are displayed in the table below:

Autocorrelation Function
Time lag kACF(k)T-STATP-value
10.2621412.04740.022467
20.3623352.82990.003147
30.4572753.57140.00035
40.1478271.15460.126385
50.2533031.97840.026204
60.2284811.78450.039658
7-0.076432-0.5970.276373
80.1192950.93170.177576
90.0029220.02280.490935
10-0.13819-1.07930.142352
11-0.035582-0.27790.391011
12-0.299-2.33530.011418
13-0.226853-1.77180.040713
14-0.201416-1.57310.060434
15-0.217057-1.69530.047562
16-0.174561-1.36340.088889
17-0.045362-0.35430.362173
18-0.125994-0.9840.16449
19-0.023743-0.18540.426751
200.0255660.19970.4212
210.0887570.69320.245403
22-0.028556-0.2230.412128
230.1803131.40830.082061
240.0248570.19410.423356
250.114970.89790.186373
260.2438681.90470.03077
270.0281840.22010.413256
280.1298291.0140.157295
290.1447351.13040.131362
300.0539120.42110.337594
310.0988360.77190.221566
320.0310450.24250.404616
33-0.075119-0.58670.279785
340.0884390.69070.246178
35-0.0877-0.6850.247982
36-0.095983-0.74960.228174


Partial Autocorrelation Function
Time lag kPACF(k)T-STATP-value
10.2621412.04740.022467
20.3152832.46240.00832
30.3691262.8830.002717
4-0.093905-0.73340.233056
50.0041840.03270.48702
60.0357530.27920.390502
7-0.256092-2.00010.024971
8-0.008058-0.06290.475011
9-0.010714-0.08370.466792
10-0.075552-0.59010.278659
11-0.070153-0.54790.292877
12-0.268877-2.10.019936
13-0.06-0.46860.320507
14-0.061891-0.48340.315278
150.1601971.25120.107823
160.0804330.62820.266108
170.2125451.660.051021
180.0621860.48570.314464
19-0.044669-0.34890.364191
200.0181310.14160.443928
210.1546421.20780.115895
22-0.16698-1.30420.09854
230.1002440.78290.218347
24-0.204157-1.59450.057994
25-0.028158-0.21990.413333
260.0262380.20490.419158
27-0.077964-0.60890.272421
280.0344430.2690.394415
290.0336420.26280.396813
300.1678161.31070.097439
310.0250830.19590.422669
32-0.043622-0.34070.367252
330.0516530.40340.344024
34-0.013462-0.10510.458304
350.010570.08260.467239
36-0.18561-1.44970.076137

\begin{tabular}{lllllllll}
\hline
Partial Autocorrelation Function \tabularnewline
Time lag k & PACF(k) & T-STAT & P-value \tabularnewline
1 & 0.262141 & 2.0474 & 0.022467 \tabularnewline
2 & 0.315283 & 2.4624 & 0.00832 \tabularnewline
3 & 0.369126 & 2.883 & 0.002717 \tabularnewline
4 & -0.093905 & -0.7334 & 0.233056 \tabularnewline
5 & 0.004184 & 0.0327 & 0.48702 \tabularnewline
6 & 0.035753 & 0.2792 & 0.390502 \tabularnewline
7 & -0.256092 & -2.0001 & 0.024971 \tabularnewline
8 & -0.008058 & -0.0629 & 0.475011 \tabularnewline
9 & -0.010714 & -0.0837 & 0.466792 \tabularnewline
10 & -0.075552 & -0.5901 & 0.278659 \tabularnewline
11 & -0.070153 & -0.5479 & 0.292877 \tabularnewline
12 & -0.268877 & -2.1 & 0.019936 \tabularnewline
13 & -0.06 & -0.4686 & 0.320507 \tabularnewline
14 & -0.061891 & -0.4834 & 0.315278 \tabularnewline
15 & 0.160197 & 1.2512 & 0.107823 \tabularnewline
16 & 0.080433 & 0.6282 & 0.266108 \tabularnewline
17 & 0.212545 & 1.66 & 0.051021 \tabularnewline
18 & 0.062186 & 0.4857 & 0.314464 \tabularnewline
19 & -0.044669 & -0.3489 & 0.364191 \tabularnewline
20 & 0.018131 & 0.1416 & 0.443928 \tabularnewline
21 & 0.154642 & 1.2078 & 0.115895 \tabularnewline
22 & -0.16698 & -1.3042 & 0.09854 \tabularnewline
23 & 0.100244 & 0.7829 & 0.218347 \tabularnewline
24 & -0.204157 & -1.5945 & 0.057994 \tabularnewline
25 & -0.028158 & -0.2199 & 0.413333 \tabularnewline
26 & 0.026238 & 0.2049 & 0.419158 \tabularnewline
27 & -0.077964 & -0.6089 & 0.272421 \tabularnewline
28 & 0.034443 & 0.269 & 0.394415 \tabularnewline
29 & 0.033642 & 0.2628 & 0.396813 \tabularnewline
30 & 0.167816 & 1.3107 & 0.097439 \tabularnewline
31 & 0.025083 & 0.1959 & 0.422669 \tabularnewline
32 & -0.043622 & -0.3407 & 0.367252 \tabularnewline
33 & 0.051653 & 0.4034 & 0.344024 \tabularnewline
34 & -0.013462 & -0.1051 & 0.458304 \tabularnewline
35 & 0.01057 & 0.0826 & 0.467239 \tabularnewline
36 & -0.18561 & -1.4497 & 0.076137 \tabularnewline
\hline
\end{tabular}
%Source: https://freestatistics.org/blog/index.php?pk=31516&T=2

[TABLE]
[ROW][C]Partial Autocorrelation Function[/C][/ROW]
[ROW][C]Time lag k[/C][C]PACF(k)[/C][C]T-STAT[/C][C]P-value[/C][/ROW]
[ROW][C]1[/C][C]0.262141[/C][C]2.0474[/C][C]0.022467[/C][/ROW]
[ROW][C]2[/C][C]0.315283[/C][C]2.4624[/C][C]0.00832[/C][/ROW]
[ROW][C]3[/C][C]0.369126[/C][C]2.883[/C][C]0.002717[/C][/ROW]
[ROW][C]4[/C][C]-0.093905[/C][C]-0.7334[/C][C]0.233056[/C][/ROW]
[ROW][C]5[/C][C]0.004184[/C][C]0.0327[/C][C]0.48702[/C][/ROW]
[ROW][C]6[/C][C]0.035753[/C][C]0.2792[/C][C]0.390502[/C][/ROW]
[ROW][C]7[/C][C]-0.256092[/C][C]-2.0001[/C][C]0.024971[/C][/ROW]
[ROW][C]8[/C][C]-0.008058[/C][C]-0.0629[/C][C]0.475011[/C][/ROW]
[ROW][C]9[/C][C]-0.010714[/C][C]-0.0837[/C][C]0.466792[/C][/ROW]
[ROW][C]10[/C][C]-0.075552[/C][C]-0.5901[/C][C]0.278659[/C][/ROW]
[ROW][C]11[/C][C]-0.070153[/C][C]-0.5479[/C][C]0.292877[/C][/ROW]
[ROW][C]12[/C][C]-0.268877[/C][C]-2.1[/C][C]0.019936[/C][/ROW]
[ROW][C]13[/C][C]-0.06[/C][C]-0.4686[/C][C]0.320507[/C][/ROW]
[ROW][C]14[/C][C]-0.061891[/C][C]-0.4834[/C][C]0.315278[/C][/ROW]
[ROW][C]15[/C][C]0.160197[/C][C]1.2512[/C][C]0.107823[/C][/ROW]
[ROW][C]16[/C][C]0.080433[/C][C]0.6282[/C][C]0.266108[/C][/ROW]
[ROW][C]17[/C][C]0.212545[/C][C]1.66[/C][C]0.051021[/C][/ROW]
[ROW][C]18[/C][C]0.062186[/C][C]0.4857[/C][C]0.314464[/C][/ROW]
[ROW][C]19[/C][C]-0.044669[/C][C]-0.3489[/C][C]0.364191[/C][/ROW]
[ROW][C]20[/C][C]0.018131[/C][C]0.1416[/C][C]0.443928[/C][/ROW]
[ROW][C]21[/C][C]0.154642[/C][C]1.2078[/C][C]0.115895[/C][/ROW]
[ROW][C]22[/C][C]-0.16698[/C][C]-1.3042[/C][C]0.09854[/C][/ROW]
[ROW][C]23[/C][C]0.100244[/C][C]0.7829[/C][C]0.218347[/C][/ROW]
[ROW][C]24[/C][C]-0.204157[/C][C]-1.5945[/C][C]0.057994[/C][/ROW]
[ROW][C]25[/C][C]-0.028158[/C][C]-0.2199[/C][C]0.413333[/C][/ROW]
[ROW][C]26[/C][C]0.026238[/C][C]0.2049[/C][C]0.419158[/C][/ROW]
[ROW][C]27[/C][C]-0.077964[/C][C]-0.6089[/C][C]0.272421[/C][/ROW]
[ROW][C]28[/C][C]0.034443[/C][C]0.269[/C][C]0.394415[/C][/ROW]
[ROW][C]29[/C][C]0.033642[/C][C]0.2628[/C][C]0.396813[/C][/ROW]
[ROW][C]30[/C][C]0.167816[/C][C]1.3107[/C][C]0.097439[/C][/ROW]
[ROW][C]31[/C][C]0.025083[/C][C]0.1959[/C][C]0.422669[/C][/ROW]
[ROW][C]32[/C][C]-0.043622[/C][C]-0.3407[/C][C]0.367252[/C][/ROW]
[ROW][C]33[/C][C]0.051653[/C][C]0.4034[/C][C]0.344024[/C][/ROW]
[ROW][C]34[/C][C]-0.013462[/C][C]-0.1051[/C][C]0.458304[/C][/ROW]
[ROW][C]35[/C][C]0.01057[/C][C]0.0826[/C][C]0.467239[/C][/ROW]
[ROW][C]36[/C][C]-0.18561[/C][C]-1.4497[/C][C]0.076137[/C][/ROW]
[/TABLE]
Source: https://freestatistics.org/blog/index.php?pk=31516&T=2

Globally Unique Identifier (entire table): ba.freestatistics.org/blog/index.php?pk=31516&T=2

As an alternative you can also use a QR Code:  

The GUIDs for individual cells are displayed in the table below:

Partial Autocorrelation Function
Time lag kPACF(k)T-STATP-value
10.2621412.04740.022467
20.3152832.46240.00832
30.3691262.8830.002717
4-0.093905-0.73340.233056
50.0041840.03270.48702
60.0357530.27920.390502
7-0.256092-2.00010.024971
8-0.008058-0.06290.475011
9-0.010714-0.08370.466792
10-0.075552-0.59010.278659
11-0.070153-0.54790.292877
12-0.268877-2.10.019936
13-0.06-0.46860.320507
14-0.061891-0.48340.315278
150.1601971.25120.107823
160.0804330.62820.266108
170.2125451.660.051021
180.0621860.48570.314464
19-0.044669-0.34890.364191
200.0181310.14160.443928
210.1546421.20780.115895
22-0.16698-1.30420.09854
230.1002440.78290.218347
24-0.204157-1.59450.057994
25-0.028158-0.21990.413333
260.0262380.20490.419158
27-0.077964-0.60890.272421
280.0344430.2690.394415
290.0336420.26280.396813
300.1678161.31070.097439
310.0250830.19590.422669
32-0.043622-0.34070.367252
330.0516530.40340.344024
34-0.013462-0.10510.458304
350.010570.08260.467239
36-0.18561-1.44970.076137


Parameters (Session):
par1 = 36 ; par2 = 1 ; par3 = 0 ; par4 = 1 ; par5 = 12 ;
Parameters (R input):
par1 = 36 ; par2 = 1 ; par3 = 0 ; par4 = 1 ; par5 = 12 ;
R code (references can be found in the software module):
if (par1 == 'Default') {
par1 = 10*log10(length(x))
} else {
par1 <- as.numeric(par1)
}
par2 <- as.numeric(par2)
par3 <- as.numeric(par3)
par4 <- as.numeric(par4)
par5 <- as.numeric(par5)
if (par2 == 0) {
x <- log(x)
} else {
x <- (x ^ par2 - 1) / par2
}
if (par3 > 0) x <- diff(x,lag=1,difference=par3)
if (par4 > 0) x <- diff(x,lag=par5,difference=par4)
bitmap(file='pic1.png')
racf <- acf(x,par1,main='Autocorrelation',xlab='lags',ylab='ACF')
dev.off()
bitmap(file='pic2.png')
rpacf <- pacf(x,par1,main='Partial Autocorrelation',xlab='lags',ylab='PACF')
dev.off()
(myacf <- c(racf$acf))
(mypacf <- c(rpacf$acf))
lengthx <- length(x)
sqrtn <- sqrt(lengthx)
load(file='createtable')
a<-table.start()
a<-table.row.start(a)
a<-table.element(a,'Autocorrelation Function',4,TRUE)
a<-table.row.end(a)
a<-table.row.start(a)
a<-table.element(a,'Time lag k',header=TRUE)
a<-table.element(a,hyperlink('basics.htm','ACF(k)','click here for more information about the Autocorrelation Function'),header=TRUE)
a<-table.element(a,'T-STAT',header=TRUE)
a<-table.element(a,'P-value',header=TRUE)
a<-table.row.end(a)
for (i in 2:(par1+1)) {
a<-table.row.start(a)
a<-table.element(a,i-1,header=TRUE)
a<-table.element(a,round(myacf[i],6))
mytstat <- myacf[i]*sqrtn
a<-table.element(a,round(mytstat,4))
a<-table.element(a,round(1-pt(abs(mytstat),lengthx),6))
a<-table.row.end(a)
}
a<-table.end(a)
table.save(a,file='mytable.tab')
a<-table.start()
a<-table.row.start(a)
a<-table.element(a,'Partial Autocorrelation Function',4,TRUE)
a<-table.row.end(a)
a<-table.row.start(a)
a<-table.element(a,'Time lag k',header=TRUE)
a<-table.element(a,hyperlink('basics.htm','PACF(k)','click here for more information about the Partial Autocorrelation Function'),header=TRUE)
a<-table.element(a,'T-STAT',header=TRUE)
a<-table.element(a,'P-value',header=TRUE)
a<-table.row.end(a)
for (i in 1:par1) {
a<-table.row.start(a)
a<-table.element(a,i,header=TRUE)
a<-table.element(a,round(mypacf[i],6))
mytstat <- mypacf[i]*sqrtn
a<-table.element(a,round(mytstat,4))
a<-table.element(a,round(1-pt(abs(mytstat),lengthx),6))
a<-table.row.end(a)
}
a<-table.end(a)
table.save(a,file='mytable1.tab')