Free Statistics
of Irreproducible Research!
Description of Statistical Computation | |||||||||||||||||||||||||||||||||||||||||||||||||||||||||||||||||||||||||||||||||||||||||||||||||||||||||||||||||||||||||||||||||||||||||||||||||||||||||||||||||||||||||||||||
|---|---|---|---|---|---|---|---|---|---|---|---|---|---|---|---|---|---|---|---|---|---|---|---|---|---|---|---|---|---|---|---|---|---|---|---|---|---|---|---|---|---|---|---|---|---|---|---|---|---|---|---|---|---|---|---|---|---|---|---|---|---|---|---|---|---|---|---|---|---|---|---|---|---|---|---|---|---|---|---|---|---|---|---|---|---|---|---|---|---|---|---|---|---|---|---|---|---|---|---|---|---|---|---|---|---|---|---|---|---|---|---|---|---|---|---|---|---|---|---|---|---|---|---|---|---|---|---|---|---|---|---|---|---|---|---|---|---|---|---|---|---|---|---|---|---|---|---|---|---|---|---|---|---|---|---|---|---|---|---|---|---|---|---|---|---|---|---|---|---|---|---|---|---|---|---|
| Author's title | |||||||||||||||||||||||||||||||||||||||||||||||||||||||||||||||||||||||||||||||||||||||||||||||||||||||||||||||||||||||||||||||||||||||||||||||||||||||||||||||||||||||||||||||
| Author | *The author of this computation has been verified* | ||||||||||||||||||||||||||||||||||||||||||||||||||||||||||||||||||||||||||||||||||||||||||||||||||||||||||||||||||||||||||||||||||||||||||||||||||||||||||||||||||||||||||||||
| R Software Module | rwasp_One Factor ANOVA.wasp | ||||||||||||||||||||||||||||||||||||||||||||||||||||||||||||||||||||||||||||||||||||||||||||||||||||||||||||||||||||||||||||||||||||||||||||||||||||||||||||||||||||||||||||||
| Title produced by software | One-Way-Between-Groups ANOVA- Free Statistics Software (Calculator) | ||||||||||||||||||||||||||||||||||||||||||||||||||||||||||||||||||||||||||||||||||||||||||||||||||||||||||||||||||||||||||||||||||||||||||||||||||||||||||||||||||||||||||||||
| Date of computation | Tue, 21 Oct 2014 09:30:46 +0100 | ||||||||||||||||||||||||||||||||||||||||||||||||||||||||||||||||||||||||||||||||||||||||||||||||||||||||||||||||||||||||||||||||||||||||||||||||||||||||||||||||||||||||||||||
| Cite this page as follows | Statistical Computations at FreeStatistics.org, Office for Research Development and Education, URL https://freestatistics.org/blog/index.php?v=date/2014/Oct/21/t1413880265fpdvbhae0nffzkv.htm/, Retrieved Mon, 27 Jul 2026 02:16:40 +0000 | ||||||||||||||||||||||||||||||||||||||||||||||||||||||||||||||||||||||||||||||||||||||||||||||||||||||||||||||||||||||||||||||||||||||||||||||||||||||||||||||||||||||||||||||
| Statistical Computations at FreeStatistics.org, Office for Research Development and Education, URL https://freestatistics.org/blog/index.php?pk=244345, Retrieved Mon, 27 Jul 2026 02:16:40 +0000 | |||||||||||||||||||||||||||||||||||||||||||||||||||||||||||||||||||||||||||||||||||||||||||||||||||||||||||||||||||||||||||||||||||||||||||||||||||||||||||||||||||||||||||||||
| QR Codes: | |||||||||||||||||||||||||||||||||||||||||||||||||||||||||||||||||||||||||||||||||||||||||||||||||||||||||||||||||||||||||||||||||||||||||||||||||||||||||||||||||||||||||||||||
|
| |||||||||||||||||||||||||||||||||||||||||||||||||||||||||||||||||||||||||||||||||||||||||||||||||||||||||||||||||||||||||||||||||||||||||||||||||||||||||||||||||||||||||||||||
| Original text written by user: | |||||||||||||||||||||||||||||||||||||||||||||||||||||||||||||||||||||||||||||||||||||||||||||||||||||||||||||||||||||||||||||||||||||||||||||||||||||||||||||||||||||||||||||||
| IsPrivate? | No (this computation is public) | ||||||||||||||||||||||||||||||||||||||||||||||||||||||||||||||||||||||||||||||||||||||||||||||||||||||||||||||||||||||||||||||||||||||||||||||||||||||||||||||||||||||||||||||
| User-defined keywords | |||||||||||||||||||||||||||||||||||||||||||||||||||||||||||||||||||||||||||||||||||||||||||||||||||||||||||||||||||||||||||||||||||||||||||||||||||||||||||||||||||||||||||||||
| Estimated Impact | 580 | ||||||||||||||||||||||||||||||||||||||||||||||||||||||||||||||||||||||||||||||||||||||||||||||||||||||||||||||||||||||||||||||||||||||||||||||||||||||||||||||||||||||||||||||
Tree of Dependent Computations | |||||||||||||||||||||||||||||||||||||||||||||||||||||||||||||||||||||||||||||||||||||||||||||||||||||||||||||||||||||||||||||||||||||||||||||||||||||||||||||||||||||||||||||||
| Family? (F = Feedback message, R = changed R code, M = changed R Module, P = changed Parameters, D = changed Data) | |||||||||||||||||||||||||||||||||||||||||||||||||||||||||||||||||||||||||||||||||||||||||||||||||||||||||||||||||||||||||||||||||||||||||||||||||||||||||||||||||||||||||||||||
| - [One-Way-Between-Groups ANOVA- Free Statistics Software (Calculator)] [] [2010-11-02 14:26:49] [b98453cac15ba1066b407e146608df68] - RMP [One-Way-Between-Groups ANOVA- Free Statistics Software (Calculator)] [] [2014-10-21 08:30:46] [63a9f0ea7bb98050796b649e85481845] [Current] - P [One-Way-Between-Groups ANOVA- Free Statistics Software (Calculator)] [] [2014-10-29 10:40:44] [2b9d0c54c8c845c625e475ed5f1f3af1] - M [One-Way-Between-Groups ANOVA- Free Statistics Software (Calculator)] [Ws 5 Question 7 p...] [2014-10-29 11:15:31] [be945163e51ed825733188af308451be] - M [One-Way-Between-Groups ANOVA- Free Statistics Software (Calculator)] [] [2014-10-29 11:47:50] [eee95947b6243a1febfcd5f41483d733] - M [One-Way-Between-Groups ANOVA- Free Statistics Software (Calculator)] [] [2014-10-29 12:48:59] [6656361aa4da5489a6a45e803df0211c] - M [One-Way-Between-Groups ANOVA- Free Statistics Software (Calculator)] [] [2014-10-29 12:50:37] [6656361aa4da5489a6a45e803df0211c] - P [One-Way-Between-Groups ANOVA- Free Statistics Software (Calculator)] [] [2014-10-29 13:59:18] [e493208d2907342b139e6792bbaea494] - M [One-Way-Between-Groups ANOVA- Free Statistics Software (Calculator)] [] [2014-10-29 14:27:19] [ae96d02647dd9ad9c105f1fa6642e295] - P [One-Way-Between-Groups ANOVA- Free Statistics Software (Calculator)] [WS5-7] [2014-10-29 14:27:02] [40df8d8b5657a9599acc6ccced535535] - P [One-Way-Between-Groups ANOVA- Free Statistics Software (Calculator)] [WS5- 7] [2014-10-29 14:28:15] [40df8d8b5657a9599acc6ccced535535] - M [One-Way-Between-Groups ANOVA- Free Statistics Software (Calculator)] [] [2014-10-29 14:29:08] [ae96d02647dd9ad9c105f1fa6642e295] - MP [One-Way-Between-Groups ANOVA- Free Statistics Software (Calculator)] [Task7.3 WS5] [2014-10-29 14:31:35] [805021881bfa5340347077d26b077617] - [One-Way-Between-Groups ANOVA- Free Statistics Software (Calculator)] [] [2014-10-29 14:50:27] [d253a55552bf9917a397def3be261e30] - P [One-Way-Between-Groups ANOVA- Free Statistics Software (Calculator)] [] [2014-10-29 15:00:33] [c2c160edf30e228bd3a949bf24376c2c] - M [One-Way-Between-Groups ANOVA- Free Statistics Software (Calculator)] [] [2014-10-29 15:17:00] [d253a55552bf9917a397def3be261e30] - P [One-Way-Between-Groups ANOVA- Free Statistics Software (Calculator)] [] [2014-10-29 15:19:19] [bca3c6529212edfac3e771806c79a908] - P [One-Way-Between-Groups ANOVA- Free Statistics Software (Calculator)] [WS 5: Q7 LT] [2014-10-29 15:23:17] [36781f05c04c55e165b348994b753b95] - P [One-Way-Between-Groups ANOVA- Free Statistics Software (Calculator)] [] [2014-10-29 15:29:55] [3cc57788b191749bdc089f5fad42e0f8] - MP [One-Way-Between-Groups ANOVA- Free Statistics Software (Calculator)] [WS5 Q7] [2014-10-29 16:15:44] [bcf5edf18529a33bd1494456d2c6cb9a] - P [One-Way-Between-Groups ANOVA- Free Statistics Software (Calculator)] [WS 5: Q7 KT-LT] [2014-10-29 16:20:30] [36781f05c04c55e165b348994b753b95] - P [One-Way-Between-Groups ANOVA- Free Statistics Software (Calculator)] [WS5] [2014-10-29 16:23:18] [36781f05c04c55e165b348994b753b95] - P [One-Way-Between-Groups ANOVA- Free Statistics Software (Calculator)] [] [2014-10-29 18:43:25] [bcf5edf18529a33bd1494456d2c6cb9a] - M [One-Way-Between-Groups ANOVA- Free Statistics Software (Calculator)] [Question 7 LT-KT a] [2014-10-29 18:47:04] [c91e4c88cfd8ec1fc4fb1878ec426fb8] - M [One-Way-Between-Groups ANOVA- Free Statistics Software (Calculator)] [Question 7 LT-KT b] [2014-10-29 18:47:49] [c91e4c88cfd8ec1fc4fb1878ec426fb8] - [One-Way-Between-Groups ANOVA- Free Statistics Software (Calculator)] [] [2014-10-29 19:29:45] [02fb6cbf799bcf1e525e4e01c2f27ada] - M [One-Way-Between-Groups ANOVA- Free Statistics Software (Calculator)] [] [2014-10-29 19:41:56] [93cb0d178904cf975da218b7c929e42d] - R PD [One-Way-Between-Groups ANOVA- Free Statistics Software (Calculator)] [] [2014-10-29 21:44:49] [cc401d1001c65f55a3dfc6f2420e9570] - RMPD [Two-Way ANOVA] [WS 5.8] [2014-10-29 22:42:24] [27d418b925e6b9b020a05307ec6c6034] - [One-Way-Between-Groups ANOVA- Free Statistics Software (Calculator)] [WS5 Q7.2] [2014-10-30 07:34:18] [ce9f16fa58bb2303d66047ab4343b505] - [One-Way-Between-Groups ANOVA- Free Statistics Software (Calculator)] [queston 7 - lange...] [2014-10-30 09:13:41] [1e921ed6280e31020168fe5cd3fc7265] - M [One-Way-Between-Groups ANOVA- Free Statistics Software (Calculator)] [] [2014-10-30 09:26:32] [1a6d42b46b3d01bc960fcfb45e99fecd] - R P [One-Way-Between-Groups ANOVA- Free Statistics Software (Calculator)] [T7 WS5 LT-KT] [2014-10-30 09:56:15] [56d77bf8347cfd1e104fa9098ce46dbd] - R P [One-Way-Between-Groups ANOVA- Free Statistics Software (Calculator)] [WS 5.7 LKT] [2014-10-30 09:58:43] [27d418b925e6b9b020a05307ec6c6034] - P [One-Way-Between-Groups ANOVA- Free Statistics Software (Calculator)] [] [2014-10-30 12:12:06] [4c4ebb0b36a379d1d949ba77427e658a] - MP [One-Way-Between-Groups ANOVA- Free Statistics Software (Calculator)] [] [2014-10-30 15:31:36] [18108d1ac0353540c4304edbd3652e0f] - P [One-Way-Between-Groups ANOVA- Free Statistics Software (Calculator)] [a] [2014-10-30 15:45:07] [118a39334d200089014f927b57d44a19] - M [One-Way-Between-Groups ANOVA- Free Statistics Software (Calculator)] [] [2014-10-30 15:55:35] [8d160a85bfd9526a7d0e42afc5fb569b] - M [One-Way-Between-Groups ANOVA- Free Statistics Software (Calculator)] [WS 5 task 7 KTLT] [2014-10-30 16:47:03] [fa1b8827d7de91b8b87087311d3d9fa1] - M [One-Way-Between-Groups ANOVA- Free Statistics Software (Calculator)] [] [2014-10-30 16:48:32] [69bf0eb8b9b38defaaf4848d8c317571] - M [One-Way-Between-Groups ANOVA- Free Statistics Software (Calculator)] [] [2014-10-30 17:12:31] [78252ca1523d3477f114bddbfa59edb4] - M [One-Way-Between-Groups ANOVA- Free Statistics Software (Calculator)] [WS5 question 7] [2014-10-30 17:15:38] [67894a4ff6098ffac356bc81e6028257] - M [One-Way-Between-Groups ANOVA- Free Statistics Software (Calculator)] [ANOVA] [2014-10-30 18:29:35] [3d5212c89039da1a3a24d8e18d23c716] - M [One-Way-Between-Groups ANOVA- Free Statistics Software (Calculator)] [ws5-que6] [2014-10-30 18:33:21] [55c1befec93c91d3068a87706a208f8c] - M [One-Way-Between-Groups ANOVA- Free Statistics Software (Calculator)] [jgfsd] [2014-10-30 18:36:14] [55c1befec93c91d3068a87706a208f8c] - [One-Way-Between-Groups ANOVA- Free Statistics Software (Calculator)] [ws 5 (13)] [2014-10-30 18:36:38] [55a850ac261e4a7d4f206113c00d6f60] - M [One-Way-Between-Groups ANOVA- Free Statistics Software (Calculator)] [S5] [2014-10-30 18:55:53] [1651e47f7f65f3a10bbbb444d4b26be7] - P [One-Way-Between-Groups ANOVA- Free Statistics Software (Calculator)] [] [2014-10-30 19:44:47] [044144d0728beecdb08e0d94daaff202] - M [One-Way-Between-Groups ANOVA- Free Statistics Software (Calculator)] [] [2014-10-30 20:07:54] [f12bfb29749f0c3f544bf278d0782c85] - M [One-Way-Between-Groups ANOVA- Free Statistics Software (Calculator)] [] [2014-10-30 20:09:30] [f12bfb29749f0c3f544bf278d0782c85] [Truncated] | |||||||||||||||||||||||||||||||||||||||||||||||||||||||||||||||||||||||||||||||||||||||||||||||||||||||||||||||||||||||||||||||||||||||||||||||||||||||||||||||||||||||||||||||
| Feedback Forum | |||||||||||||||||||||||||||||||||||||||||||||||||||||||||||||||||||||||||||||||||||||||||||||||||||||||||||||||||||||||||||||||||||||||||||||||||||||||||||||||||||||||||||||||
Post a new message | |||||||||||||||||||||||||||||||||||||||||||||||||||||||||||||||||||||||||||||||||||||||||||||||||||||||||||||||||||||||||||||||||||||||||||||||||||||||||||||||||||||||||||||||
Dataset | |||||||||||||||||||||||||||||||||||||||||||||||||||||||||||||||||||||||||||||||||||||||||||||||||||||||||||||||||||||||||||||||||||||||||||||||||||||||||||||||||||||||||||||||
| Dataseries X: | |||||||||||||||||||||||||||||||||||||||||||||||||||||||||||||||||||||||||||||||||||||||||||||||||||||||||||||||||||||||||||||||||||||||||||||||||||||||||||||||||||||||||||||||
'WWE' 0 0 0 0 0 0 0 'WWE' 0 0 0 0 0 0 0 'WWE' 0 1 1 1 1 0 2 'WWE' 0 0 0 0 0 0 0 'WWE' 0 1 1 1 1 0 2 'WWE' 0 0 1 0 1 1 1 'WWE' 0 0 0 0 0 0 0 'WWE' 0 1 1 1 1 0 2 'WWE' 0 0 0 0 0 0 0 'WWE' 0 0 0 0 0 0 0 'WWE' 0 0 0 0 0 0 0 'WWE' 0 0 0 0 0 0 0 'WWE' 0 0 0 0 0 0 0 'WWE' 0 0 NA 0 NA NA NA 'WWE' 0 0 1 0 1 1 1 'WWE' 1 1 NA 0 NA NA NA 'WWE' 1 0 0 -1 -1 0 -1 'WWE' 0 0 0 0 0 0 0 'WWE' 0 0 1 0 1 1 1 'WWE' 0 1 0 1 0 -1 1 'WWE' 0 0 0 0 0 0 0 'WWE' 1 1 0 0 -1 -1 0 'WWE' 0 0 0 0 0 0 0 'WWE' 0 1 0 1 0 -1 1 'WWE' 0 1 1 1 1 0 2 'WWE' 0 1 1 1 1 0 2 'WWE' 0 0 0 0 0 0 0 'WWE' 1 1 0 0 -1 -1 0 'WWE' 0 1 0 1 0 -1 1 'WWE' 0 1 0 1 0 -1 1 'WWE' 0 0 1 0 1 1 1 'WWE' 0 1 0 1 0 -1 1 'WWE' 0 1 0 1 0 -1 1 'WWE' 0 0 0 0 0 0 0 'WWE' 0 0 0 0 0 0 0 'WWE' 1 1 0 0 -1 -1 0 'WWE' 1 1 0 0 -1 -1 0 'WWE' 0 0 0 0 0 0 0 'WWE' 0 0 NA 0 NA NA NA 'WWE' 0 0 1 0 1 1 1 'WWE' 0 0 0 0 0 0 0 'CSWE' 0 0 0 0 0 0 0 'CSWE' 1 0 NA -1 NA NA NA 'CSWE' 0 0 0 0 0 0 0 'CSWE' 0 1 NA 1 NA NA NA 'CSWE' 0 1 0 1 0 -1 1 'CSWE' 0 0 0 0 0 0 0 'CSWE' 0 0 0 0 0 0 0 'CSWE' 0 0 1 0 1 1 1 'CSWE' 0 0 0 0 0 0 0 'CSWE' 1 1 0 0 -1 -1 0 'CSWE' 0 0 1 0 1 1 1 'CSWE' 0 1 0 1 0 -1 1 'CSWE' 0 0 0 0 0 0 0 'CSWE' 0 1 NA 1 NA NA NA 'CSWE' 0 1 0 1 0 -1 1 'CSWE' 0 1 NA 1 NA NA NA 'CSWE' 1 1 0 0 -1 -1 0 'CSWE' 0 1 0 1 0 -1 1 'CSWE' 0 0 NA 0 NA NA NA 'CSWE' 0 1 0 1 0 -1 1 'CSWE' 0 0 0 0 0 0 0 'CSWE' 0 0 NA 0 NA NA NA 'CSWE' 0 0 0 0 0 0 0 'CSWE' 0 1 0 1 0 -1 1 'CSWE' 0 0 0 0 0 0 0 'CSWE' 0 0 1 0 1 1 1 'CSWE' 0 1 0 1 0 -1 1 'CSWE' 0 1 0 1 0 -1 1 'CSWE' 1 1 0 0 -1 -1 0 'CSWE' 0 0 1 0 1 1 1 'CSWE' 0 1 1 1 1 0 2 'CSWE' 0 1 0 1 0 -1 1 'CSWE' 0 0 NA 0 NA NA NA 'CSWE' 0 0 0 0 0 0 0 'CSWE' 0 1 NA 1 NA NA NA 'CSWE' 0 0 0 0 0 0 0 'CSWE' 0 0 0 0 0 0 0 'CSWE' 0 0 0 0 0 0 0 'CSWE' 0 1 0 1 0 -1 1 'CSWE' 0 1 0 1 0 -1 1 'C' 0 0 0 0 0 0 0 'C' 0 0 1 0 1 1 1 'C' 1 0 0 -1 -1 0 -1 'C' 0 0 1 0 1 1 1 'C' 0 0 NA 0 NA NA NA 'C' 0 0 0 0 0 0 0 'C' 0 0 0 0 0 0 0 'C' 0 1 0 1 0 -1 1 'C' 1 1 0 0 -1 -1 0 'C' 0 0 NA 0 NA NA NA 'C' 0 0 0 0 0 0 0 'C' 0 1 0 1 0 -1 1 'C' 0 1 0 1 0 -1 1 'C' 0 0 0 0 0 0 0 'C' 0 0 0 0 0 0 0 'C' 0 0 0 0 0 0 0 'C' 0 0 0 0 0 0 0 'C' 0 0 NA 0 NA NA NA 'C' 0 0 0 0 0 0 0 'C' 0 1 0 1 0 -1 1 'C' 1 1 0 0 -1 -1 0 'C' 0 1 0 1 0 -1 1 'C' 0 0 0 0 0 0 0 'C' 0 0 0 0 0 0 0 'C' 1 1 0 0 -1 -1 0 'C' 0 0 0 0 0 0 0 'C' 0 0 0 0 0 0 0 'C' 0 0 0 0 0 0 0 'C' 0 0 0 0 0 0 0 'C' 0 0 0 0 0 0 0 'C' 1 1 0 0 -1 -1 0 'C' 0 0 1 0 1 1 1 'C' 0 0 0 0 0 0 0 'C' 0 0 0 0 0 0 0 'C' 0 0 0 0 0 0 0 'C' 0 0 1 0 1 1 1 'C' 0 0 0 0 0 0 0 'C' 0 0 NA 0 NA NA NA 'C' 1 1 0 0 -1 -1 0 | |||||||||||||||||||||||||||||||||||||||||||||||||||||||||||||||||||||||||||||||||||||||||||||||||||||||||||||||||||||||||||||||||||||||||||||||||||||||||||||||||||||||||||||||
Tables (Output of Computation) | |||||||||||||||||||||||||||||||||||||||||||||||||||||||||||||||||||||||||||||||||||||||||||||||||||||||||||||||||||||||||||||||||||||||||||||||||||||||||||||||||||||||||||||||
| |||||||||||||||||||||||||||||||||||||||||||||||||||||||||||||||||||||||||||||||||||||||||||||||||||||||||||||||||||||||||||||||||||||||||||||||||||||||||||||||||||||||||||||||
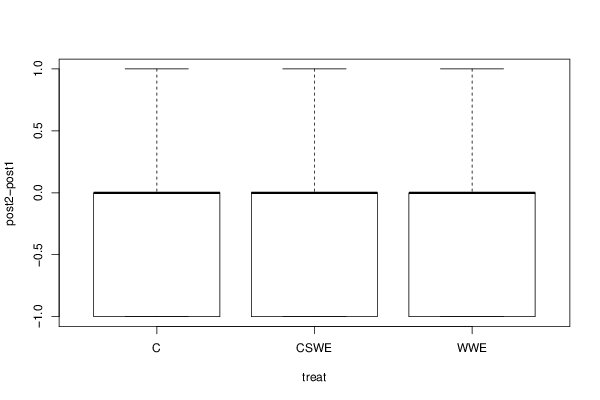
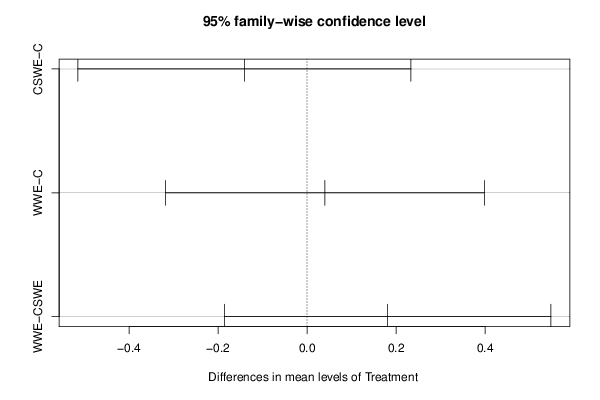
Figures (Output of Computation) | |||||||||||||||||||||||||||||||||||||||||||||||||||||||||||||||||||||||||||||||||||||||||||||||||||||||||||||||||||||||||||||||||||||||||||||||||||||||||||||||||||||||||||||||
Input Parameters & R Code | |||||||||||||||||||||||||||||||||||||||||||||||||||||||||||||||||||||||||||||||||||||||||||||||||||||||||||||||||||||||||||||||||||||||||||||||||||||||||||||||||||||||||||||||
| Parameters (Session): | |||||||||||||||||||||||||||||||||||||||||||||||||||||||||||||||||||||||||||||||||||||||||||||||||||||||||||||||||||||||||||||||||||||||||||||||||||||||||||||||||||||||||||||||
| par1 = 7 ; par2 = 1 ; par3 = TRUE ; | |||||||||||||||||||||||||||||||||||||||||||||||||||||||||||||||||||||||||||||||||||||||||||||||||||||||||||||||||||||||||||||||||||||||||||||||||||||||||||||||||||||||||||||||
| Parameters (R input): | |||||||||||||||||||||||||||||||||||||||||||||||||||||||||||||||||||||||||||||||||||||||||||||||||||||||||||||||||||||||||||||||||||||||||||||||||||||||||||||||||||||||||||||||
| par1 = 7 ; par2 = 1 ; par3 = TRUE ; | |||||||||||||||||||||||||||||||||||||||||||||||||||||||||||||||||||||||||||||||||||||||||||||||||||||||||||||||||||||||||||||||||||||||||||||||||||||||||||||||||||||||||||||||
| R code (references can be found in the software module): | |||||||||||||||||||||||||||||||||||||||||||||||||||||||||||||||||||||||||||||||||||||||||||||||||||||||||||||||||||||||||||||||||||||||||||||||||||||||||||||||||||||||||||||||
cat1 <- as.numeric(par1) # | |||||||||||||||||||||||||||||||||||||||||||||||||||||||||||||||||||||||||||||||||||||||||||||||||||||||||||||||||||||||||||||||||||||||||||||||||||||||||||||||||||||||||||||||