\begin{tabular}{lllllllll}
\hline
Summary of computational transaction \tabularnewline
Raw Input & view raw input (R code)  \tabularnewline
Raw Output & view raw output of R engine  \tabularnewline
Computing time & 1 seconds \tabularnewline
R Server & 'George Udny Yule' @ yule.wessa.net \tabularnewline
\hline
\end{tabular}
%Source: https://freestatistics.org/blog/index.php?pk=238482&T=0
[TABLE]
[ROW][C]Summary of computational transaction[/C][/ROW]
[ROW][C]Raw Input[/C][C]view raw input (R code) [/C][/ROW]
[ROW][C]Raw Output[/C][C]view raw output of R engine [/C][/ROW]
[ROW][C]Computing time[/C][C]1 seconds[/C][/ROW]
[ROW][C]R Server[/C][C]'George Udny Yule' @ yule.wessa.net[/C][/ROW]
[/TABLE]
Source: https://freestatistics.org/blog/index.php?pk=238482&T=0
If you paste this QR Code into your document, anyone with a smartphone or tablet will be able to scan it and view this table in a browser.
If you paste this QR Code into your document, anyone with a smartphone or tablet will be able to scan it and view this table in a browser.
If you paste this QR Code into your document, anyone with a smartphone or tablet will be able to scan it and view this table in a browser.
If you paste this QR Code into your document, anyone with a smartphone or tablet will be able to scan it and view this table in a browser.
If you paste this QR Code into your document, anyone with a smartphone or tablet will be able to scan it and view this table in a browser.
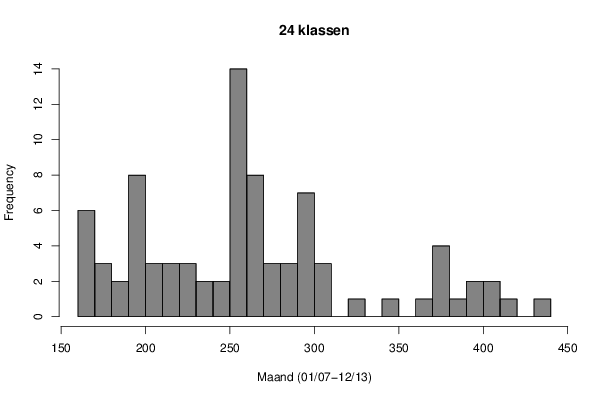
| Frequency Table (Histogram) | | Bins | Midpoint | Abs. Frequency | Rel. Frequency | Cumul. Rel. Freq. | Density | | [160,170[ | 165 | 6 | 0.071429 | 0.071429 | 0.007143 | | [170,180[ | 175 | 3 | 0.035714 | 0.107143 | 0.003571 | | [180,190[ | 185 | 2 | 0.02381 | 0.130952 | 0.002381 | | [190,200[ | 195 | 8 | 0.095238 | 0.22619 | 0.009524 | | [200,210[ | 205 | 3 | 0.035714 | 0.261905 | 0.003571 | | [210,220[ | 215 | 3 | 0.035714 | 0.297619 | 0.003571 | | [220,230[ | 225 | 3 | 0.035714 | 0.333333 | 0.003571 | | [230,240[ | 235 | 2 | 0.02381 | 0.357143 | 0.002381 | | [240,250[ | 245 | 2 | 0.02381 | 0.380952 | 0.002381 | | [250,260[ | 255 | 14 | 0.166667 | 0.547619 | 0.016667 | | [260,270[ | 265 | 8 | 0.095238 | 0.642857 | 0.009524 | | [270,280[ | 275 | 3 | 0.035714 | 0.678571 | 0.003571 | | [280,290[ | 285 | 3 | 0.035714 | 0.714286 | 0.003571 | | [290,300[ | 295 | 7 | 0.083333 | 0.797619 | 0.008333 | | [300,310[ | 305 | 3 | 0.035714 | 0.833333 | 0.003571 | | [310,320[ | 315 | 0 | 0 | 0.833333 | 0 | | [320,330[ | 325 | 1 | 0.011905 | 0.845238 | 0.00119 | | [330,340[ | 335 | 0 | 0 | 0.845238 | 0 | | [340,350[ | 345 | 1 | 0.011905 | 0.857143 | 0.00119 | | [350,360[ | 355 | 0 | 0 | 0.857143 | 0 | | [360,370[ | 365 | 1 | 0.011905 | 0.869048 | 0.00119 | | [370,380[ | 375 | 4 | 0.047619 | 0.916667 | 0.004762 | | [380,390[ | 385 | 1 | 0.011905 | 0.928571 | 0.00119 | | [390,400[ | 395 | 2 | 0.02381 | 0.952381 | 0.002381 | | [400,410[ | 405 | 2 | 0.02381 | 0.97619 | 0.002381 | | [410,420[ | 415 | 1 | 0.011905 | 0.988095 | 0.00119 | | [420,430[ | 425 | 0 | 0 | 0.988095 | 0 | | [430,440] | 435 | 1 | 0.011905 | 1 | 0.00119 |
\begin{tabular}{lllllllll}
\hline
Frequency Table (Histogram) \tabularnewline
Bins & Midpoint & Abs. Frequency & Rel. Frequency & Cumul. Rel. Freq. & Density \tabularnewline
[160,170[ & 165 & 6 & 0.071429 & 0.071429 & 0.007143 \tabularnewline
[170,180[ & 175 & 3 & 0.035714 & 0.107143 & 0.003571 \tabularnewline
[180,190[ & 185 & 2 & 0.02381 & 0.130952 & 0.002381 \tabularnewline
[190,200[ & 195 & 8 & 0.095238 & 0.22619 & 0.009524 \tabularnewline
[200,210[ & 205 & 3 & 0.035714 & 0.261905 & 0.003571 \tabularnewline
[210,220[ & 215 & 3 & 0.035714 & 0.297619 & 0.003571 \tabularnewline
[220,230[ & 225 & 3 & 0.035714 & 0.333333 & 0.003571 \tabularnewline
[230,240[ & 235 & 2 & 0.02381 & 0.357143 & 0.002381 \tabularnewline
[240,250[ & 245 & 2 & 0.02381 & 0.380952 & 0.002381 \tabularnewline
[250,260[ & 255 & 14 & 0.166667 & 0.547619 & 0.016667 \tabularnewline
[260,270[ & 265 & 8 & 0.095238 & 0.642857 & 0.009524 \tabularnewline
[270,280[ & 275 & 3 & 0.035714 & 0.678571 & 0.003571 \tabularnewline
[280,290[ & 285 & 3 & 0.035714 & 0.714286 & 0.003571 \tabularnewline
[290,300[ & 295 & 7 & 0.083333 & 0.797619 & 0.008333 \tabularnewline
[300,310[ & 305 & 3 & 0.035714 & 0.833333 & 0.003571 \tabularnewline
[310,320[ & 315 & 0 & 0 & 0.833333 & 0 \tabularnewline
[320,330[ & 325 & 1 & 0.011905 & 0.845238 & 0.00119 \tabularnewline
[330,340[ & 335 & 0 & 0 & 0.845238 & 0 \tabularnewline
[340,350[ & 345 & 1 & 0.011905 & 0.857143 & 0.00119 \tabularnewline
[350,360[ & 355 & 0 & 0 & 0.857143 & 0 \tabularnewline
[360,370[ & 365 & 1 & 0.011905 & 0.869048 & 0.00119 \tabularnewline
[370,380[ & 375 & 4 & 0.047619 & 0.916667 & 0.004762 \tabularnewline
[380,390[ & 385 & 1 & 0.011905 & 0.928571 & 0.00119 \tabularnewline
[390,400[ & 395 & 2 & 0.02381 & 0.952381 & 0.002381 \tabularnewline
[400,410[ & 405 & 2 & 0.02381 & 0.97619 & 0.002381 \tabularnewline
[410,420[ & 415 & 1 & 0.011905 & 0.988095 & 0.00119 \tabularnewline
[420,430[ & 425 & 0 & 0 & 0.988095 & 0 \tabularnewline
[430,440] & 435 & 1 & 0.011905 & 1 & 0.00119 \tabularnewline
\hline
\end{tabular}
%Source: https://freestatistics.org/blog/index.php?pk=238482&T=1
[TABLE]
[ROW][C]Frequency Table (Histogram)[/C][/ROW]
[ROW][C]Bins[/C][C]Midpoint[/C][C]Abs. Frequency[/C][C]Rel. Frequency[/C][C]Cumul. Rel. Freq.[/C][C]Density[/C][/ROW]
[ROW][C][160,170[[/C][C]165[/C][C]6[/C][C]0.071429[/C][C]0.071429[/C][C]0.007143[/C][/ROW]
[ROW][C][170,180[[/C][C]175[/C][C]3[/C][C]0.035714[/C][C]0.107143[/C][C]0.003571[/C][/ROW]
[ROW][C][180,190[[/C][C]185[/C][C]2[/C][C]0.02381[/C][C]0.130952[/C][C]0.002381[/C][/ROW]
[ROW][C][190,200[[/C][C]195[/C][C]8[/C][C]0.095238[/C][C]0.22619[/C][C]0.009524[/C][/ROW]
[ROW][C][200,210[[/C][C]205[/C][C]3[/C][C]0.035714[/C][C]0.261905[/C][C]0.003571[/C][/ROW]
[ROW][C][210,220[[/C][C]215[/C][C]3[/C][C]0.035714[/C][C]0.297619[/C][C]0.003571[/C][/ROW]
[ROW][C][220,230[[/C][C]225[/C][C]3[/C][C]0.035714[/C][C]0.333333[/C][C]0.003571[/C][/ROW]
[ROW][C][230,240[[/C][C]235[/C][C]2[/C][C]0.02381[/C][C]0.357143[/C][C]0.002381[/C][/ROW]
[ROW][C][240,250[[/C][C]245[/C][C]2[/C][C]0.02381[/C][C]0.380952[/C][C]0.002381[/C][/ROW]
[ROW][C][250,260[[/C][C]255[/C][C]14[/C][C]0.166667[/C][C]0.547619[/C][C]0.016667[/C][/ROW]
[ROW][C][260,270[[/C][C]265[/C][C]8[/C][C]0.095238[/C][C]0.642857[/C][C]0.009524[/C][/ROW]
[ROW][C][270,280[[/C][C]275[/C][C]3[/C][C]0.035714[/C][C]0.678571[/C][C]0.003571[/C][/ROW]
[ROW][C][280,290[[/C][C]285[/C][C]3[/C][C]0.035714[/C][C]0.714286[/C][C]0.003571[/C][/ROW]
[ROW][C][290,300[[/C][C]295[/C][C]7[/C][C]0.083333[/C][C]0.797619[/C][C]0.008333[/C][/ROW]
[ROW][C][300,310[[/C][C]305[/C][C]3[/C][C]0.035714[/C][C]0.833333[/C][C]0.003571[/C][/ROW]
[ROW][C][310,320[[/C][C]315[/C][C]0[/C][C]0[/C][C]0.833333[/C][C]0[/C][/ROW]
[ROW][C][320,330[[/C][C]325[/C][C]1[/C][C]0.011905[/C][C]0.845238[/C][C]0.00119[/C][/ROW]
[ROW][C][330,340[[/C][C]335[/C][C]0[/C][C]0[/C][C]0.845238[/C][C]0[/C][/ROW]
[ROW][C][340,350[[/C][C]345[/C][C]1[/C][C]0.011905[/C][C]0.857143[/C][C]0.00119[/C][/ROW]
[ROW][C][350,360[[/C][C]355[/C][C]0[/C][C]0[/C][C]0.857143[/C][C]0[/C][/ROW]
[ROW][C][360,370[[/C][C]365[/C][C]1[/C][C]0.011905[/C][C]0.869048[/C][C]0.00119[/C][/ROW]
[ROW][C][370,380[[/C][C]375[/C][C]4[/C][C]0.047619[/C][C]0.916667[/C][C]0.004762[/C][/ROW]
[ROW][C][380,390[[/C][C]385[/C][C]1[/C][C]0.011905[/C][C]0.928571[/C][C]0.00119[/C][/ROW]
[ROW][C][390,400[[/C][C]395[/C][C]2[/C][C]0.02381[/C][C]0.952381[/C][C]0.002381[/C][/ROW]
[ROW][C][400,410[[/C][C]405[/C][C]2[/C][C]0.02381[/C][C]0.97619[/C][C]0.002381[/C][/ROW]
[ROW][C][410,420[[/C][C]415[/C][C]1[/C][C]0.011905[/C][C]0.988095[/C][C]0.00119[/C][/ROW]
[ROW][C][420,430[[/C][C]425[/C][C]0[/C][C]0[/C][C]0.988095[/C][C]0[/C][/ROW]
[ROW][C][430,440][/C][C]435[/C][C]1[/C][C]0.011905[/C][C]1[/C][C]0.00119[/C][/ROW]
[/TABLE]
Source: https://freestatistics.org/blog/index.php?pk=238482&T=1
Globally Unique Identifier (entire table): ba.freestatistics.org/blog/index.php?pk=238482&T=1
As an alternative you can also use a QR Code:
The GUIDs for individual cells are displayed in the table below:
| Frequency Table (Histogram) | | Bins | Midpoint | Abs. Frequency | Rel. Frequency | Cumul. Rel. Freq. | Density | | [160,170[ | 165 | 6 | 0.071429 | 0.071429 | 0.007143 | | [170,180[ | 175 | 3 | 0.035714 | 0.107143 | 0.003571 | | [180,190[ | 185 | 2 | 0.02381 | 0.130952 | 0.002381 | | [190,200[ | 195 | 8 | 0.095238 | 0.22619 | 0.009524 | | [200,210[ | 205 | 3 | 0.035714 | 0.261905 | 0.003571 | | [210,220[ | 215 | 3 | 0.035714 | 0.297619 | 0.003571 | | [220,230[ | 225 | 3 | 0.035714 | 0.333333 | 0.003571 | | [230,240[ | 235 | 2 | 0.02381 | 0.357143 | 0.002381 | | [240,250[ | 245 | 2 | 0.02381 | 0.380952 | 0.002381 | | [250,260[ | 255 | 14 | 0.166667 | 0.547619 | 0.016667 | | [260,270[ | 265 | 8 | 0.095238 | 0.642857 | 0.009524 | | [270,280[ | 275 | 3 | 0.035714 | 0.678571 | 0.003571 | | [280,290[ | 285 | 3 | 0.035714 | 0.714286 | 0.003571 | | [290,300[ | 295 | 7 | 0.083333 | 0.797619 | 0.008333 | | [300,310[ | 305 | 3 | 0.035714 | 0.833333 | 0.003571 | | [310,320[ | 315 | 0 | 0 | 0.833333 | 0 | | [320,330[ | 325 | 1 | 0.011905 | 0.845238 | 0.00119 | | [330,340[ | 335 | 0 | 0 | 0.845238 | 0 | | [340,350[ | 345 | 1 | 0.011905 | 0.857143 | 0.00119 | | [350,360[ | 355 | 0 | 0 | 0.857143 | 0 | | [360,370[ | 365 | 1 | 0.011905 | 0.869048 | 0.00119 | | [370,380[ | 375 | 4 | 0.047619 | 0.916667 | 0.004762 | | [380,390[ | 385 | 1 | 0.011905 | 0.928571 | 0.00119 | | [390,400[ | 395 | 2 | 0.02381 | 0.952381 | 0.002381 | | [400,410[ | 405 | 2 | 0.02381 | 0.97619 | 0.002381 | | [410,420[ | 415 | 1 | 0.011905 | 0.988095 | 0.00119 | | [420,430[ | 425 | 0 | 0 | 0.988095 | 0 | | [430,440] | 435 | 1 | 0.011905 | 1 | 0.00119 |
If you paste this QR Code into your document, anyone with a smartphone or tablet will be able to scan it and view this table in a browser.
If you paste this QR Code into your document, anyone with a smartphone or tablet will be able to scan it and view this table in a browser.
If you paste this QR Code into your document, anyone with a smartphone or tablet will be able to scan it and view this table in a browser.
If you paste this QR Code into your document, anyone with a smartphone or tablet will be able to scan it and view this table in a browser.
If you paste this QR Code into your document, anyone with a smartphone or tablet will be able to scan it and view this table in a browser.
|