Free Statistics

of Irreproducible Research!

Author's title

Author*Unverified author*
R Software Modulerwasp_autocorrelation.wasp
Title produced by software(Partial) Autocorrelation Function
Date of computationSun, 22 Dec 2013 11:16:18 -0500
Cite this page as followsStatistical Computations at FreeStatistics.org, Office for Research Development and Education, URL https://freestatistics.org/blog/index.php?v=date/2013/Dec/22/t1387729009h8y5sgxh9q5thfl.htm/, Retrieved Thu, 28 Mar 2024 17:56:36 +0000
Statistical Computations at FreeStatistics.org, Office for Research Development and Education, URL https://freestatistics.org/blog/index.php?pk=232542, Retrieved Thu, 28 Mar 2024 17:56:36 +0000
QR Codes:

Original text written by user:
IsPrivate?No (this computation is public)
User-defined keywords
Estimated Impact151
Family? (F = Feedback message, R = changed R code, M = changed R Module, P = changed Parameters, D = changed Data)
-     [Notched Boxplots] [werkloosheidscijf...] [2013-10-08 18:26:09] [6a1a05b03d1c87a66b915fc3d5866cc8]
- RMPD  [Harrell-Davis Quantiles] [consumtieprijs va...] [2013-12-21 15:50:38] [6a1a05b03d1c87a66b915fc3d5866cc8]
-   PD    [Harrell-Davis Quantiles] [] [2013-12-21 16:11:56] [6a1a05b03d1c87a66b915fc3d5866cc8]
- RMPD      [(Partial) Autocorrelation Function] [] [2013-12-21 18:23:11] [6a1a05b03d1c87a66b915fc3d5866cc8]
- R PD          [(Partial) Autocorrelation Function] [] [2013-12-22 16:16:18] [4a7f7842fc88d649abcd00dd10ef7b6c] [Current]
Feedback Forum

Post a new message
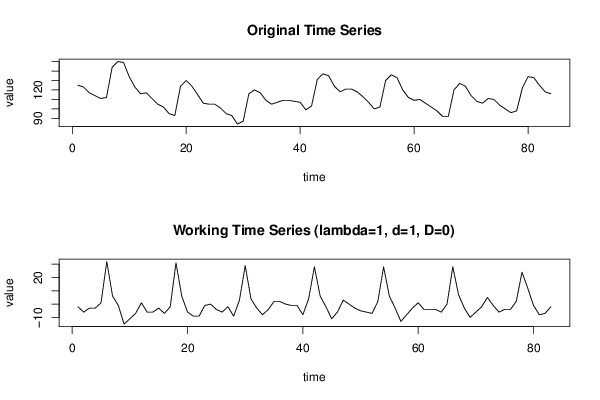
Dataseries X:
125
123
117
114
111
112
144
150
149
134
123
116
117
111
105
102
95
93
124
130
124
115
106
105
105
101
95
93
84
87
116
120
117
109
105
107
109
109
108
107
99
103
131
137
135
124
118
121
121
118
113
107
100
102
130
136
133
120
112
109
110
106
102
98
92
92
120
127
124
114
108
106
111
110
104
100
96
98
122
134
133
125
118
116


Summary of computational transaction
Raw Inputview raw input (R code)
Raw Outputview raw output of R engine
Computing time5 seconds
R Server'Gwilym Jenkins' @ jenkins.wessa.net

\begin{tabular}{lllllllll}
\hline
Summary of computational transaction \tabularnewline
Raw Input & view raw input (R code)  \tabularnewline
Raw Output & view raw output of R engine  \tabularnewline
Computing time & 5 seconds \tabularnewline
R Server & 'Gwilym Jenkins' @ jenkins.wessa.net \tabularnewline
\hline
\end{tabular}
%Source: https://freestatistics.org/blog/index.php?pk=232542&T=0

[TABLE]
[ROW][C]Summary of computational transaction[/C][/ROW]
[ROW][C]Raw Input[/C][C]view raw input (R code) [/C][/ROW]
[ROW][C]Raw Output[/C][C]view raw output of R engine [/C][/ROW]
[ROW][C]Computing time[/C][C]5 seconds[/C][/ROW]
[ROW][C]R Server[/C][C]'Gwilym Jenkins' @ jenkins.wessa.net[/C][/ROW]
[/TABLE]
Source: https://freestatistics.org/blog/index.php?pk=232542&T=0

Globally Unique Identifier (entire table): ba.freestatistics.org/blog/index.php?pk=232542&T=0

As an alternative you can also use a QR Code:  

The GUIDs for individual cells are displayed in the table below:

Summary of computational transaction
Raw Inputview raw input (R code)
Raw Outputview raw output of R engine
Computing time5 seconds
R Server'Gwilym Jenkins' @ jenkins.wessa.net


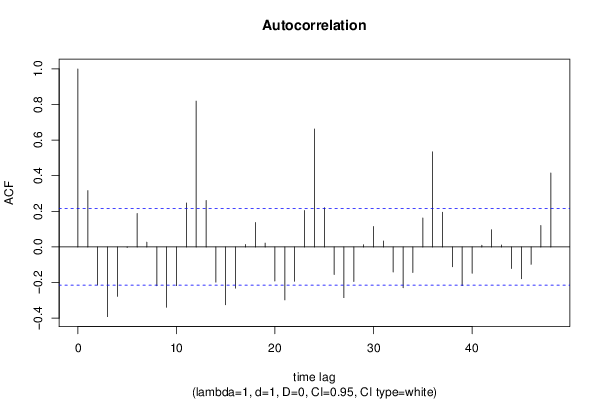
Autocorrelation Function
Time lag kACF(k)T-STATP-value
10.3165862.88420.002498
2-0.213313-1.94340.02768
3-0.391644-3.5683e-04
4-0.277885-2.53170.006619
5-0.003406-0.0310.487661
60.1878421.71130.045378
70.0269130.24520.403458
8-0.218091-1.98690.025116
9-0.338854-3.08710.001374
10-0.217375-1.98040.025487
110.24732.2530.013448
120.819297.46410
130.2613242.38080.009783
14-0.197855-1.80250.037545
15-0.325028-2.96110.001998
16-0.231277-2.1070.019066
170.0136020.12390.450839
180.1372431.25030.107344
190.0215070.19590.42257
20-0.19163-1.74580.04227
21-0.297376-2.70920.004095
22-0.192385-1.75270.041672
230.204441.86250.033033
240.66236.03380
250.2203432.00740.02398
26-0.155295-1.41480.080434
27-0.284754-2.59420.005603
28-0.194508-1.7720.040028
290.0125790.11460.454521
300.1145761.04380.149796
310.0339010.30890.379102
32-0.140426-1.27930.102171
33-0.22948-2.09070.019809
34-0.143534-1.30770.0973
350.1629051.48410.07078
360.5341934.86673e-06
370.1946111.7730.039949
38-0.111603-1.01680.156113
39-0.217484-1.98140.02543
40-0.14796-1.3480.090666
410.0096850.08820.464951
420.0969650.88340.189789
430.0111240.10130.45976
44-0.120715-1.09980.137307
45-0.178751-1.62850.053605
46-0.097823-0.89120.187698
470.1205431.09820.137646
480.4158643.78870.000143

\begin{tabular}{lllllllll}
\hline
Autocorrelation Function \tabularnewline
Time lag k & ACF(k) & T-STAT & P-value \tabularnewline
1 & 0.316586 & 2.8842 & 0.002498 \tabularnewline
2 & -0.213313 & -1.9434 & 0.02768 \tabularnewline
3 & -0.391644 & -3.568 & 3e-04 \tabularnewline
4 & -0.277885 & -2.5317 & 0.006619 \tabularnewline
5 & -0.003406 & -0.031 & 0.487661 \tabularnewline
6 & 0.187842 & 1.7113 & 0.045378 \tabularnewline
7 & 0.026913 & 0.2452 & 0.403458 \tabularnewline
8 & -0.218091 & -1.9869 & 0.025116 \tabularnewline
9 & -0.338854 & -3.0871 & 0.001374 \tabularnewline
10 & -0.217375 & -1.9804 & 0.025487 \tabularnewline
11 & 0.2473 & 2.253 & 0.013448 \tabularnewline
12 & 0.81929 & 7.4641 & 0 \tabularnewline
13 & 0.261324 & 2.3808 & 0.009783 \tabularnewline
14 & -0.197855 & -1.8025 & 0.037545 \tabularnewline
15 & -0.325028 & -2.9611 & 0.001998 \tabularnewline
16 & -0.231277 & -2.107 & 0.019066 \tabularnewline
17 & 0.013602 & 0.1239 & 0.450839 \tabularnewline
18 & 0.137243 & 1.2503 & 0.107344 \tabularnewline
19 & 0.021507 & 0.1959 & 0.42257 \tabularnewline
20 & -0.19163 & -1.7458 & 0.04227 \tabularnewline
21 & -0.297376 & -2.7092 & 0.004095 \tabularnewline
22 & -0.192385 & -1.7527 & 0.041672 \tabularnewline
23 & 0.20444 & 1.8625 & 0.033033 \tabularnewline
24 & 0.6623 & 6.0338 & 0 \tabularnewline
25 & 0.220343 & 2.0074 & 0.02398 \tabularnewline
26 & -0.155295 & -1.4148 & 0.080434 \tabularnewline
27 & -0.284754 & -2.5942 & 0.005603 \tabularnewline
28 & -0.194508 & -1.772 & 0.040028 \tabularnewline
29 & 0.012579 & 0.1146 & 0.454521 \tabularnewline
30 & 0.114576 & 1.0438 & 0.149796 \tabularnewline
31 & 0.033901 & 0.3089 & 0.379102 \tabularnewline
32 & -0.140426 & -1.2793 & 0.102171 \tabularnewline
33 & -0.22948 & -2.0907 & 0.019809 \tabularnewline
34 & -0.143534 & -1.3077 & 0.0973 \tabularnewline
35 & 0.162905 & 1.4841 & 0.07078 \tabularnewline
36 & 0.534193 & 4.8667 & 3e-06 \tabularnewline
37 & 0.194611 & 1.773 & 0.039949 \tabularnewline
38 & -0.111603 & -1.0168 & 0.156113 \tabularnewline
39 & -0.217484 & -1.9814 & 0.02543 \tabularnewline
40 & -0.14796 & -1.348 & 0.090666 \tabularnewline
41 & 0.009685 & 0.0882 & 0.464951 \tabularnewline
42 & 0.096965 & 0.8834 & 0.189789 \tabularnewline
43 & 0.011124 & 0.1013 & 0.45976 \tabularnewline
44 & -0.120715 & -1.0998 & 0.137307 \tabularnewline
45 & -0.178751 & -1.6285 & 0.053605 \tabularnewline
46 & -0.097823 & -0.8912 & 0.187698 \tabularnewline
47 & 0.120543 & 1.0982 & 0.137646 \tabularnewline
48 & 0.415864 & 3.7887 & 0.000143 \tabularnewline
\hline
\end{tabular}
%Source: https://freestatistics.org/blog/index.php?pk=232542&T=1

[TABLE]
[ROW][C]Autocorrelation Function[/C][/ROW]
[ROW][C]Time lag k[/C][C]ACF(k)[/C][C]T-STAT[/C][C]P-value[/C][/ROW]
[ROW][C]1[/C][C]0.316586[/C][C]2.8842[/C][C]0.002498[/C][/ROW]
[ROW][C]2[/C][C]-0.213313[/C][C]-1.9434[/C][C]0.02768[/C][/ROW]
[ROW][C]3[/C][C]-0.391644[/C][C]-3.568[/C][C]3e-04[/C][/ROW]
[ROW][C]4[/C][C]-0.277885[/C][C]-2.5317[/C][C]0.006619[/C][/ROW]
[ROW][C]5[/C][C]-0.003406[/C][C]-0.031[/C][C]0.487661[/C][/ROW]
[ROW][C]6[/C][C]0.187842[/C][C]1.7113[/C][C]0.045378[/C][/ROW]
[ROW][C]7[/C][C]0.026913[/C][C]0.2452[/C][C]0.403458[/C][/ROW]
[ROW][C]8[/C][C]-0.218091[/C][C]-1.9869[/C][C]0.025116[/C][/ROW]
[ROW][C]9[/C][C]-0.338854[/C][C]-3.0871[/C][C]0.001374[/C][/ROW]
[ROW][C]10[/C][C]-0.217375[/C][C]-1.9804[/C][C]0.025487[/C][/ROW]
[ROW][C]11[/C][C]0.2473[/C][C]2.253[/C][C]0.013448[/C][/ROW]
[ROW][C]12[/C][C]0.81929[/C][C]7.4641[/C][C]0[/C][/ROW]
[ROW][C]13[/C][C]0.261324[/C][C]2.3808[/C][C]0.009783[/C][/ROW]
[ROW][C]14[/C][C]-0.197855[/C][C]-1.8025[/C][C]0.037545[/C][/ROW]
[ROW][C]15[/C][C]-0.325028[/C][C]-2.9611[/C][C]0.001998[/C][/ROW]
[ROW][C]16[/C][C]-0.231277[/C][C]-2.107[/C][C]0.019066[/C][/ROW]
[ROW][C]17[/C][C]0.013602[/C][C]0.1239[/C][C]0.450839[/C][/ROW]
[ROW][C]18[/C][C]0.137243[/C][C]1.2503[/C][C]0.107344[/C][/ROW]
[ROW][C]19[/C][C]0.021507[/C][C]0.1959[/C][C]0.42257[/C][/ROW]
[ROW][C]20[/C][C]-0.19163[/C][C]-1.7458[/C][C]0.04227[/C][/ROW]
[ROW][C]21[/C][C]-0.297376[/C][C]-2.7092[/C][C]0.004095[/C][/ROW]
[ROW][C]22[/C][C]-0.192385[/C][C]-1.7527[/C][C]0.041672[/C][/ROW]
[ROW][C]23[/C][C]0.20444[/C][C]1.8625[/C][C]0.033033[/C][/ROW]
[ROW][C]24[/C][C]0.6623[/C][C]6.0338[/C][C]0[/C][/ROW]
[ROW][C]25[/C][C]0.220343[/C][C]2.0074[/C][C]0.02398[/C][/ROW]
[ROW][C]26[/C][C]-0.155295[/C][C]-1.4148[/C][C]0.080434[/C][/ROW]
[ROW][C]27[/C][C]-0.284754[/C][C]-2.5942[/C][C]0.005603[/C][/ROW]
[ROW][C]28[/C][C]-0.194508[/C][C]-1.772[/C][C]0.040028[/C][/ROW]
[ROW][C]29[/C][C]0.012579[/C][C]0.1146[/C][C]0.454521[/C][/ROW]
[ROW][C]30[/C][C]0.114576[/C][C]1.0438[/C][C]0.149796[/C][/ROW]
[ROW][C]31[/C][C]0.033901[/C][C]0.3089[/C][C]0.379102[/C][/ROW]
[ROW][C]32[/C][C]-0.140426[/C][C]-1.2793[/C][C]0.102171[/C][/ROW]
[ROW][C]33[/C][C]-0.22948[/C][C]-2.0907[/C][C]0.019809[/C][/ROW]
[ROW][C]34[/C][C]-0.143534[/C][C]-1.3077[/C][C]0.0973[/C][/ROW]
[ROW][C]35[/C][C]0.162905[/C][C]1.4841[/C][C]0.07078[/C][/ROW]
[ROW][C]36[/C][C]0.534193[/C][C]4.8667[/C][C]3e-06[/C][/ROW]
[ROW][C]37[/C][C]0.194611[/C][C]1.773[/C][C]0.039949[/C][/ROW]
[ROW][C]38[/C][C]-0.111603[/C][C]-1.0168[/C][C]0.156113[/C][/ROW]
[ROW][C]39[/C][C]-0.217484[/C][C]-1.9814[/C][C]0.02543[/C][/ROW]
[ROW][C]40[/C][C]-0.14796[/C][C]-1.348[/C][C]0.090666[/C][/ROW]
[ROW][C]41[/C][C]0.009685[/C][C]0.0882[/C][C]0.464951[/C][/ROW]
[ROW][C]42[/C][C]0.096965[/C][C]0.8834[/C][C]0.189789[/C][/ROW]
[ROW][C]43[/C][C]0.011124[/C][C]0.1013[/C][C]0.45976[/C][/ROW]
[ROW][C]44[/C][C]-0.120715[/C][C]-1.0998[/C][C]0.137307[/C][/ROW]
[ROW][C]45[/C][C]-0.178751[/C][C]-1.6285[/C][C]0.053605[/C][/ROW]
[ROW][C]46[/C][C]-0.097823[/C][C]-0.8912[/C][C]0.187698[/C][/ROW]
[ROW][C]47[/C][C]0.120543[/C][C]1.0982[/C][C]0.137646[/C][/ROW]
[ROW][C]48[/C][C]0.415864[/C][C]3.7887[/C][C]0.000143[/C][/ROW]
[/TABLE]
Source: https://freestatistics.org/blog/index.php?pk=232542&T=1

Globally Unique Identifier (entire table): ba.freestatistics.org/blog/index.php?pk=232542&T=1

As an alternative you can also use a QR Code:  

The GUIDs for individual cells are displayed in the table below:

Autocorrelation Function
Time lag kACF(k)T-STATP-value
10.3165862.88420.002498
2-0.213313-1.94340.02768
3-0.391644-3.5683e-04
4-0.277885-2.53170.006619
5-0.003406-0.0310.487661
60.1878421.71130.045378
70.0269130.24520.403458
8-0.218091-1.98690.025116
9-0.338854-3.08710.001374
10-0.217375-1.98040.025487
110.24732.2530.013448
120.819297.46410
130.2613242.38080.009783
14-0.197855-1.80250.037545
15-0.325028-2.96110.001998
16-0.231277-2.1070.019066
170.0136020.12390.450839
180.1372431.25030.107344
190.0215070.19590.42257
20-0.19163-1.74580.04227
21-0.297376-2.70920.004095
22-0.192385-1.75270.041672
230.204441.86250.033033
240.66236.03380
250.2203432.00740.02398
26-0.155295-1.41480.080434
27-0.284754-2.59420.005603
28-0.194508-1.7720.040028
290.0125790.11460.454521
300.1145761.04380.149796
310.0339010.30890.379102
32-0.140426-1.27930.102171
33-0.22948-2.09070.019809
34-0.143534-1.30770.0973
350.1629051.48410.07078
360.5341934.86673e-06
370.1946111.7730.039949
38-0.111603-1.01680.156113
39-0.217484-1.98140.02543
40-0.14796-1.3480.090666
410.0096850.08820.464951
420.0969650.88340.189789
430.0111240.10130.45976
44-0.120715-1.09980.137307
45-0.178751-1.62850.053605
46-0.097823-0.89120.187698
470.1205431.09820.137646
480.4158643.78870.000143


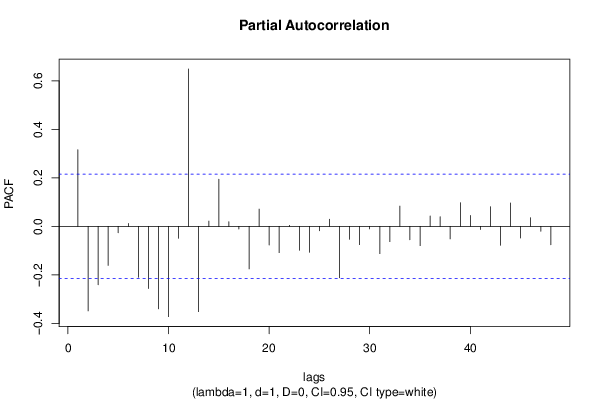
Partial Autocorrelation Function
Time lag kPACF(k)T-STATP-value
10.3165862.88420.002498
2-0.348465-3.17470.001053
3-0.240679-2.19270.015564
4-0.160805-1.4650.073349
5-0.026478-0.24120.404987
60.0116190.10590.457977
7-0.209826-1.91160.029689
8-0.25596-2.33190.011065
9-0.340165-3.09910.001325
10-0.372339-3.39220.000532
11-0.049073-0.44710.327992
120.6494735.9170
13-0.351782-3.20490.000959
140.0218470.1990.421362
150.1945241.77220.040015
160.0195070.17770.429688
17-0.010574-0.09630.461746
18-0.175296-1.5970.05703
190.0711860.64850.259214
20-0.076482-0.69680.243944
21-0.108304-0.98670.163331
220.0042170.03840.484722
23-0.098531-0.89770.185982
24-0.106524-0.97050.167314
25-0.017785-0.1620.435837
260.0298420.27190.393197
27-0.211571-1.92750.028668
28-0.052779-0.48080.315947
29-0.075233-0.68540.247498
30-0.01036-0.09440.462517
31-0.112422-1.02420.154355
32-0.062771-0.57190.284479
330.0837260.76280.223878
34-0.055419-0.50490.307486
35-0.079486-0.72420.235504
360.0432370.39390.347329
370.0399790.36420.358307
38-0.051625-0.47030.319679
390.0978030.8910.187745
400.0448550.40860.341925
41-0.012615-0.11490.454389
420.0808330.73640.231774
43-0.078188-0.71230.239129
440.0968620.88250.19004
45-0.047858-0.4360.33198
460.035860.32670.372359
47-0.019852-0.18090.428458
48-0.075539-0.68820.246625

\begin{tabular}{lllllllll}
\hline
Partial Autocorrelation Function \tabularnewline
Time lag k & PACF(k) & T-STAT & P-value \tabularnewline
1 & 0.316586 & 2.8842 & 0.002498 \tabularnewline
2 & -0.348465 & -3.1747 & 0.001053 \tabularnewline
3 & -0.240679 & -2.1927 & 0.015564 \tabularnewline
4 & -0.160805 & -1.465 & 0.073349 \tabularnewline
5 & -0.026478 & -0.2412 & 0.404987 \tabularnewline
6 & 0.011619 & 0.1059 & 0.457977 \tabularnewline
7 & -0.209826 & -1.9116 & 0.029689 \tabularnewline
8 & -0.25596 & -2.3319 & 0.011065 \tabularnewline
9 & -0.340165 & -3.0991 & 0.001325 \tabularnewline
10 & -0.372339 & -3.3922 & 0.000532 \tabularnewline
11 & -0.049073 & -0.4471 & 0.327992 \tabularnewline
12 & 0.649473 & 5.917 & 0 \tabularnewline
13 & -0.351782 & -3.2049 & 0.000959 \tabularnewline
14 & 0.021847 & 0.199 & 0.421362 \tabularnewline
15 & 0.194524 & 1.7722 & 0.040015 \tabularnewline
16 & 0.019507 & 0.1777 & 0.429688 \tabularnewline
17 & -0.010574 & -0.0963 & 0.461746 \tabularnewline
18 & -0.175296 & -1.597 & 0.05703 \tabularnewline
19 & 0.071186 & 0.6485 & 0.259214 \tabularnewline
20 & -0.076482 & -0.6968 & 0.243944 \tabularnewline
21 & -0.108304 & -0.9867 & 0.163331 \tabularnewline
22 & 0.004217 & 0.0384 & 0.484722 \tabularnewline
23 & -0.098531 & -0.8977 & 0.185982 \tabularnewline
24 & -0.106524 & -0.9705 & 0.167314 \tabularnewline
25 & -0.017785 & -0.162 & 0.435837 \tabularnewline
26 & 0.029842 & 0.2719 & 0.393197 \tabularnewline
27 & -0.211571 & -1.9275 & 0.028668 \tabularnewline
28 & -0.052779 & -0.4808 & 0.315947 \tabularnewline
29 & -0.075233 & -0.6854 & 0.247498 \tabularnewline
30 & -0.01036 & -0.0944 & 0.462517 \tabularnewline
31 & -0.112422 & -1.0242 & 0.154355 \tabularnewline
32 & -0.062771 & -0.5719 & 0.284479 \tabularnewline
33 & 0.083726 & 0.7628 & 0.223878 \tabularnewline
34 & -0.055419 & -0.5049 & 0.307486 \tabularnewline
35 & -0.079486 & -0.7242 & 0.235504 \tabularnewline
36 & 0.043237 & 0.3939 & 0.347329 \tabularnewline
37 & 0.039979 & 0.3642 & 0.358307 \tabularnewline
38 & -0.051625 & -0.4703 & 0.319679 \tabularnewline
39 & 0.097803 & 0.891 & 0.187745 \tabularnewline
40 & 0.044855 & 0.4086 & 0.341925 \tabularnewline
41 & -0.012615 & -0.1149 & 0.454389 \tabularnewline
42 & 0.080833 & 0.7364 & 0.231774 \tabularnewline
43 & -0.078188 & -0.7123 & 0.239129 \tabularnewline
44 & 0.096862 & 0.8825 & 0.19004 \tabularnewline
45 & -0.047858 & -0.436 & 0.33198 \tabularnewline
46 & 0.03586 & 0.3267 & 0.372359 \tabularnewline
47 & -0.019852 & -0.1809 & 0.428458 \tabularnewline
48 & -0.075539 & -0.6882 & 0.246625 \tabularnewline
\hline
\end{tabular}
%Source: https://freestatistics.org/blog/index.php?pk=232542&T=2

[TABLE]
[ROW][C]Partial Autocorrelation Function[/C][/ROW]
[ROW][C]Time lag k[/C][C]PACF(k)[/C][C]T-STAT[/C][C]P-value[/C][/ROW]
[ROW][C]1[/C][C]0.316586[/C][C]2.8842[/C][C]0.002498[/C][/ROW]
[ROW][C]2[/C][C]-0.348465[/C][C]-3.1747[/C][C]0.001053[/C][/ROW]
[ROW][C]3[/C][C]-0.240679[/C][C]-2.1927[/C][C]0.015564[/C][/ROW]
[ROW][C]4[/C][C]-0.160805[/C][C]-1.465[/C][C]0.073349[/C][/ROW]
[ROW][C]5[/C][C]-0.026478[/C][C]-0.2412[/C][C]0.404987[/C][/ROW]
[ROW][C]6[/C][C]0.011619[/C][C]0.1059[/C][C]0.457977[/C][/ROW]
[ROW][C]7[/C][C]-0.209826[/C][C]-1.9116[/C][C]0.029689[/C][/ROW]
[ROW][C]8[/C][C]-0.25596[/C][C]-2.3319[/C][C]0.011065[/C][/ROW]
[ROW][C]9[/C][C]-0.340165[/C][C]-3.0991[/C][C]0.001325[/C][/ROW]
[ROW][C]10[/C][C]-0.372339[/C][C]-3.3922[/C][C]0.000532[/C][/ROW]
[ROW][C]11[/C][C]-0.049073[/C][C]-0.4471[/C][C]0.327992[/C][/ROW]
[ROW][C]12[/C][C]0.649473[/C][C]5.917[/C][C]0[/C][/ROW]
[ROW][C]13[/C][C]-0.351782[/C][C]-3.2049[/C][C]0.000959[/C][/ROW]
[ROW][C]14[/C][C]0.021847[/C][C]0.199[/C][C]0.421362[/C][/ROW]
[ROW][C]15[/C][C]0.194524[/C][C]1.7722[/C][C]0.040015[/C][/ROW]
[ROW][C]16[/C][C]0.019507[/C][C]0.1777[/C][C]0.429688[/C][/ROW]
[ROW][C]17[/C][C]-0.010574[/C][C]-0.0963[/C][C]0.461746[/C][/ROW]
[ROW][C]18[/C][C]-0.175296[/C][C]-1.597[/C][C]0.05703[/C][/ROW]
[ROW][C]19[/C][C]0.071186[/C][C]0.6485[/C][C]0.259214[/C][/ROW]
[ROW][C]20[/C][C]-0.076482[/C][C]-0.6968[/C][C]0.243944[/C][/ROW]
[ROW][C]21[/C][C]-0.108304[/C][C]-0.9867[/C][C]0.163331[/C][/ROW]
[ROW][C]22[/C][C]0.004217[/C][C]0.0384[/C][C]0.484722[/C][/ROW]
[ROW][C]23[/C][C]-0.098531[/C][C]-0.8977[/C][C]0.185982[/C][/ROW]
[ROW][C]24[/C][C]-0.106524[/C][C]-0.9705[/C][C]0.167314[/C][/ROW]
[ROW][C]25[/C][C]-0.017785[/C][C]-0.162[/C][C]0.435837[/C][/ROW]
[ROW][C]26[/C][C]0.029842[/C][C]0.2719[/C][C]0.393197[/C][/ROW]
[ROW][C]27[/C][C]-0.211571[/C][C]-1.9275[/C][C]0.028668[/C][/ROW]
[ROW][C]28[/C][C]-0.052779[/C][C]-0.4808[/C][C]0.315947[/C][/ROW]
[ROW][C]29[/C][C]-0.075233[/C][C]-0.6854[/C][C]0.247498[/C][/ROW]
[ROW][C]30[/C][C]-0.01036[/C][C]-0.0944[/C][C]0.462517[/C][/ROW]
[ROW][C]31[/C][C]-0.112422[/C][C]-1.0242[/C][C]0.154355[/C][/ROW]
[ROW][C]32[/C][C]-0.062771[/C][C]-0.5719[/C][C]0.284479[/C][/ROW]
[ROW][C]33[/C][C]0.083726[/C][C]0.7628[/C][C]0.223878[/C][/ROW]
[ROW][C]34[/C][C]-0.055419[/C][C]-0.5049[/C][C]0.307486[/C][/ROW]
[ROW][C]35[/C][C]-0.079486[/C][C]-0.7242[/C][C]0.235504[/C][/ROW]
[ROW][C]36[/C][C]0.043237[/C][C]0.3939[/C][C]0.347329[/C][/ROW]
[ROW][C]37[/C][C]0.039979[/C][C]0.3642[/C][C]0.358307[/C][/ROW]
[ROW][C]38[/C][C]-0.051625[/C][C]-0.4703[/C][C]0.319679[/C][/ROW]
[ROW][C]39[/C][C]0.097803[/C][C]0.891[/C][C]0.187745[/C][/ROW]
[ROW][C]40[/C][C]0.044855[/C][C]0.4086[/C][C]0.341925[/C][/ROW]
[ROW][C]41[/C][C]-0.012615[/C][C]-0.1149[/C][C]0.454389[/C][/ROW]
[ROW][C]42[/C][C]0.080833[/C][C]0.7364[/C][C]0.231774[/C][/ROW]
[ROW][C]43[/C][C]-0.078188[/C][C]-0.7123[/C][C]0.239129[/C][/ROW]
[ROW][C]44[/C][C]0.096862[/C][C]0.8825[/C][C]0.19004[/C][/ROW]
[ROW][C]45[/C][C]-0.047858[/C][C]-0.436[/C][C]0.33198[/C][/ROW]
[ROW][C]46[/C][C]0.03586[/C][C]0.3267[/C][C]0.372359[/C][/ROW]
[ROW][C]47[/C][C]-0.019852[/C][C]-0.1809[/C][C]0.428458[/C][/ROW]
[ROW][C]48[/C][C]-0.075539[/C][C]-0.6882[/C][C]0.246625[/C][/ROW]
[/TABLE]
Source: https://freestatistics.org/blog/index.php?pk=232542&T=2

Globally Unique Identifier (entire table): ba.freestatistics.org/blog/index.php?pk=232542&T=2

As an alternative you can also use a QR Code:  

The GUIDs for individual cells are displayed in the table below:

Partial Autocorrelation Function
Time lag kPACF(k)T-STATP-value
10.3165862.88420.002498
2-0.348465-3.17470.001053
3-0.240679-2.19270.015564
4-0.160805-1.4650.073349
5-0.026478-0.24120.404987
60.0116190.10590.457977
7-0.209826-1.91160.029689
8-0.25596-2.33190.011065
9-0.340165-3.09910.001325
10-0.372339-3.39220.000532
11-0.049073-0.44710.327992
120.6494735.9170
13-0.351782-3.20490.000959
140.0218470.1990.421362
150.1945241.77220.040015
160.0195070.17770.429688
17-0.010574-0.09630.461746
18-0.175296-1.5970.05703
190.0711860.64850.259214
20-0.076482-0.69680.243944
21-0.108304-0.98670.163331
220.0042170.03840.484722
23-0.098531-0.89770.185982
24-0.106524-0.97050.167314
25-0.017785-0.1620.435837
260.0298420.27190.393197
27-0.211571-1.92750.028668
28-0.052779-0.48080.315947
29-0.075233-0.68540.247498
30-0.01036-0.09440.462517
31-0.112422-1.02420.154355
32-0.062771-0.57190.284479
330.0837260.76280.223878
34-0.055419-0.50490.307486
35-0.079486-0.72420.235504
360.0432370.39390.347329
370.0399790.36420.358307
38-0.051625-0.47030.319679
390.0978030.8910.187745
400.0448550.40860.341925
41-0.012615-0.11490.454389
420.0808330.73640.231774
43-0.078188-0.71230.239129
440.0968620.88250.19004
45-0.047858-0.4360.33198
460.035860.32670.372359
47-0.019852-0.18090.428458
48-0.075539-0.68820.246625


Parameters (Session):
par1 = 48 ; par2 = 1 ; par3 = 1 ; par4 = 0 ; par5 = 12 ; par6 = White Noise ; par7 = 0.95 ;
Parameters (R input):
par1 = 48 ; par2 = 1 ; par3 = 1 ; par4 = 0 ; par5 = 12 ; par6 = White Noise ; par7 = 0.95 ; par8 = ;
R code (references can be found in the software module):
par8 <- ''
par7 <- '0.95'
par6 <- 'White Noise'
par5 <- '12'
par4 <- '0'
par3 <- '0'
par2 <- '1'
par1 <- '48'
if (par1 == 'Default') {
par1 = 10*log10(length(x))
} else {
par1 <- as.numeric(par1)
}
par2 <- as.numeric(par2)
par3 <- as.numeric(par3)
par4 <- as.numeric(par4)
par5 <- as.numeric(par5)
if (par6 == 'White Noise') par6 <- 'white' else par6 <- 'ma'
par7 <- as.numeric(par7)
if (par8 != '') par8 <- as.numeric(par8)
ox <- x
if (par8 == '') {
if (par2 == 0) {
x <- log(x)
} else {
x <- (x ^ par2 - 1) / par2
}
} else {
x <- log(x,base=par8)
}
if (par3 > 0) x <- diff(x,lag=1,difference=par3)
if (par4 > 0) x <- diff(x,lag=par5,difference=par4)
bitmap(file='picts.png')
op <- par(mfrow=c(2,1))
plot(ox,type='l',main='Original Time Series',xlab='time',ylab='value')
if (par8=='') {
mytitle <- paste('Working Time Series (lambda=',par2,', d=',par3,', D=',par4,')',sep='')
mysub <- paste('(lambda=',par2,', d=',par3,', D=',par4,', CI=', par7, ', CI type=',par6,')',sep='')
} else {
mytitle <- paste('Working Time Series (base=',par8,', d=',par3,', D=',par4,')',sep='')
mysub <- paste('(base=',par8,', d=',par3,', D=',par4,', CI=', par7, ', CI type=',par6,')',sep='')
}
plot(x,type='l', main=mytitle,xlab='time',ylab='value')
par(op)
dev.off()
bitmap(file='pic1.png')
racf <- acf(x, par1, main='Autocorrelation', xlab='time lag', ylab='ACF', ci.type=par6, ci=par7, sub=mysub)
dev.off()
bitmap(file='pic2.png')
rpacf <- pacf(x,par1,main='Partial Autocorrelation',xlab='lags',ylab='PACF',sub=mysub)
dev.off()
(myacf <- c(racf$acf))
(mypacf <- c(rpacf$acf))
lengthx <- length(x)
sqrtn <- sqrt(lengthx)
load(file='createtable')
a<-table.start()
a<-table.row.start(a)
a<-table.element(a,'Autocorrelation Function',4,TRUE)
a<-table.row.end(a)
a<-table.row.start(a)
a<-table.element(a,'Time lag k',header=TRUE)
a<-table.element(a,hyperlink('basics.htm','ACF(k)','click here for more information about the Autocorrelation Function'),header=TRUE)
a<-table.element(a,'T-STAT',header=TRUE)
a<-table.element(a,'P-value',header=TRUE)
a<-table.row.end(a)
for (i in 2:(par1+1)) {
a<-table.row.start(a)
a<-table.element(a,i-1,header=TRUE)
a<-table.element(a,round(myacf[i],6))
mytstat <- myacf[i]*sqrtn
a<-table.element(a,round(mytstat,4))
a<-table.element(a,round(1-pt(abs(mytstat),lengthx),6))
a<-table.row.end(a)
}
a<-table.end(a)
table.save(a,file='mytable.tab')
a<-table.start()
a<-table.row.start(a)
a<-table.element(a,'Partial Autocorrelation Function',4,TRUE)
a<-table.row.end(a)
a<-table.row.start(a)
a<-table.element(a,'Time lag k',header=TRUE)
a<-table.element(a,hyperlink('basics.htm','PACF(k)','click here for more information about the Partial Autocorrelation Function'),header=TRUE)
a<-table.element(a,'T-STAT',header=TRUE)
a<-table.element(a,'P-value',header=TRUE)
a<-table.row.end(a)
for (i in 1:par1) {
a<-table.row.start(a)
a<-table.element(a,i,header=TRUE)
a<-table.element(a,round(mypacf[i],6))
mytstat <- mypacf[i]*sqrtn
a<-table.element(a,round(mytstat,4))
a<-table.element(a,round(1-pt(abs(mytstat),lengthx),6))
a<-table.row.end(a)
}
a<-table.end(a)
table.save(a,file='mytable1.tab')