Free Statistics
of Irreproducible Research!
Description of Statistical Computation | |||||||||||||||||||||||||||||||||||||||||||||||||||||||||||||||||||||||||||||||||||||||||||||||||||||||||||||||||||||||||||||||||||||||||||||||||||||||||||||||||||||||||
|---|---|---|---|---|---|---|---|---|---|---|---|---|---|---|---|---|---|---|---|---|---|---|---|---|---|---|---|---|---|---|---|---|---|---|---|---|---|---|---|---|---|---|---|---|---|---|---|---|---|---|---|---|---|---|---|---|---|---|---|---|---|---|---|---|---|---|---|---|---|---|---|---|---|---|---|---|---|---|---|---|---|---|---|---|---|---|---|---|---|---|---|---|---|---|---|---|---|---|---|---|---|---|---|---|---|---|---|---|---|---|---|---|---|---|---|---|---|---|---|---|---|---|---|---|---|---|---|---|---|---|---|---|---|---|---|---|---|---|---|---|---|---|---|---|---|---|---|---|---|---|---|---|---|---|---|---|---|---|---|---|---|---|---|---|---|---|---|---|---|
| Author's title | |||||||||||||||||||||||||||||||||||||||||||||||||||||||||||||||||||||||||||||||||||||||||||||||||||||||||||||||||||||||||||||||||||||||||||||||||||||||||||||||||||||||||
| Author | *The author of this computation has been verified* | ||||||||||||||||||||||||||||||||||||||||||||||||||||||||||||||||||||||||||||||||||||||||||||||||||||||||||||||||||||||||||||||||||||||||||||||||||||||||||||||||||||||||
| R Software Module | rwasp_twosampletests_mean.wasp | ||||||||||||||||||||||||||||||||||||||||||||||||||||||||||||||||||||||||||||||||||||||||||||||||||||||||||||||||||||||||||||||||||||||||||||||||||||||||||||||||||||||||
| Title produced by software | Paired and Unpaired Two Samples Tests about the Mean | ||||||||||||||||||||||||||||||||||||||||||||||||||||||||||||||||||||||||||||||||||||||||||||||||||||||||||||||||||||||||||||||||||||||||||||||||||||||||||||||||||||||||
| Date of computation | Thu, 25 Oct 2012 07:51:54 -0400 | ||||||||||||||||||||||||||||||||||||||||||||||||||||||||||||||||||||||||||||||||||||||||||||||||||||||||||||||||||||||||||||||||||||||||||||||||||||||||||||||||||||||||
| Cite this page as follows | Statistical Computations at FreeStatistics.org, Office for Research Development and Education, URL https://freestatistics.org/blog/index.php?v=date/2012/Oct/25/t1351165943r4yazt9lyxxl7tr.htm/, Retrieved Sat, 27 Apr 2024 08:35:57 +0000 | ||||||||||||||||||||||||||||||||||||||||||||||||||||||||||||||||||||||||||||||||||||||||||||||||||||||||||||||||||||||||||||||||||||||||||||||||||||||||||||||||||||||||
| Statistical Computations at FreeStatistics.org, Office for Research Development and Education, URL https://freestatistics.org/blog/index.php?pk=183558, Retrieved Sat, 27 Apr 2024 08:35:57 +0000 | |||||||||||||||||||||||||||||||||||||||||||||||||||||||||||||||||||||||||||||||||||||||||||||||||||||||||||||||||||||||||||||||||||||||||||||||||||||||||||||||||||||||||
| QR Codes: | |||||||||||||||||||||||||||||||||||||||||||||||||||||||||||||||||||||||||||||||||||||||||||||||||||||||||||||||||||||||||||||||||||||||||||||||||||||||||||||||||||||||||
|
| |||||||||||||||||||||||||||||||||||||||||||||||||||||||||||||||||||||||||||||||||||||||||||||||||||||||||||||||||||||||||||||||||||||||||||||||||||||||||||||||||||||||||
| Original text written by user: | |||||||||||||||||||||||||||||||||||||||||||||||||||||||||||||||||||||||||||||||||||||||||||||||||||||||||||||||||||||||||||||||||||||||||||||||||||||||||||||||||||||||||
| IsPrivate? | No (this computation is public) | ||||||||||||||||||||||||||||||||||||||||||||||||||||||||||||||||||||||||||||||||||||||||||||||||||||||||||||||||||||||||||||||||||||||||||||||||||||||||||||||||||||||||
| User-defined keywords | Treatment T | ||||||||||||||||||||||||||||||||||||||||||||||||||||||||||||||||||||||||||||||||||||||||||||||||||||||||||||||||||||||||||||||||||||||||||||||||||||||||||||||||||||||||
| Estimated Impact | 132 | ||||||||||||||||||||||||||||||||||||||||||||||||||||||||||||||||||||||||||||||||||||||||||||||||||||||||||||||||||||||||||||||||||||||||||||||||||||||||||||||||||||||||
Tree of Dependent Computations | |||||||||||||||||||||||||||||||||||||||||||||||||||||||||||||||||||||||||||||||||||||||||||||||||||||||||||||||||||||||||||||||||||||||||||||||||||||||||||||||||||||||||
| Family? (F = Feedback message, R = changed R code, M = changed R Module, P = changed Parameters, D = changed Data) | |||||||||||||||||||||||||||||||||||||||||||||||||||||||||||||||||||||||||||||||||||||||||||||||||||||||||||||||||||||||||||||||||||||||||||||||||||||||||||||||||||||||||
| - [Paired and Unpaired Two Samples Tests about the Mean] [WS 5 Opdracht 2] [2012-10-25 11:32:11] [64c86865dff7d646747b84f713e71815] - R D [Paired and Unpaired Two Samples Tests about the Mean] [WS 5 Opdracht 3] [2012-10-25 11:38:10] [64c86865dff7d646747b84f713e71815] - D [Paired and Unpaired Two Samples Tests about the Mean] [WS 5 Opdracht 2 (...] [2012-10-25 11:51:54] [46cc0db4bd6f6541b375e62191991224] [Current] - D [Paired and Unpaired Two Samples Tests about the Mean] [WS 5 Opdracht 3 (...] [2012-10-25 11:53:44] [64c86865dff7d646747b84f713e71815] - PD [Paired and Unpaired Two Samples Tests about the Mean] [WS 5 Opdracht 5] [2012-10-25 12:00:47] [64c86865dff7d646747b84f713e71815] - D [Paired and Unpaired Two Samples Tests about the Mean] [WS 5 Opdracht 5 (...] [2012-10-25 12:04:25] [64c86865dff7d646747b84f713e71815] - D [Paired and Unpaired Two Samples Tests about the Mean] [WS 5 Opdracht 5 (...] [2012-10-25 12:09:38] [64c86865dff7d646747b84f713e71815] - RMPD [One-Way-Between-Groups ANOVA- Free Statistics Software (Calculator)] [WS 5 Opdracht 6] [2012-10-25 12:20:17] [64c86865dff7d646747b84f713e71815] - R [One-Way-Between-Groups ANOVA- Free Statistics Software (Calculator)] [WS5 Opdracht 6 La...] [2012-10-25 12:34:24] [64c86865dff7d646747b84f713e71815] - RM D [Two-Way ANOVA] [WS 5 Opdracht 8] [2012-10-25 12:40:46] [64c86865dff7d646747b84f713e71815] - R P [Two-Way ANOVA] [WS5_Q8] [2012-10-25 14:16:45] [16b33a6b6ea04a122abfa008e94b9809] - R D [One-Way-Between-Groups ANOVA- Free Statistics Software (Calculator)] [WS 5 Opdracht 7 K...] [2012-10-25 13:05:08] [64c86865dff7d646747b84f713e71815] - R [One-Way-Between-Groups ANOVA- Free Statistics Software (Calculator)] [WS 5 Opdracht 7 L...] [2012-10-25 13:12:49] [64c86865dff7d646747b84f713e71815] - P [One-Way-Between-Groups ANOVA- Free Statistics Software (Calculator)] [WS5_Q7_korte termijn] [2012-10-25 14:03:05] [16b33a6b6ea04a122abfa008e94b9809] - P [One-Way-Between-Groups ANOVA- Free Statistics Software (Calculator)] [WS5_Q7_lange termijn] [2012-10-25 14:07:37] [16b33a6b6ea04a122abfa008e94b9809] - R [Paired and Unpaired Two Samples Tests about the Mean] [WS5_Q5_E] [2012-10-25 13:16:37] [16b33a6b6ea04a122abfa008e94b9809] - D [Paired and Unpaired Two Samples Tests about the Mean] [WS5_Q5_S] [2012-10-25 13:25:27] [16b33a6b6ea04a122abfa008e94b9809] - RM D [One-Way-Between-Groups ANOVA- Free Statistics Software (Calculator)] [WS5_Q6_korte termijn] [2012-10-25 13:42:15] [16b33a6b6ea04a122abfa008e94b9809] - R PD [One-Way-Between-Groups ANOVA- Free Statistics Software (Calculator)] [Paper Deel 5 ANOV...] [2012-12-18 19:25:34] [16b33a6b6ea04a122abfa008e94b9809] - R [One-Way-Between-Groups ANOVA- Free Statistics Software (Calculator)] [PAPER ANOVA deel 5] [2012-12-20 15:14:54] [4beecb4e29f2a257543dd9eec92fc58e] - D [One-Way-Between-Groups ANOVA- Free Statistics Software (Calculator)] [PAPER ANOVA T40 ...] [2012-12-20 17:09:28] [4beecb4e29f2a257543dd9eec92fc58e] - R PD [One-Way-Between-Groups ANOVA- Free Statistics Software (Calculator)] [Paper Deel 5: One...] [2012-12-20 16:46:53] [fe52c9364b5a1ce87739c78bce22047a] - R D [One-Way-Between-Groups ANOVA- Free Statistics Software (Calculator)] [Paper Deel 5: One...] [2012-12-20 16:58:51] [fe52c9364b5a1ce87739c78bce22047a] - MP [One-Way-Between-Groups ANOVA- Free Statistics Software (Calculator)] [PAPER ANOVA T20 ...] [2012-12-20 17:15:44] [4beecb4e29f2a257543dd9eec92fc58e] - RMP [One-Way-Between-Groups ANOVA- Free Statistics Software (Calculator)] [PAPER ANOVA T40 ...] [2012-12-20 17:14:29] [4beecb4e29f2a257543dd9eec92fc58e] - RMPD [Multiple Regression] [Paper Deel 5: Mul...] [2012-12-21 12:23:30] [fe52c9364b5a1ce87739c78bce22047a] - R D [Multiple Regression] [Paper Deel 5: Mul...] [2012-12-21 13:35:00] [fe52c9364b5a1ce87739c78bce22047a] - R PD [One-Way-Between-Groups ANOVA- Free Statistics Software (Calculator)] [Paper Deel 5 ANOV...] [2012-12-18 19:32:48] [16b33a6b6ea04a122abfa008e94b9809] - RMP [One-Way-Between-Groups ANOVA- Free Statistics Software (Calculator)] [PAPER ANOVA deel ...] [2012-12-20 15:15:49] [4beecb4e29f2a257543dd9eec92fc58e] - RMPD [Multiple Regression] [Paper Deel 5 Muti...] [2012-12-18 19:41:13] [16b33a6b6ea04a122abfa008e94b9809] - RMP [Multiple Regression] [PAPER MR T40/T20 ...] [2012-12-20 16:11:15] [4beecb4e29f2a257543dd9eec92fc58e] - RM D [One-Way-Between-Groups ANOVA- Free Statistics Software (Calculator)] [WS5_Q6_lange termijn] [2012-10-25 13:49:51] [16b33a6b6ea04a122abfa008e94b9809] - M [Paired and Unpaired Two Samples Tests about the Mean] [WS5_Q5_E] [2012-10-25 13:23:01] [16b33a6b6ea04a122abfa008e94b9809] | |||||||||||||||||||||||||||||||||||||||||||||||||||||||||||||||||||||||||||||||||||||||||||||||||||||||||||||||||||||||||||||||||||||||||||||||||||||||||||||||||||||||||
| Feedback Forum | |||||||||||||||||||||||||||||||||||||||||||||||||||||||||||||||||||||||||||||||||||||||||||||||||||||||||||||||||||||||||||||||||||||||||||||||||||||||||||||||||||||||||
Post a new message | |||||||||||||||||||||||||||||||||||||||||||||||||||||||||||||||||||||||||||||||||||||||||||||||||||||||||||||||||||||||||||||||||||||||||||||||||||||||||||||||||||||||||
Dataset | |||||||||||||||||||||||||||||||||||||||||||||||||||||||||||||||||||||||||||||||||||||||||||||||||||||||||||||||||||||||||||||||||||||||||||||||||||||||||||||||||||||||||
| Dataseries X: | |||||||||||||||||||||||||||||||||||||||||||||||||||||||||||||||||||||||||||||||||||||||||||||||||||||||||||||||||||||||||||||||||||||||||||||||||||||||||||||||||||||||||
1 1 4 0 2 1 1 0 0 2 0 1 4 1 1.5 0 0 0 0 0 1 1 0 1 1 1 1 0 1 2 1 1 0 1 2 0 1 0 1 1 0 1 4 1 2 1 1 1 0 2 0 0 4 0 2 0 1 0 1 0 0 1 2 1 0 0 1 0 0 2 0 0 0 NA NA 1 1 0 1 2 1 1 1 0 2 1 1 0 1 0.5 0 1 0 1 2 0 0 2 1 0 1 1 2 1 2 1 1 1 0 0 0 0 2 NA NA 1 0 0 NA NA 1 1 3 1 2 1 0 0 1 0 1 1 0 NA NA 0 0 0 NA NA 0 0 1 0 2 1 1 0 1 1 1 0 0 0 0.5 1 1 4 0 2 0 0 0 1 0.5 0 0 1 NA NA 0 0 0 1 0.5 1 1 0 NA NA 1 1 4 0 2 | |||||||||||||||||||||||||||||||||||||||||||||||||||||||||||||||||||||||||||||||||||||||||||||||||||||||||||||||||||||||||||||||||||||||||||||||||||||||||||||||||||||||||
Tables (Output of Computation) | |||||||||||||||||||||||||||||||||||||||||||||||||||||||||||||||||||||||||||||||||||||||||||||||||||||||||||||||||||||||||||||||||||||||||||||||||||||||||||||||||||||||||
| |||||||||||||||||||||||||||||||||||||||||||||||||||||||||||||||||||||||||||||||||||||||||||||||||||||||||||||||||||||||||||||||||||||||||||||||||||||||||||||||||||||||||
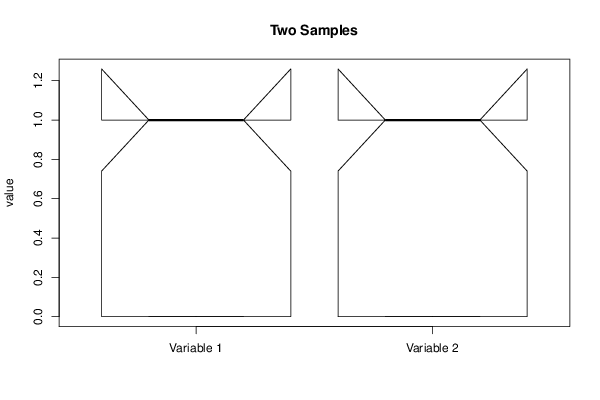
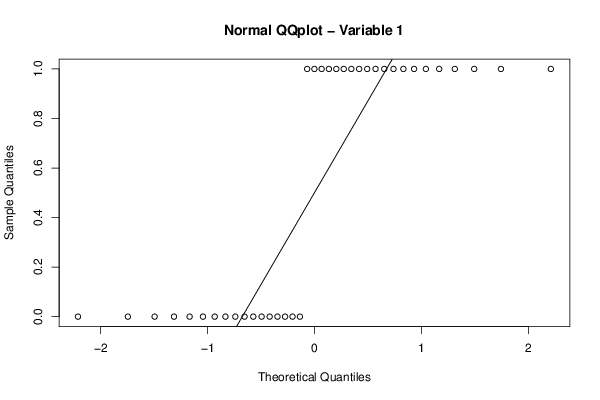
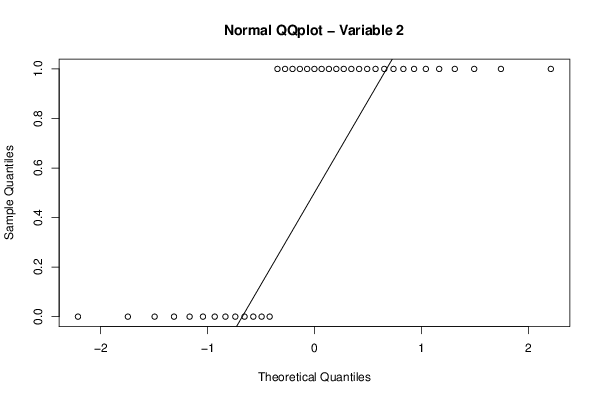
Figures (Output of Computation) | |||||||||||||||||||||||||||||||||||||||||||||||||||||||||||||||||||||||||||||||||||||||||||||||||||||||||||||||||||||||||||||||||||||||||||||||||||||||||||||||||||||||||
Input Parameters & R Code | |||||||||||||||||||||||||||||||||||||||||||||||||||||||||||||||||||||||||||||||||||||||||||||||||||||||||||||||||||||||||||||||||||||||||||||||||||||||||||||||||||||||||
| Parameters (Session): | |||||||||||||||||||||||||||||||||||||||||||||||||||||||||||||||||||||||||||||||||||||||||||||||||||||||||||||||||||||||||||||||||||||||||||||||||||||||||||||||||||||||||
| par1 = 1 ; par2 = 2 ; par3 = 0.95 ; par4 = two.sided ; par5 = paired ; par6 = 0.0 ; | |||||||||||||||||||||||||||||||||||||||||||||||||||||||||||||||||||||||||||||||||||||||||||||||||||||||||||||||||||||||||||||||||||||||||||||||||||||||||||||||||||||||||
| Parameters (R input): | |||||||||||||||||||||||||||||||||||||||||||||||||||||||||||||||||||||||||||||||||||||||||||||||||||||||||||||||||||||||||||||||||||||||||||||||||||||||||||||||||||||||||
| par1 = 1 ; par2 = 2 ; par3 = 0.95 ; par4 = two.sided ; par5 = paired ; par6 = 0.0 ; | |||||||||||||||||||||||||||||||||||||||||||||||||||||||||||||||||||||||||||||||||||||||||||||||||||||||||||||||||||||||||||||||||||||||||||||||||||||||||||||||||||||||||
| R code (references can be found in the software module): | |||||||||||||||||||||||||||||||||||||||||||||||||||||||||||||||||||||||||||||||||||||||||||||||||||||||||||||||||||||||||||||||||||||||||||||||||||||||||||||||||||||||||
par1 <- as.numeric(par1) #column number of first sample | |||||||||||||||||||||||||||||||||||||||||||||||||||||||||||||||||||||||||||||||||||||||||||||||||||||||||||||||||||||||||||||||||||||||||||||||||||||||||||||||||||||||||