Free Statistics
of Irreproducible Research!
Description of Statistical Computation | |||||||||||||||||||||||||||||||||||||||||||||||||||||||||||||||||||||||||||||||||||||||||||||||||||||||||||||||||||||||||||||||||||||||||||||||||||||||||||||||||||||||||||||||||||||
|---|---|---|---|---|---|---|---|---|---|---|---|---|---|---|---|---|---|---|---|---|---|---|---|---|---|---|---|---|---|---|---|---|---|---|---|---|---|---|---|---|---|---|---|---|---|---|---|---|---|---|---|---|---|---|---|---|---|---|---|---|---|---|---|---|---|---|---|---|---|---|---|---|---|---|---|---|---|---|---|---|---|---|---|---|---|---|---|---|---|---|---|---|---|---|---|---|---|---|---|---|---|---|---|---|---|---|---|---|---|---|---|---|---|---|---|---|---|---|---|---|---|---|---|---|---|---|---|---|---|---|---|---|---|---|---|---|---|---|---|---|---|---|---|---|---|---|---|---|---|---|---|---|---|---|---|---|---|---|---|---|---|---|---|---|---|---|---|---|---|---|---|---|---|---|---|---|---|---|---|---|---|
| Author's title | |||||||||||||||||||||||||||||||||||||||||||||||||||||||||||||||||||||||||||||||||||||||||||||||||||||||||||||||||||||||||||||||||||||||||||||||||||||||||||||||||||||||||||||||||||||
| Author | *The author of this computation has been verified* | ||||||||||||||||||||||||||||||||||||||||||||||||||||||||||||||||||||||||||||||||||||||||||||||||||||||||||||||||||||||||||||||||||||||||||||||||||||||||||||||||||||||||||||||||||||
| R Software Module | rwasp_samplenorm.wasp | ||||||||||||||||||||||||||||||||||||||||||||||||||||||||||||||||||||||||||||||||||||||||||||||||||||||||||||||||||||||||||||||||||||||||||||||||||||||||||||||||||||||||||||||||||||
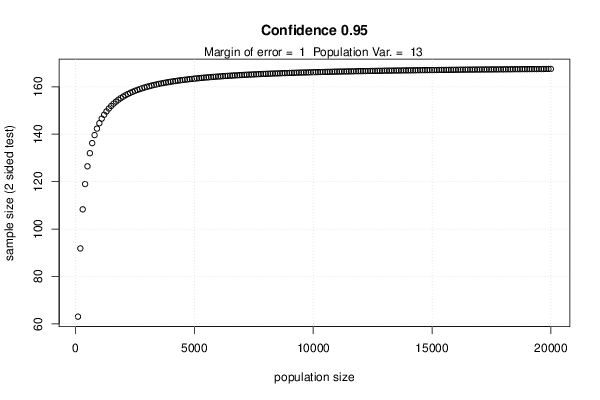
| Title produced by software | Minimum Sample Size - Testing Mean | ||||||||||||||||||||||||||||||||||||||||||||||||||||||||||||||||||||||||||||||||||||||||||||||||||||||||||||||||||||||||||||||||||||||||||||||||||||||||||||||||||||||||||||||||||||
| Date of computation | Sat, 20 Oct 2012 10:06:14 -0400 | ||||||||||||||||||||||||||||||||||||||||||||||||||||||||||||||||||||||||||||||||||||||||||||||||||||||||||||||||||||||||||||||||||||||||||||||||||||||||||||||||||||||||||||||||||||
| Cite this page as follows | Statistical Computations at FreeStatistics.org, Office for Research Development and Education, URL https://freestatistics.org/blog/index.php?v=date/2012/Oct/20/t1350741986fw2kzm9i3xroqbd.htm/, Retrieved Tue, 19 May 2026 19:47:47 +0000 | ||||||||||||||||||||||||||||||||||||||||||||||||||||||||||||||||||||||||||||||||||||||||||||||||||||||||||||||||||||||||||||||||||||||||||||||||||||||||||||||||||||||||||||||||||||
| Statistical Computations at FreeStatistics.org, Office for Research Development and Education, URL https://freestatistics.org/blog/index.php?pk=180515, Retrieved Tue, 19 May 2026 19:47:47 +0000 | |||||||||||||||||||||||||||||||||||||||||||||||||||||||||||||||||||||||||||||||||||||||||||||||||||||||||||||||||||||||||||||||||||||||||||||||||||||||||||||||||||||||||||||||||||||
| QR Codes: | |||||||||||||||||||||||||||||||||||||||||||||||||||||||||||||||||||||||||||||||||||||||||||||||||||||||||||||||||||||||||||||||||||||||||||||||||||||||||||||||||||||||||||||||||||||
|
| |||||||||||||||||||||||||||||||||||||||||||||||||||||||||||||||||||||||||||||||||||||||||||||||||||||||||||||||||||||||||||||||||||||||||||||||||||||||||||||||||||||||||||||||||||||
| Original text written by user: | |||||||||||||||||||||||||||||||||||||||||||||||||||||||||||||||||||||||||||||||||||||||||||||||||||||||||||||||||||||||||||||||||||||||||||||||||||||||||||||||||||||||||||||||||||||
| IsPrivate? | No (this computation is public) | ||||||||||||||||||||||||||||||||||||||||||||||||||||||||||||||||||||||||||||||||||||||||||||||||||||||||||||||||||||||||||||||||||||||||||||||||||||||||||||||||||||||||||||||||||||
| User-defined keywords | |||||||||||||||||||||||||||||||||||||||||||||||||||||||||||||||||||||||||||||||||||||||||||||||||||||||||||||||||||||||||||||||||||||||||||||||||||||||||||||||||||||||||||||||||||||
| Estimated Impact | 364 | ||||||||||||||||||||||||||||||||||||||||||||||||||||||||||||||||||||||||||||||||||||||||||||||||||||||||||||||||||||||||||||||||||||||||||||||||||||||||||||||||||||||||||||||||||||
Tree of Dependent Computations | |||||||||||||||||||||||||||||||||||||||||||||||||||||||||||||||||||||||||||||||||||||||||||||||||||||||||||||||||||||||||||||||||||||||||||||||||||||||||||||||||||||||||||||||||||||
| Family? (F = Feedback message, R = changed R code, M = changed R Module, P = changed Parameters, D = changed Data) | |||||||||||||||||||||||||||||||||||||||||||||||||||||||||||||||||||||||||||||||||||||||||||||||||||||||||||||||||||||||||||||||||||||||||||||||||||||||||||||||||||||||||||||||||||||
| - [Minimum Sample Size - Testing Mean] [WS 4 vraag 11 2] [2012-10-20 14:06:14] [4c93b3a0c48c946a3a36627369b78a37] [Current] - P [Minimum Sample Size - Testing Mean] [WS 4: vraag 11] [2012-10-22 12:46:46] [5971e03025aa6333f85f7b726952428d] - R P [Minimum Sample Size - Testing Mean] [WS 4: vraag 8 sam...] [2012-10-22 12:52:05] [5971e03025aa6333f85f7b726952428d] - RMP [Testing Variance - p-value (probability)] [WS 4: vraag 8] [2012-10-22 12:57:30] [5971e03025aa6333f85f7b726952428d] - R [Testing Variance - p-value (probability)] [WS 4] [2012-10-22 13:05:02] [5971e03025aa6333f85f7b726952428d] - MP [Testing Variance - p-value (probability)] [Workshop 4 - task 8] [2012-10-23 20:07:41] [7dcdf88f8d4909016d1a598b3c226ce5] - R P [Testing Variance - p-value (probability)] [WS 4 Vraag 8.1] [2012-10-23 07:52:54] [f8ee2fa4f3a14474001c30fec05fcd2b] - RMPD [Variability] [Variantie Mannen 8] [2012-10-23 12:14:40] [77d02b0cf2cecd023ffa9a06f056f18d] - R D [Variability] [Variance female I1] [2012-10-23 12:21:48] [77d02b0cf2cecd023ffa9a06f056f18d] - P [Variability] [W4 - vraag 8M var...] [2012-10-24 00:55:38] [3ae574fa1d645ef9b19cadb6c0dbd022] - RM [Variability] [W4 - vraag 8M var...] [2012-10-24 00:56:27] [3ae574fa1d645ef9b19cadb6c0dbd022] - D [Variability] [W4 - vraag 8F var...] [2012-10-24 00:58:26] [3ae574fa1d645ef9b19cadb6c0dbd022] - R P [Testing Variance - p-value (probability)] [Workshop 4 - task 9] [2012-10-23 20:02:26] [7dcdf88f8d4909016d1a598b3c226ce5] - RMP [Testing Variance - Critical Value (Region)] [WS 4: vraag 8 mannen] [2012-10-22 12:59:14] [5971e03025aa6333f85f7b726952428d] - RM D [Variability] [WS 4: vraag 8 var...] [2012-10-22 13:01:46] [5971e03025aa6333f85f7b726952428d] - R [Testing Variance - Critical Value (Region)] [WS 4] [2012-10-22 13:05:47] [5971e03025aa6333f85f7b726952428d] - P [Testing Variance - Critical Value (Region)] [Workshop 4 - task...] [2012-10-23 20:08:32] [7dcdf88f8d4909016d1a598b3c226ce5] - P [Testing Variance - Critical Value (Region)] [WS 4 Vraag 8.2] [2012-10-23 07:58:02] [f8ee2fa4f3a14474001c30fec05fcd2b] - RMPD [Variability] [WS 4 Vraag 8.3] [2012-10-23 08:01:25] [f8ee2fa4f3a14474001c30fec05fcd2b] - RMP [Testing Variance - p-value (probability)] [WS 4 Vraag 8.4] [2012-10-23 08:06:25] [f8ee2fa4f3a14474001c30fec05fcd2b] - R P [Testing Variance - p-value (probability)] [WS4 Variantie 2] [2012-12-16 13:31:23] [f8ee2fa4f3a14474001c30fec05fcd2b] - R P [Testing Variance - p-value (probability)] [WS4 Variantie 2] [2012-12-16 13:31:23] [f8ee2fa4f3a14474001c30fec05fcd2b] - R P [Testing Variance - p-value (probability)] [WS4 Variantie 2] [2012-12-16 13:31:23] [f8ee2fa4f3a14474001c30fec05fcd2b] - P [Testing Variance - Critical Value (Region)] [WS 4 Vraag 8.5] [2012-10-23 08:07:43] [f8ee2fa4f3a14474001c30fec05fcd2b] - R P [Testing Variance - Critical Value (Region)] [Workshop 4 - task 8] [2012-10-23 20:03:17] [7dcdf88f8d4909016d1a598b3c226ce5] | |||||||||||||||||||||||||||||||||||||||||||||||||||||||||||||||||||||||||||||||||||||||||||||||||||||||||||||||||||||||||||||||||||||||||||||||||||||||||||||||||||||||||||||||||||||
| Feedback Forum | |||||||||||||||||||||||||||||||||||||||||||||||||||||||||||||||||||||||||||||||||||||||||||||||||||||||||||||||||||||||||||||||||||||||||||||||||||||||||||||||||||||||||||||||||||||
Post a new message | |||||||||||||||||||||||||||||||||||||||||||||||||||||||||||||||||||||||||||||||||||||||||||||||||||||||||||||||||||||||||||||||||||||||||||||||||||||||||||||||||||||||||||||||||||||
Dataset | |||||||||||||||||||||||||||||||||||||||||||||||||||||||||||||||||||||||||||||||||||||||||||||||||||||||||||||||||||||||||||||||||||||||||||||||||||||||||||||||||||||||||||||||||||||
Tables (Output of Computation) | |||||||||||||||||||||||||||||||||||||||||||||||||||||||||||||||||||||||||||||||||||||||||||||||||||||||||||||||||||||||||||||||||||||||||||||||||||||||||||||||||||||||||||||||||||||
| |||||||||||||||||||||||||||||||||||||||||||||||||||||||||||||||||||||||||||||||||||||||||||||||||||||||||||||||||||||||||||||||||||||||||||||||||||||||||||||||||||||||||||||||||||||
Figures (Output of Computation) | |||||||||||||||||||||||||||||||||||||||||||||||||||||||||||||||||||||||||||||||||||||||||||||||||||||||||||||||||||||||||||||||||||||||||||||||||||||||||||||||||||||||||||||||||||||
Input Parameters & R Code | |||||||||||||||||||||||||||||||||||||||||||||||||||||||||||||||||||||||||||||||||||||||||||||||||||||||||||||||||||||||||||||||||||||||||||||||||||||||||||||||||||||||||||||||||||||
| Parameters (Session): | |||||||||||||||||||||||||||||||||||||||||||||||||||||||||||||||||||||||||||||||||||||||||||||||||||||||||||||||||||||||||||||||||||||||||||||||||||||||||||||||||||||||||||||||||||||
| par1 = 105 ; par2 = 1 ; par3 = 0.95 ; par4 = 13 ; par5 = 0.05 ; | |||||||||||||||||||||||||||||||||||||||||||||||||||||||||||||||||||||||||||||||||||||||||||||||||||||||||||||||||||||||||||||||||||||||||||||||||||||||||||||||||||||||||||||||||||||
| Parameters (R input): | |||||||||||||||||||||||||||||||||||||||||||||||||||||||||||||||||||||||||||||||||||||||||||||||||||||||||||||||||||||||||||||||||||||||||||||||||||||||||||||||||||||||||||||||||||||
| par1 = 105 ; par2 = 1 ; par3 = 0.95 ; par4 = 13 ; par5 = 0.05 ; | |||||||||||||||||||||||||||||||||||||||||||||||||||||||||||||||||||||||||||||||||||||||||||||||||||||||||||||||||||||||||||||||||||||||||||||||||||||||||||||||||||||||||||||||||||||
| R code (references can be found in the software module): | |||||||||||||||||||||||||||||||||||||||||||||||||||||||||||||||||||||||||||||||||||||||||||||||||||||||||||||||||||||||||||||||||||||||||||||||||||||||||||||||||||||||||||||||||||||
par1 <- as.numeric(par1) | |||||||||||||||||||||||||||||||||||||||||||||||||||||||||||||||||||||||||||||||||||||||||||||||||||||||||||||||||||||||||||||||||||||||||||||||||||||||||||||||||||||||||||||||||||||