Free Statistics
of Irreproducible Research!
Description of Statistical Computation | |||||||||||||||||||||||||||||||||||||||||||||||||||||||||||||||||||||||||||||||||||||||||||||||||||||||||||||||||||||||||||||||||||||||||||||||||||||||||||||||||||||||||||||||||||||
|---|---|---|---|---|---|---|---|---|---|---|---|---|---|---|---|---|---|---|---|---|---|---|---|---|---|---|---|---|---|---|---|---|---|---|---|---|---|---|---|---|---|---|---|---|---|---|---|---|---|---|---|---|---|---|---|---|---|---|---|---|---|---|---|---|---|---|---|---|---|---|---|---|---|---|---|---|---|---|---|---|---|---|---|---|---|---|---|---|---|---|---|---|---|---|---|---|---|---|---|---|---|---|---|---|---|---|---|---|---|---|---|---|---|---|---|---|---|---|---|---|---|---|---|---|---|---|---|---|---|---|---|---|---|---|---|---|---|---|---|---|---|---|---|---|---|---|---|---|---|---|---|---|---|---|---|---|---|---|---|---|---|---|---|---|---|---|---|---|---|---|---|---|---|---|---|---|---|---|---|---|---|
| Author's title | |||||||||||||||||||||||||||||||||||||||||||||||||||||||||||||||||||||||||||||||||||||||||||||||||||||||||||||||||||||||||||||||||||||||||||||||||||||||||||||||||||||||||||||||||||||
| Author | *The author of this computation has been verified* | ||||||||||||||||||||||||||||||||||||||||||||||||||||||||||||||||||||||||||||||||||||||||||||||||||||||||||||||||||||||||||||||||||||||||||||||||||||||||||||||||||||||||||||||||||||
| R Software Module | rwasp_notchedbox1.wasp | ||||||||||||||||||||||||||||||||||||||||||||||||||||||||||||||||||||||||||||||||||||||||||||||||||||||||||||||||||||||||||||||||||||||||||||||||||||||||||||||||||||||||||||||||||||
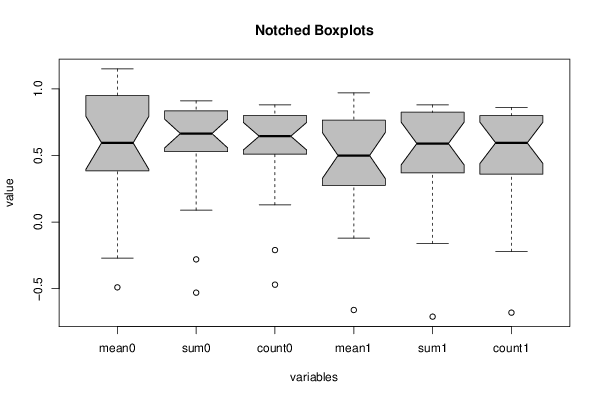
| Title produced by software | Notched Boxplots | ||||||||||||||||||||||||||||||||||||||||||||||||||||||||||||||||||||||||||||||||||||||||||||||||||||||||||||||||||||||||||||||||||||||||||||||||||||||||||||||||||||||||||||||||||||
| Date of computation | Wed, 10 Oct 2012 04:19:09 -0400 | ||||||||||||||||||||||||||||||||||||||||||||||||||||||||||||||||||||||||||||||||||||||||||||||||||||||||||||||||||||||||||||||||||||||||||||||||||||||||||||||||||||||||||||||||||||
| Cite this page as follows | Statistical Computations at FreeStatistics.org, Office for Research Development and Education, URL https://freestatistics.org/blog/index.php?v=date/2012/Oct/10/t1349857211a32kp1xh5twjgw3.htm/, Retrieved Mon, 29 Apr 2024 12:40:41 +0000 | ||||||||||||||||||||||||||||||||||||||||||||||||||||||||||||||||||||||||||||||||||||||||||||||||||||||||||||||||||||||||||||||||||||||||||||||||||||||||||||||||||||||||||||||||||||
| Statistical Computations at FreeStatistics.org, Office for Research Development and Education, URL https://freestatistics.org/blog/index.php?pk=174801, Retrieved Mon, 29 Apr 2024 12:40:41 +0000 | |||||||||||||||||||||||||||||||||||||||||||||||||||||||||||||||||||||||||||||||||||||||||||||||||||||||||||||||||||||||||||||||||||||||||||||||||||||||||||||||||||||||||||||||||||||
| QR Codes: | |||||||||||||||||||||||||||||||||||||||||||||||||||||||||||||||||||||||||||||||||||||||||||||||||||||||||||||||||||||||||||||||||||||||||||||||||||||||||||||||||||||||||||||||||||||
|
| |||||||||||||||||||||||||||||||||||||||||||||||||||||||||||||||||||||||||||||||||||||||||||||||||||||||||||||||||||||||||||||||||||||||||||||||||||||||||||||||||||||||||||||||||||||
| Original text written by user: | |||||||||||||||||||||||||||||||||||||||||||||||||||||||||||||||||||||||||||||||||||||||||||||||||||||||||||||||||||||||||||||||||||||||||||||||||||||||||||||||||||||||||||||||||||||
| IsPrivate? | No (this computation is public) | ||||||||||||||||||||||||||||||||||||||||||||||||||||||||||||||||||||||||||||||||||||||||||||||||||||||||||||||||||||||||||||||||||||||||||||||||||||||||||||||||||||||||||||||||||||
| User-defined keywords | |||||||||||||||||||||||||||||||||||||||||||||||||||||||||||||||||||||||||||||||||||||||||||||||||||||||||||||||||||||||||||||||||||||||||||||||||||||||||||||||||||||||||||||||||||||
| Estimated Impact | 438 | ||||||||||||||||||||||||||||||||||||||||||||||||||||||||||||||||||||||||||||||||||||||||||||||||||||||||||||||||||||||||||||||||||||||||||||||||||||||||||||||||||||||||||||||||||||
Tree of Dependent Computations | |||||||||||||||||||||||||||||||||||||||||||||||||||||||||||||||||||||||||||||||||||||||||||||||||||||||||||||||||||||||||||||||||||||||||||||||||||||||||||||||||||||||||||||||||||||
| Family? (F = Feedback message, R = changed R code, M = changed R Module, P = changed Parameters, D = changed Data) | |||||||||||||||||||||||||||||||||||||||||||||||||||||||||||||||||||||||||||||||||||||||||||||||||||||||||||||||||||||||||||||||||||||||||||||||||||||||||||||||||||||||||||||||||||||
| - [Notched Boxplots] [] [2012-10-10 08:19:09] [d76b387543b13b5e3afd8ff9e5fdc89f] [Current] - R D [Notched Boxplots] [Paper statistiek ...] [2012-12-04 16:27:13] [9f87ad58f325f963ff5b3a15384d509e] - RMPD [Stem-and-leaf Plot] [Paper stat - wiss...] [2012-12-04 16:30:29] [9f87ad58f325f963ff5b3a15384d509e] - RMPD [Tukey lambda PPCC Plot] [Paper stat - wiss...] [2012-12-04 16:35:34] [9f87ad58f325f963ff5b3a15384d509e] - R [Notched Boxplots] [] [2012-12-19 16:10:10] [edf0418499cd31d27dbea8ea1d30b3db] - R [Notched Boxplots] [deel 1 notched bo...] [2012-12-20 15:38:20] [885d0a915dae889a27a534b235a2244f] - R [Notched Boxplots] [Workshop 2 Vraag 5] [2013-10-16 14:45:00] [74be16979710d4c4e7c6647856088456] - RMP [Kendall tau Correlation Matrix] [Workshop 2 Vraag 5] [2013-10-16 15:03:29] [a33425df4f50c4c8e40ef78287b40411] - [Notched Boxplots] [WS2.5] [2013-10-16 19:56:35] [31634b7e94db88df109226f71dc63e83] - RM [Notched Boxplots] [WS2 Task 5] [2014-10-08 10:43:41] [fa1b8827d7de91b8b87087311d3d9fa1] - RM [Notched Boxplots] [] [2014-10-08 11:44:16] [fa1b8827d7de91b8b87087311d3d9fa1] - RM [Notched Boxplots] [boxplots] [2014-10-08 12:21:43] [bca3c6529212edfac3e771806c79a908] - RM [Notched Boxplots] [] [2014-10-08 12:42:44] [40df8d8b5657a9599acc6ccced535535] - RM [Notched Boxplots] [WS2 - Task 5 - Co...] [2014-10-08 12:45:58] [3cc57788b191749bdc089f5fad42e0f8] - RM [Notched Boxplots] [] [2014-10-08 12:52:31] [d253a55552bf9917a397def3be261e30] - RM [Notched Boxplots] [Boxplot] [2014-10-08 12:54:10] [67894a4ff6098ffac356bc81e6028257] - RM [Notched Boxplots] [Task 5] [2014-10-08 13:07:03] [0ec9eb5435be4d22ad2fec0894a217aa] - MP [Notched Boxplots] [Task 5 WS2] [2014-10-08 13:34:27] [805021881bfa5340347077d26b077617] - RM [Kendall tau Correlation Matrix] [Task 5.1 WS2] [2014-10-08 13:42:44] [805021881bfa5340347077d26b077617] - RM [Notched Boxplots] [WS2 task5c] [2014-10-08 13:46:12] [46c7ebd23dbdec306a09830d8b7528e7] - RM [Notched Boxplots] [ws2 task 5,3] [2014-10-08 14:01:00] [99723d3e379f668157309b7b2091b15d] - MP [Notched Boxplots] [] [2014-10-08 14:10:34] [1a6d42b46b3d01bc960fcfb45e99fecd] - MP [Notched Boxplots] [WS2 -Task 5] [2014-10-08 14:21:27] [4d39cf209776852399955073f9d0ee7a] - RM [Notched Boxplots] [Boxplot] [2014-10-08 14:21:39] [36781f05c04c55e165b348994b753b95] - RMP [Notched Boxplots] [Task 5 WS2] [2014-10-08 14:21:06] [bcf5edf18529a33bd1494456d2c6cb9a] - RM [Notched Boxplots] [] [2014-10-08 14:28:42] [d253a55552bf9917a397def3be261e30] - RM [Notched Boxplots] [] [2014-10-08 15:14:54] [2ba32e9656c7c3fdddad3ba3f1588288] - RM [Notched Boxplots] [Boxplot] [2014-10-08 16:51:25] [67894a4ff6098ffac356bc81e6028257] - RM [Notched Boxplots] [WS 2 task 5] [2014-10-08 16:54:39] [5efa6717cfe6505454df834acc87b53b] - RM [Notched Boxplots] [] [2014-10-08 16:55:10] [69bf0eb8b9b38defaaf4848d8c317571] - RM [Notched Boxplots] [Boxplot] [2014-10-08 17:27:59] [837635e05a8b7d15572545de61d5b5ed] - RM [Notched Boxplots] [notched boxplots] [2014-10-08 17:31:22] [fda96889f4ef6d31c0c28fd64d281011] - RM [Notched Boxplots] [Task 5 WS2] [2014-10-08 17:41:29] [93cb0d178904cf975da218b7c929e42d] - RM [Notched Boxplots] [] [2014-10-08 18:32:07] [bcf5edf18529a33bd1494456d2c6cb9a] - RM [Notched Boxplots] [] [2014-10-08 18:54:34] [bcf5edf18529a33bd1494456d2c6cb9a] - RMP [Kendall tau Correlation Matrix] [] [2014-10-08 19:01:48] [bcf5edf18529a33bd1494456d2c6cb9a] - R [Kendall tau Correlation Matrix] [] [2014-12-22 14:09:26] [1601e79f56036968990446024a6397e5] - [Notched Boxplots] [h] [2014-12-22 14:03:30] [1601e79f56036968990446024a6397e5] - RM [Notched Boxplots] [Task 5] [2014-10-09 10:45:14] [ae96d02647dd9ad9c105f1fa6642e295] - RM [Notched Boxplots] [workshop 2 task 5] [2014-10-09 13:31:36] [261f60062b6e70d0e3f72a6ad4f04654] - RM [Notched Boxplots] [task 5] [2014-10-09 14:04:02] [dd7a37d66cc3f8699a204e53c0324369] - RM [Notched Boxplots] [] [2014-10-09 14:26:26] [fa1b8827d7de91b8b87087311d3d9fa1] - RM [Notched Boxplots] [] [2014-10-09 14:52:06] [044144d0728beecdb08e0d94daaff202] - RMP [Notched Boxplots] [WS2 Task 5] [2014-10-09 14:53:19] [be945163e51ed825733188af308451be] - RM [Notched Boxplots] [boxplot] [2014-10-09 15:06:17] [118a39334d200089014f927b57d44a19] - RM [Notched Boxplots] [box plot] [2014-10-09 15:07:11] [dff69aee41c8af911d8c09c9558ab168] - RM [Notched Boxplots] [] [2014-10-09 15:13:59] [7b576ab45e161dc8fb6fe50455a3800c] - RM [Notched Boxplots] [BOX] [2014-10-09 15:31:22] [2ba32e9656c7c3fdddad3ba3f1588288] - RM [Notched Boxplots] [] [2014-10-09 15:47:06] [78252ca1523d3477f114bddbfa59edb4] [Truncated] | |||||||||||||||||||||||||||||||||||||||||||||||||||||||||||||||||||||||||||||||||||||||||||||||||||||||||||||||||||||||||||||||||||||||||||||||||||||||||||||||||||||||||||||||||||||
| Feedback Forum | |||||||||||||||||||||||||||||||||||||||||||||||||||||||||||||||||||||||||||||||||||||||||||||||||||||||||||||||||||||||||||||||||||||||||||||||||||||||||||||||||||||||||||||||||||||
Post a new message | |||||||||||||||||||||||||||||||||||||||||||||||||||||||||||||||||||||||||||||||||||||||||||||||||||||||||||||||||||||||||||||||||||||||||||||||||||||||||||||||||||||||||||||||||||||
Dataset | |||||||||||||||||||||||||||||||||||||||||||||||||||||||||||||||||||||||||||||||||||||||||||||||||||||||||||||||||||||||||||||||||||||||||||||||||||||||||||||||||||||||||||||||||||||
| Dataseries X: | |||||||||||||||||||||||||||||||||||||||||||||||||||||||||||||||||||||||||||||||||||||||||||||||||||||||||||||||||||||||||||||||||||||||||||||||||||||||||||||||||||||||||||||||||||||
1.14 0.88 0.85 0.97 0.88 0.86 -0.27 -0.28 -0.21 0.08 0.09 0.02 1.07 0.86 0.82 0.86 0.87 0.84 0.18 0.22 0.26 -0.12 -0.16 -0.22 0.92 0.79 0.78 0.52 0.6 0.62 1.15 0.91 0.88 0.87 0.84 0.81 0.59 0.64 0.62 0.75 0.82 0.81 1.05 0.86 0.83 0.78 0.83 0.8 -0.49 -0.53 -0.47 -0.66 -0.71 -0.68 0.98 0.88 0.84 0.92 0.83 0.8 0.74 0.81 0.78 0.65 0.72 0.71 0.51 0.6 0.62 0.41 0.56 0.57 0.6 0.64 0.61 0.47 0.53 0.52 0.42 0.53 0.53 0.4 0.46 0.45 0.72 0.69 0.66 0.48 0.58 0.57 0.35 0.53 0.49 0.21 0.31 0.32 0.58 0.7 0.67 0.65 0.78 0.78 0.62 0.72 0.71 0.59 0.73 0.78 0.54 0.63 0.63 0.34 0.43 0.4 0.08 0.09 0.13 -0.05 -0.06 -0.02 | |||||||||||||||||||||||||||||||||||||||||||||||||||||||||||||||||||||||||||||||||||||||||||||||||||||||||||||||||||||||||||||||||||||||||||||||||||||||||||||||||||||||||||||||||||||
Tables (Output of Computation) | |||||||||||||||||||||||||||||||||||||||||||||||||||||||||||||||||||||||||||||||||||||||||||||||||||||||||||||||||||||||||||||||||||||||||||||||||||||||||||||||||||||||||||||||||||||
| |||||||||||||||||||||||||||||||||||||||||||||||||||||||||||||||||||||||||||||||||||||||||||||||||||||||||||||||||||||||||||||||||||||||||||||||||||||||||||||||||||||||||||||||||||||
Figures (Output of Computation) | |||||||||||||||||||||||||||||||||||||||||||||||||||||||||||||||||||||||||||||||||||||||||||||||||||||||||||||||||||||||||||||||||||||||||||||||||||||||||||||||||||||||||||||||||||||
Input Parameters & R Code | |||||||||||||||||||||||||||||||||||||||||||||||||||||||||||||||||||||||||||||||||||||||||||||||||||||||||||||||||||||||||||||||||||||||||||||||||||||||||||||||||||||||||||||||||||||
| Parameters (Session): | |||||||||||||||||||||||||||||||||||||||||||||||||||||||||||||||||||||||||||||||||||||||||||||||||||||||||||||||||||||||||||||||||||||||||||||||||||||||||||||||||||||||||||||||||||||
| par1 = grey ; | |||||||||||||||||||||||||||||||||||||||||||||||||||||||||||||||||||||||||||||||||||||||||||||||||||||||||||||||||||||||||||||||||||||||||||||||||||||||||||||||||||||||||||||||||||||
| Parameters (R input): | |||||||||||||||||||||||||||||||||||||||||||||||||||||||||||||||||||||||||||||||||||||||||||||||||||||||||||||||||||||||||||||||||||||||||||||||||||||||||||||||||||||||||||||||||||||
| par1 = grey ; | |||||||||||||||||||||||||||||||||||||||||||||||||||||||||||||||||||||||||||||||||||||||||||||||||||||||||||||||||||||||||||||||||||||||||||||||||||||||||||||||||||||||||||||||||||||
| R code (references can be found in the software module): | |||||||||||||||||||||||||||||||||||||||||||||||||||||||||||||||||||||||||||||||||||||||||||||||||||||||||||||||||||||||||||||||||||||||||||||||||||||||||||||||||||||||||||||||||||||
z <- as.data.frame(t(y)) | |||||||||||||||||||||||||||||||||||||||||||||||||||||||||||||||||||||||||||||||||||||||||||||||||||||||||||||||||||||||||||||||||||||||||||||||||||||||||||||||||||||||||||||||||||||