Free Statistics

of Irreproducible Research!

Author's title

Author*The author of this computation has been verified*
R Software Modulerwasp_sample.wasp
Title produced by softwareMinimum Sample Size - Testing Proportions
Date of computationWed, 19 Dec 2012 08:40:31 -0500
Cite this page as followsStatistical Computations at FreeStatistics.org, Office for Research Development and Education, URL https://freestatistics.org/blog/index.php?v=date/2012/Dec/19/t13559244594722rxdquxupri1.htm/, Retrieved Mon, 29 Apr 2024 21:33:30 +0000
Statistical Computations at FreeStatistics.org, Office for Research Development and Education, URL https://freestatistics.org/blog/index.php?pk=201934, Retrieved Mon, 29 Apr 2024 21:33:30 +0000
QR Codes:

Original text written by user:
IsPrivate?No (this computation is public)
User-defined keywords
Estimated Impact107
Family? (F = Feedback message, R = changed R code, M = changed R Module, P = changed Parameters, D = changed Data)
-     [Linear Regression Graphical Model Validation] [Colombia Coffee -...] [2008-02-26 10:22:06] [74be16979710d4c4e7c6647856088456]
F RMPD  [Chi-Squared and McNemar Tests] [WS6 - Chi kwadraa...] [2010-11-07 14:08:40] [8ef49741e164ec6343c90c7935194465]
- R       [Chi-Squared and McNemar Tests] [Workshop 6, Chi-S...] [2010-11-09 11:02:54] [8ffb4cfa64b4677df0d2c448735a40bb]
F   P       [Chi-Squared and McNemar Tests] [WS6 Hap-Sep] [2010-11-11 17:34:36] [afe9379cca749d06b3d6872e02cc47ed]
- RMPD          [Minimum Sample Size - Testing Proportions] [] [2012-12-19 13:40:31] [8320012c80513ed9c03312c2688c5a59] [Current]
Feedback Forum

Post a new message


Summary of computational transaction
Raw Inputview raw input (R code)
Raw Outputview raw output of R engine
Computing time2 seconds
R Server'George Udny Yule' @ yule.wessa.net

\begin{tabular}{lllllllll}
\hline
Summary of computational transaction \tabularnewline
Raw Input & view raw input (R code)  \tabularnewline
Raw Output & view raw output of R engine  \tabularnewline
Computing time & 2 seconds \tabularnewline
R Server & 'George Udny Yule' @ yule.wessa.net \tabularnewline
\hline
\end{tabular}
%Source: https://freestatistics.org/blog/index.php?pk=201934&T=0

[TABLE]
[ROW][C]Summary of computational transaction[/C][/ROW]
[ROW][C]Raw Input[/C][C]view raw input (R code) [/C][/ROW]
[ROW][C]Raw Output[/C][C]view raw output of R engine [/C][/ROW]
[ROW][C]Computing time[/C][C]2 seconds[/C][/ROW]
[ROW][C]R Server[/C][C]'George Udny Yule' @ yule.wessa.net[/C][/ROW]
[/TABLE]
Source: https://freestatistics.org/blog/index.php?pk=201934&T=0

Globally Unique Identifier (entire table): ba.freestatistics.org/blog/index.php?pk=201934&T=0

As an alternative you can also use a QR Code:  

The GUIDs for individual cells are displayed in the table below:

Summary of computational transaction
Raw Inputview raw input (R code)
Raw Outputview raw output of R engine
Computing time2 seconds
R Server'George Udny Yule' @ yule.wessa.net


Minimum Sample Size
Population Size37599
Margin of Error0.05
Confidence0.95
Power0.5
Response Distribution (Proportion)0.5
z(alpha/2) + z(beta)1.95996398454005
z(alpha) + z(beta)1.64485362695147
Minimum Sample Size (2 sided test)380.270800516995
Minimum Sample Size (1 sided test)268.628496886004

\begin{tabular}{lllllllll}
\hline
Minimum Sample Size \tabularnewline
Population Size & 37599 \tabularnewline
Margin of Error & 0.05 \tabularnewline
Confidence & 0.95 \tabularnewline
Power & 0.5 \tabularnewline
Response Distribution (Proportion) & 0.5 \tabularnewline
z(alpha/2) + z(beta) & 1.95996398454005 \tabularnewline
z(alpha) + z(beta) & 1.64485362695147 \tabularnewline
Minimum Sample Size (2 sided test) & 380.270800516995 \tabularnewline
Minimum Sample Size (1 sided test) & 268.628496886004 \tabularnewline
\hline
\end{tabular}
%Source: https://freestatistics.org/blog/index.php?pk=201934&T=1

[TABLE]
[ROW][C]Minimum Sample Size[/C][/ROW]
[ROW][C]Population Size[/C][C]37599[/C][/ROW]
[ROW][C]Margin of Error[/C][C]0.05[/C][/ROW]
[ROW][C]Confidence[/C][C]0.95[/C][/ROW]
[ROW][C]Power[/C][C]0.5[/C][/ROW]
[ROW][C]Response Distribution (Proportion)[/C][C]0.5[/C][/ROW]
[ROW][C]z(alpha/2) + z(beta)[/C][C]1.95996398454005[/C][/ROW]
[ROW][C]z(alpha) + z(beta)[/C][C]1.64485362695147[/C][/ROW]
[ROW][C]Minimum Sample Size (2 sided test)[/C][C]380.270800516995[/C][/ROW]
[ROW][C]Minimum Sample Size (1 sided test)[/C][C]268.628496886004[/C][/ROW]
[/TABLE]
Source: https://freestatistics.org/blog/index.php?pk=201934&T=1

Globally Unique Identifier (entire table): ba.freestatistics.org/blog/index.php?pk=201934&T=1

As an alternative you can also use a QR Code:  

The GUIDs for individual cells are displayed in the table below:

Minimum Sample Size
Population Size37599
Margin of Error0.05
Confidence0.95
Power0.5
Response Distribution (Proportion)0.5
z(alpha/2) + z(beta)1.95996398454005
z(alpha) + z(beta)1.64485362695147
Minimum Sample Size (2 sided test)380.270800516995
Minimum Sample Size (1 sided test)268.628496886004


Minimum Sample Size (infinite population)
Population Sizeinfinite
Margin of Error0.05
Confidence0.95
Power0.5
Response Distribution (Proportion)0.5
z(alpha/2) + z(beta)1.95996398454005
z(alpha) + z(beta)1.64485362695147
Minimum Sample Size (2 sided test)384.145882069412
Minimum Sample Size (1 sided test)270.554345409541

\begin{tabular}{lllllllll}
\hline
Minimum Sample Size (infinite population) \tabularnewline
Population Size & infinite \tabularnewline
Margin of Error & 0.05 \tabularnewline
Confidence & 0.95 \tabularnewline
Power & 0.5 \tabularnewline
Response Distribution (Proportion) & 0.5 \tabularnewline
z(alpha/2) + z(beta) & 1.95996398454005 \tabularnewline
z(alpha) + z(beta) & 1.64485362695147 \tabularnewline
Minimum Sample Size (2 sided test) & 384.145882069412 \tabularnewline
Minimum Sample Size (1 sided test) & 270.554345409541 \tabularnewline
\hline
\end{tabular}
%Source: https://freestatistics.org/blog/index.php?pk=201934&T=2

[TABLE]
[ROW][C]Minimum Sample Size (infinite population)[/C][/ROW]
[ROW][C]Population Size[/C][C]infinite[/C][/ROW]
[ROW][C]Margin of Error[/C][C]0.05[/C][/ROW]
[ROW][C]Confidence[/C][C]0.95[/C][/ROW]
[ROW][C]Power[/C][C]0.5[/C][/ROW]
[ROW][C]Response Distribution (Proportion)[/C][C]0.5[/C][/ROW]
[ROW][C]z(alpha/2) + z(beta)[/C][C]1.95996398454005[/C][/ROW]
[ROW][C]z(alpha) + z(beta)[/C][C]1.64485362695147[/C][/ROW]
[ROW][C]Minimum Sample Size (2 sided test)[/C][C]384.145882069412[/C][/ROW]
[ROW][C]Minimum Sample Size (1 sided test)[/C][C]270.554345409541[/C][/ROW]
[/TABLE]
Source: https://freestatistics.org/blog/index.php?pk=201934&T=2

Globally Unique Identifier (entire table): ba.freestatistics.org/blog/index.php?pk=201934&T=2

As an alternative you can also use a QR Code:  

The GUIDs for individual cells are displayed in the table below:

Minimum Sample Size (infinite population)
Population Sizeinfinite
Margin of Error0.05
Confidence0.95
Power0.5
Response Distribution (Proportion)0.5
z(alpha/2) + z(beta)1.95996398454005
z(alpha) + z(beta)1.64485362695147
Minimum Sample Size (2 sided test)384.145882069412
Minimum Sample Size (1 sided test)270.554345409541


Parameters (Session):
par1 = 37599 ; par2 = 0.05 ; par3 = 0.95 ; par4 = 0.50 ; par5 = 0.50 ;
Parameters (R input):
par1 = 37599 ; par2 = 0.05 ; par3 = 0.95 ; par4 = 0.50 ; par5 = 0.50 ;
R code (references can be found in the software module):
par1 <- as.numeric(par1)
par2 <- as.numeric(par2)
par3 <- as.numeric(par3)
par4 <- as.numeric(par4)
par5 <- as.numeric(par5)
(z <- abs(qnorm((1-par3)/2)) + abs(qnorm(1-par5)))
(z1 <- abs(qnorm(1-par3)) + abs(qnorm(1-par5)))
dum <- z*z * par4*(1-par4)
dum1 <- z1*z1 * par4*(1-par4)
par22 <- par2*par2
npop <- array(NA, 200)
ppop <- array(NA, 200)
for (i in 1:200)
{
ppop[i] <- i * 100
npop[i] <- ppop[i] * dum / (dum + (ppop[i]-1)*par22)
}
bitmap(file='pic1.png')
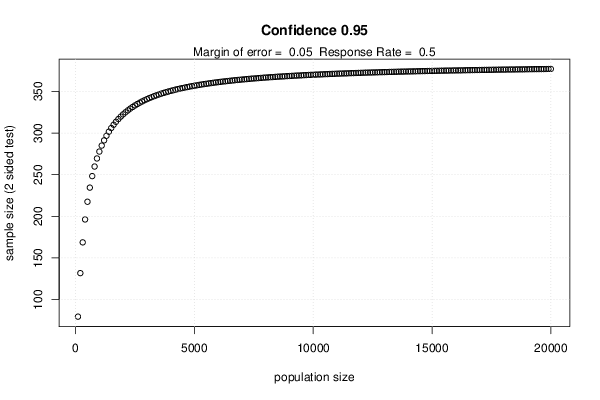
plot(ppop,npop, xlab='population size', ylab='sample size (2 sided test)', main = paste('Confidence',par3))
dumtext <- paste('Margin of error = ',par2)
dumtext <- paste(dumtext,' Response Rate = ')
dumtext <- paste(dumtext, par4)
mtext(dumtext)
grid()
dev.off()
(n <- par1 * dum / (dum + (par1-1)*par22))
(n1 <- par1 * dum1 / (dum1 + (par1-1)*par22))
load(file='createtable')
a<-table.start()
a<-table.row.start(a)
a<-table.element(a,'Minimum Sample Size',2,TRUE)
a<-table.row.end(a)
a<-table.row.start(a)
a<-table.element(a,'Population Size',header=TRUE)
a<-table.element(a,par1)
a<-table.row.end(a)
a<-table.row.start(a)
a<-table.element(a,'Margin of Error',header=TRUE)
a<-table.element(a,par2)
a<-table.row.end(a)
a<-table.row.start(a)
a<-table.element(a,'Confidence',header=TRUE)
a<-table.element(a,par3)
a<-table.row.end(a)
a<-table.row.start(a)
a<-table.element(a,'Power',header=TRUE)
a<-table.element(a,par5)
a<-table.row.end(a)
a<-table.row.start(a)
a<-table.element(a,'Response Distribution (Proportion)',header=TRUE)
a<-table.element(a,par4)
a<-table.row.end(a)
a<-table.row.start(a)
a<-table.element(a,'z(alpha/2) + z(beta)',header=TRUE)
a<-table.element(a,z)
a<-table.row.end(a)
a<-table.row.start(a)
a<-table.element(a,'z(alpha) + z(beta)',header=TRUE)
a<-table.element(a,z1)
a<-table.row.end(a)
a<-table.row.start(a)
a<-table.element(a,'Minimum Sample Size (2 sided test)',header=TRUE)
a<-table.element(a,n)
a<-table.row.end(a)
a<-table.row.start(a)
a<-table.element(a,'Minimum Sample Size (1 sided test)',header=TRUE)
a<-table.element(a,n1)
a<-table.row.end(a)
a<-table.end(a)
table.save(a,file='mytable.tab')
(n <- dum / par22)
(n1 <- dum1 / par22)
a<-table.start()
a<-table.row.start(a)
a<-table.element(a,'Minimum Sample Size (infinite population)',2,TRUE)
a<-table.row.end(a)
a<-table.row.start(a)
a<-table.element(a,'Population Size',header=TRUE)
a<-table.element(a,'infinite')
a<-table.row.end(a)
a<-table.row.start(a)
a<-table.element(a,'Margin of Error',header=TRUE)
a<-table.element(a,par2)
a<-table.row.end(a)
a<-table.row.start(a)
a<-table.element(a,'Confidence',header=TRUE)
a<-table.element(a,par3)
a<-table.row.end(a)
a<-table.row.start(a)
a<-table.element(a,'Power',header=TRUE)
a<-table.element(a,par5)
a<-table.row.end(a)
a<-table.row.start(a)
a<-table.element(a,'Response Distribution (Proportion)',header=TRUE)
a<-table.element(a,par4)
a<-table.row.end(a)
a<-table.row.start(a)
a<-table.element(a,'z(alpha/2) + z(beta)',header=TRUE)
a<-table.element(a,z)
a<-table.row.end(a)
a<-table.row.start(a)
a<-table.element(a,'z(alpha) + z(beta)',header=TRUE)
a<-table.element(a,z1)
a<-table.row.end(a)
a<-table.row.start(a)
a<-table.element(a,'Minimum Sample Size (2 sided test)',header=TRUE)
a<-table.element(a,n)
a<-table.row.end(a)
a<-table.row.start(a)
a<-table.element(a,'Minimum Sample Size (1 sided test)',header=TRUE)
a<-table.element(a,n1)
a<-table.row.end(a)
a<-table.end(a)
table.save(a,file='mytable.tab')