Free Statistics
of Irreproducible Research!
Description of Statistical Computation | ||||||||||||||||||||||||||||||
|---|---|---|---|---|---|---|---|---|---|---|---|---|---|---|---|---|---|---|---|---|---|---|---|---|---|---|---|---|---|---|
| Author's title | ||||||||||||||||||||||||||||||
| Author | *Unverified author* | |||||||||||||||||||||||||||||
| R Software Module | rwasp_Distributional Plots.wasp | |||||||||||||||||||||||||||||
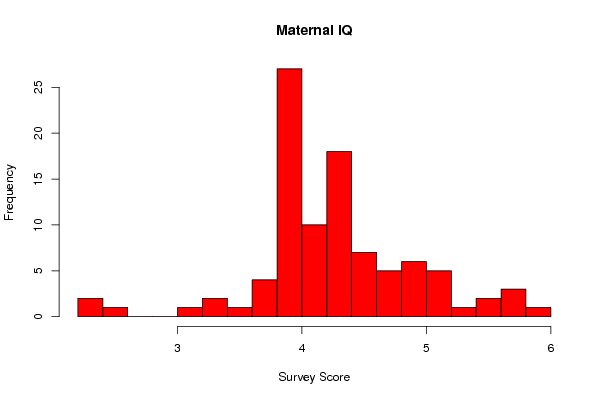
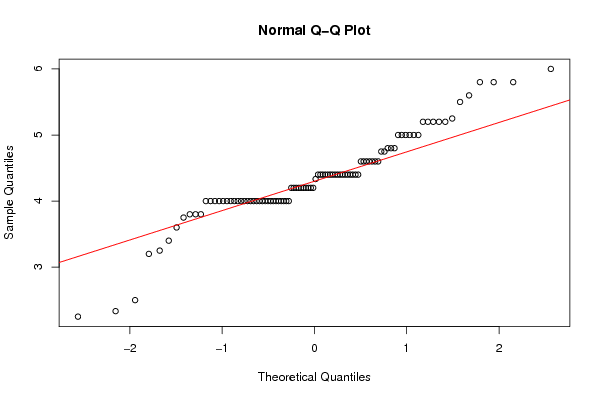
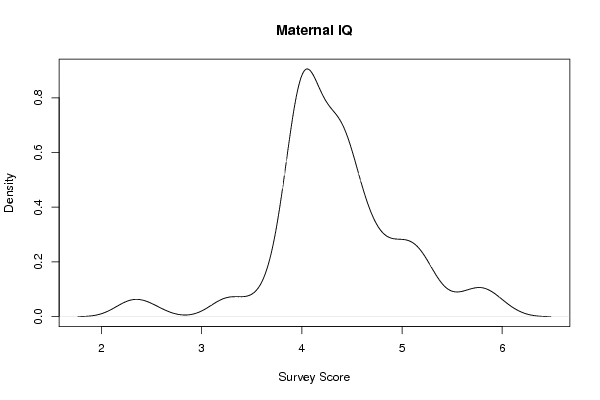
| Title produced by software | Histogram, QQplot and Density | |||||||||||||||||||||||||||||
| Date of computation | Fri, 28 Oct 2011 09:46:58 -0400 | |||||||||||||||||||||||||||||
| Cite this page as follows | Statistical Computations at FreeStatistics.org, Office for Research Development and Education, URL https://freestatistics.org/blog/index.php?v=date/2011/Oct/28/t1319809645mcfbzq6s76a0sof.htm/, Retrieved Sun, 02 Aug 2026 13:21:37 +0000 | |||||||||||||||||||||||||||||
| Statistical Computations at FreeStatistics.org, Office for Research Development and Education, URL https://freestatistics.org/blog/index.php?pk=137711, Retrieved Sun, 02 Aug 2026 13:21:37 +0000 | ||||||||||||||||||||||||||||||
| QR Codes: | ||||||||||||||||||||||||||||||
|
| ||||||||||||||||||||||||||||||
| Original text written by user: | ||||||||||||||||||||||||||||||
| IsPrivate? | No (this computation is public) | |||||||||||||||||||||||||||||
| User-defined keywords | ||||||||||||||||||||||||||||||
| Estimated Impact | 399 | |||||||||||||||||||||||||||||
Tree of Dependent Computations | ||||||||||||||||||||||||||||||
| Family? (F = Feedback message, R = changed R code, M = changed R Module, P = changed Parameters, D = changed Data) | ||||||||||||||||||||||||||||||
| - [Histogram, QQplot and Density] [Workshop 1 ] [2010-09-29 15:04:17] [98fd0e87c3eb04e0cc2efde01dbafab6] - RM [Histogram, QQplot and Density] [Workshop 1] [2011-10-03 09:04:15] [74be16979710d4c4e7c6647856088456] - R P [Histogram, QQplot and Density] [25 bins] [2011-10-06 11:43:50] [4625975edeb71769d1ebba98399ca86f] - PD [Histogram, QQplot and Density] [compmemomean qq plot] [2011-10-27 11:46:36] [a2de6508349022a1eb68cf1e7e46129d] - [Histogram, QQplot and Density] [compmemomean] [2011-10-28 13:38:50] [74be16979710d4c4e7c6647856088456] - PD [Histogram, QQplot and Density] [compattenmean qq ...] [2011-10-28 13:43:50] [74be16979710d4c4e7c6647856088456] - PD [Histogram, QQplot and Density] [compappliedmean q...] [2011-10-28 13:46:58] [d41d8cd98f00b204e9800998ecf8427e] [Current] - PD [Histogram, QQplot and Density] [Specmemmean qq plot] [2011-10-28 14:04:16] [74be16979710d4c4e7c6647856088456] - PD [Histogram, QQplot and Density] [specappliedmean q...] [2011-10-28 14:15:09] [a2de6508349022a1eb68cf1e7e46129d] - P [Histogram, QQplot and Density] [compappliedmean q...] [2011-10-28 14:22:02] [a2de6508349022a1eb68cf1e7e46129d] | ||||||||||||||||||||||||||||||
| Feedback Forum | ||||||||||||||||||||||||||||||
Post a new message | ||||||||||||||||||||||||||||||
Dataset | ||||||||||||||||||||||||||||||
| Dataseries X: | ||||||||||||||||||||||||||||||
4.4 4.2 5.2 5.2 4.4 5.5 4 4 4 3.8 4 5.25 3.6 4.4 4 4.4 4.333333333 4.6 4 4.4 5 5.2 5.2 4.6 4.6 2.333333333 4 3.8 4 4.6 4.75 4.4 4 4 5.2 3.8 2.5 3.2 4.2 4 3.25 4.2 4.75 4.4 4 4.2 4 4.2 4.4 4 4.6 4.4 4 4.8 2.25 4.8 3.75 5.6 4.2 4.2 5 5.8 5 4 4.4 4.4 4.4 4.4 5.8 6 4 4 5 4 4.2 4.4 4 4 4 4.2 4.6 4.4 4.4 4 5 4.2 5 4 4.8 4 4.6 4 4.4 4 3.4 5.8 | ||||||||||||||||||||||||||||||
Tables (Output of Computation) | ||||||||||||||||||||||||||||||
| ||||||||||||||||||||||||||||||
Figures (Output of Computation) | ||||||||||||||||||||||||||||||
Input Parameters & R Code | ||||||||||||||||||||||||||||||
| Parameters (Session): | ||||||||||||||||||||||||||||||
| par1 = 25 ; | ||||||||||||||||||||||||||||||
| Parameters (R input): | ||||||||||||||||||||||||||||||
| par1 = 25 ; | ||||||||||||||||||||||||||||||
| R code (references can be found in the software module): | ||||||||||||||||||||||||||||||
bitmap(file='test1.png') | ||||||||||||||||||||||||||||||