Free Statistics
of Irreproducible Research!
Description of Statistical Computation | |||||||||||||||||||||||||||||||||||||||||||||||||||||||||||||||||||||||||||||||||||||||
|---|---|---|---|---|---|---|---|---|---|---|---|---|---|---|---|---|---|---|---|---|---|---|---|---|---|---|---|---|---|---|---|---|---|---|---|---|---|---|---|---|---|---|---|---|---|---|---|---|---|---|---|---|---|---|---|---|---|---|---|---|---|---|---|---|---|---|---|---|---|---|---|---|---|---|---|---|---|---|---|---|---|---|---|---|---|---|---|
| Author's title | |||||||||||||||||||||||||||||||||||||||||||||||||||||||||||||||||||||||||||||||||||||||
| Author | *The author of this computation has been verified* | ||||||||||||||||||||||||||||||||||||||||||||||||||||||||||||||||||||||||||||||||||||||
| R Software Module | rwasp_Pregnancy and cognition.wasp | ||||||||||||||||||||||||||||||||||||||||||||||||||||||||||||||||||||||||||||||||||||||
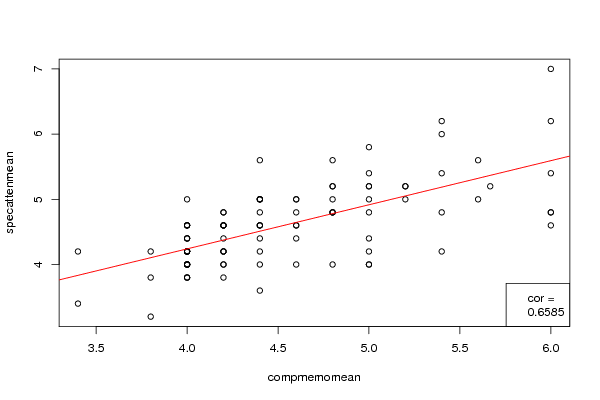
| Title produced by software | Correlation | ||||||||||||||||||||||||||||||||||||||||||||||||||||||||||||||||||||||||||||||||||||||
| Date of computation | Mon, 24 Oct 2011 13:01:26 -0400 | ||||||||||||||||||||||||||||||||||||||||||||||||||||||||||||||||||||||||||||||||||||||
| Cite this page as follows | Statistical Computations at FreeStatistics.org, Office for Research Development and Education, URL https://freestatistics.org/blog/index.php?v=date/2011/Oct/24/t1319475856vgukslh3tgo3uae.htm/, Retrieved Sat, 06 Jun 2026 10:28:18 +0000 | ||||||||||||||||||||||||||||||||||||||||||||||||||||||||||||||||||||||||||||||||||||||
| Statistical Computations at FreeStatistics.org, Office for Research Development and Education, URL https://freestatistics.org/blog/index.php?pk=134689, Retrieved Sat, 06 Jun 2026 10:28:18 +0000 | |||||||||||||||||||||||||||||||||||||||||||||||||||||||||||||||||||||||||||||||||||||||
| QR Codes: | |||||||||||||||||||||||||||||||||||||||||||||||||||||||||||||||||||||||||||||||||||||||
|
| |||||||||||||||||||||||||||||||||||||||||||||||||||||||||||||||||||||||||||||||||||||||
| Original text written by user: | |||||||||||||||||||||||||||||||||||||||||||||||||||||||||||||||||||||||||||||||||||||||
| IsPrivate? | No (this computation is public) | ||||||||||||||||||||||||||||||||||||||||||||||||||||||||||||||||||||||||||||||||||||||
| User-defined keywords | correlation, pearson's correlation, Shapiro-Wilk's test | ||||||||||||||||||||||||||||||||||||||||||||||||||||||||||||||||||||||||||||||||||||||
| Estimated Impact | 1428 | ||||||||||||||||||||||||||||||||||||||||||||||||||||||||||||||||||||||||||||||||||||||
Tree of Dependent Computations | |||||||||||||||||||||||||||||||||||||||||||||||||||||||||||||||||||||||||||||||||||||||
| Family? (F = Feedback message, R = changed R code, M = changed R Module, P = changed Parameters, D = changed Data) | |||||||||||||||||||||||||||||||||||||||||||||||||||||||||||||||||||||||||||||||||||||||
| - [Variability] [Pregnancy and Cog...] [2009-10-24 23:53:36] [98fd0e87c3eb04e0cc2efde01dbafab6] - RMPD [Correlation] [Cognition in Preg...] [2011-10-24 17:01:26] [a9208f4f8d3b118336aae915785f2bd9] [Current] - R [Correlation] [correlational week 4] [2011-10-27 11:08:38] [71cac728b89a34ca01732b1dc0bc9099] - R [Correlation] [] [2011-10-27 11:26:56] [c7597844baaca9882f0ad96a032255a8] - R D [Correlation] [Week 4] [2011-10-27 11:28:56] [bd36d4ac3e20250331cee586bb86a82a] - RMPD [Histogram] [compmemomean] [2011-10-27 11:30:28] [3030e7f8365b8c92cf1bdf2e49678d4e] - R D [Correlation] [week 4 - q1 (1)] [2011-10-27 11:28:55] [f6b9d876df69798a55c04978c9790084] - R D [Correlation] [correlation of 2 ...] [2011-10-27 11:28:32] [ea6e45d26e44fca6fcec5c603ff1140c] - RMPD [CARE Data - Boxplots and Scatterplot Matrix] [Pregnancy and Co...] [2011-10-27 11:31:58] [09253b89c68efd7a460a267273a9d6e3] - RMPD [Histogram] [compmemomean] [2011-10-27 11:31:06] [113a1c41b2127daa39468f799d579e88] - RM [Correlation] [] [2011-10-27 11:32:36] [483074838c7eb9e0ff7f7d3e3c3f8586] - R D [Correlation] [The correlation b...] [2011-10-27 11:29:13] [5ab72825a06ca2a73c828d10c85d14d8] - [Correlation] [ Correlation betw...] [2011-10-29 00:49:40] [5ab72825a06ca2a73c828d10c85d14d8] - R D [Correlation] [correlation graph 1] [2011-10-27 11:32:26] [a1285470e94335f544c5f7260af952d0] - RM [Correlation] [Shapiro Wilk] [2011-10-27 11:33:20] [3030e7f8365b8c92cf1bdf2e49678d4e] - R D [Correlation] [] [2011-10-27 11:28:25] [b65bb2f2e9cfcacaf325b787365dba62] - R D [Correlation] [Week 4] [2011-10-27 11:34:04] [bd36d4ac3e20250331cee586bb86a82a] - R D [Correlation] [linera scattergra...] [2011-10-27 11:34:35] [db177c22332ffa2a0a999e2f71898de2] - D [Correlation] [SCATTERPLOT 2] [2011-10-27 11:43:45] [db177c22332ffa2a0a999e2f71898de2] - D [Correlation] [scatterplot 3] [2011-10-27 11:46:46] [db177c22332ffa2a0a999e2f71898de2] - R D [Correlation] [Q10) LINEAR SCATT...] [2011-10-27 11:34:32] [60c778bceb6cdaf66800b3af2d5a97ab] - D [Correlation] [Q1b) linear scatt...] [2011-10-27 11:43:45] [60c778bceb6cdaf66800b3af2d5a97ab] - D [Correlation] [Q1C) Linear scatt...] [2011-10-27 11:47:27] [60c778bceb6cdaf66800b3af2d5a97ab] - RMPD [Histogram, QQplot and Density] [Histogram and qq ...] [2011-10-27 11:33:29] [a34f8e06ab326aaded2151ae8b5dffdf] - R D [Histogram, QQplot and Density] [Histogram and qq ...] [2011-10-27 11:39:20] [a34f8e06ab326aaded2151ae8b5dffdf] - [Histogram, QQplot and Density] [compattenmean] [2011-11-01 23:17:22] [74be16979710d4c4e7c6647856088456] - R D [Histogram, QQplot and Density] [Histogram and qq ...] [2011-10-27 11:43:46] [a34f8e06ab326aaded2151ae8b5dffdf] - R D [Histogram, QQplot and Density] [Histogram and qq ...] [2011-10-27 11:46:23] [a34f8e06ab326aaded2151ae8b5dffdf] - D [Histogram, QQplot and Density] [Histogram and qq ...] [2011-10-27 11:50:14] [a34f8e06ab326aaded2151ae8b5dffdf] - D [Histogram, QQplot and Density] [Histogram and qq ...] [2011-10-27 11:52:51] [a34f8e06ab326aaded2151ae8b5dffdf] - R [Histogram, QQplot and Density] [comp] [2011-10-27 11:56:42] [113a1c41b2127daa39468f799d579e88] - RM [Histogram, QQplot and Density] [Compmemomean] [2011-11-01 23:14:07] [74be16979710d4c4e7c6647856088456] - RM [Correlation] [Shaprio Wilk's] [2011-10-27 11:35:48] [803f089ae787812348a044658060aefb] - R D [Correlation] [Correlation showi...] [2011-10-27 11:34:28] [069c1c4384e883dd4e1df6d4e8f70f1e] - RM [Correlation] [graph 1] [2011-10-27 11:36:11] [c7597844baaca9882f0ad96a032255a8] - R D [Correlation] [Comparitive memor...] [2011-10-27 11:35:38] [a68359a26e24fd92b609f4c95c254176] - RM [Correlation] [Shapiro Wilk's Test] [2011-10-27 11:37:04] [68da2a3ec537521c4857f5c0bd5ed145] - RM [Correlation] [] [2011-10-27 11:37:32] [c7597844baaca9882f0ad96a032255a8] - RMPD [Histogram, QQplot and Density] [compmemomean graph] [2011-10-27 11:38:16] [ea6e45d26e44fca6fcec5c603ff1140c] - R D [Histogram, QQplot and Density] [compattenmean] [2011-10-27 11:39:25] [ea6e45d26e44fca6fcec5c603ff1140c] - R D [Histogram, QQplot and Density] [compappliedmean] [2011-10-27 11:40:36] [ea6e45d26e44fca6fcec5c603ff1140c] - R D [Histogram, QQplot and Density] [Specmemmean] [2011-10-27 11:41:31] [ea6e45d26e44fca6fcec5c603ff1140c] - D [Histogram, QQplot and Density] [specattenmean] [2011-10-27 11:42:28] [ea6e45d26e44fca6fcec5c603ff1140c] - D [Histogram, QQplot and Density] [specattenmean] [2011-10-27 11:42:28] [ea6e45d26e44fca6fcec5c603ff1140c] - D [Histogram, QQplot and Density] [specappliedmean] [2011-10-27 11:43:22] [ea6e45d26e44fca6fcec5c603ff1140c] - R P [Histogram, QQplot and Density] [bins 20] [2011-11-08 23:25:19] [d2893370a6bab19f4850e41a1f5affd5] - RMPD [Histogram, QQplot and Density] [] [2011-10-27 11:38:14] [b65bb2f2e9cfcacaf325b787365dba62] - RMPD [Histogram, QQplot and Density] [week 4 blog - 1st...] [2011-10-27 11:38:32] [f6b9d876df69798a55c04978c9790084] - RMPD [Histogram] [compattenmean] [2011-10-27 11:39:41] [113a1c41b2127daa39468f799d579e88] - RMPD [Histogram, QQplot and Density] [week 4 blog - 2nd...] [2011-10-27 11:39:52] [f6b9d876df69798a55c04978c9790084] [Truncated] | |||||||||||||||||||||||||||||||||||||||||||||||||||||||||||||||||||||||||||||||||||||||
| Feedback Forum | |||||||||||||||||||||||||||||||||||||||||||||||||||||||||||||||||||||||||||||||||||||||
Post a new message | |||||||||||||||||||||||||||||||||||||||||||||||||||||||||||||||||||||||||||||||||||||||
Dataset | |||||||||||||||||||||||||||||||||||||||||||||||||||||||||||||||||||||||||||||||||||||||
| Dataseries X: | |||||||||||||||||||||||||||||||||||||||||||||||||||||||||||||||||||||||||||||||||||||||
4.8 5.4 6 6 4 6 4.2 4.2 4.2 4 4.6 5.666666667 3.8 4.8 4.2 4 5.4 4.6 4 4.4 5 5.4 5.2 4.4 4 3.4 4.4 4 4.4 4.4 4 4.8 4 4 5 4 3.4 4 5.4 4.2 4 5.6 4.8 4.4 4.6 4 5.2 4.8 4.6 4 4.2 4.6 4.4 5 5 4 3.8 5.2 4.2 4.4 4.2 6 4.8 4 4.4 4 4.8 4.8 5.6 6 4 4.2 5 4.4 4.2 4.6 4.4 4 4 4 4.2 4 5 4.2 5.4 4 6 3.8 5 4.4 5 4.4 5 4.2 4.6 5 | |||||||||||||||||||||||||||||||||||||||||||||||||||||||||||||||||||||||||||||||||||||||
| Dataseries Y: | |||||||||||||||||||||||||||||||||||||||||||||||||||||||||||||||||||||||||||||||||||||||
4.8 4.2 4.6 4.8 4.6 6.2 4.4 4.2 4 4.2 4.4 5.2 3.8 5.2 4.6 4.2 5.4 4.6 4.4 5 4.8 6.2 5.2 4.6 4.6 4.2 4 4.6 4.6 5 4.6 5.6 4 3.8 5.8 4.2 3.4 3.8 4.8 4.2 4 5 5 4.6 5 3.8 5 4.8 5 4.2 4.8 4.6 5 5 4 4 3.2 5.2 4.6 3.6 4.8 4.8 4.8 4 5 4.4 5.2 4 5.6 7 4.2 4 5.2 4.2 4.6 4.8 4.8 4 4.4 4 4.6 4.2 4 3.8 6 5 5.4 4.2 5.4 5.6 5.2 4.4 4.4 4.2 4 4.2 | |||||||||||||||||||||||||||||||||||||||||||||||||||||||||||||||||||||||||||||||||||||||
Tables (Output of Computation) | |||||||||||||||||||||||||||||||||||||||||||||||||||||||||||||||||||||||||||||||||||||||
| |||||||||||||||||||||||||||||||||||||||||||||||||||||||||||||||||||||||||||||||||||||||
Figures (Output of Computation) | |||||||||||||||||||||||||||||||||||||||||||||||||||||||||||||||||||||||||||||||||||||||
Input Parameters & R Code | |||||||||||||||||||||||||||||||||||||||||||||||||||||||||||||||||||||||||||||||||||||||
| Parameters (Session): | |||||||||||||||||||||||||||||||||||||||||||||||||||||||||||||||||||||||||||||||||||||||
| par1 = pearson ; par2 = two.sided ; | |||||||||||||||||||||||||||||||||||||||||||||||||||||||||||||||||||||||||||||||||||||||
| Parameters (R input): | |||||||||||||||||||||||||||||||||||||||||||||||||||||||||||||||||||||||||||||||||||||||
| par1 = pearson ; par2 = two.sided ; | |||||||||||||||||||||||||||||||||||||||||||||||||||||||||||||||||||||||||||||||||||||||
| R code (references can be found in the software module): | |||||||||||||||||||||||||||||||||||||||||||||||||||||||||||||||||||||||||||||||||||||||
bitmap(file='test1.png') | |||||||||||||||||||||||||||||||||||||||||||||||||||||||||||||||||||||||||||||||||||||||