Free Statistics
of Irreproducible Research!
Description of Statistical Computation | ||||||||||||||||||||||||||||||||||
|---|---|---|---|---|---|---|---|---|---|---|---|---|---|---|---|---|---|---|---|---|---|---|---|---|---|---|---|---|---|---|---|---|---|---|
| Author's title | ||||||||||||||||||||||||||||||||||
| Author | *The author of this computation has been verified* | |||||||||||||||||||||||||||||||||
| R Software Module | rwasp_Distributional Plots.wasp | |||||||||||||||||||||||||||||||||
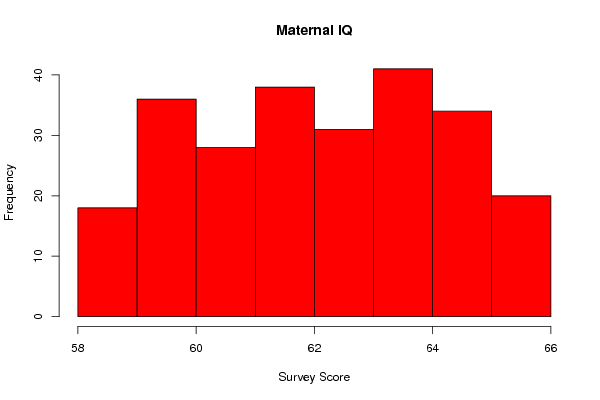
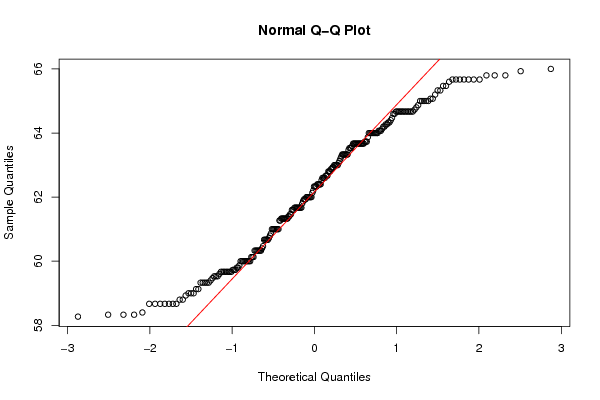
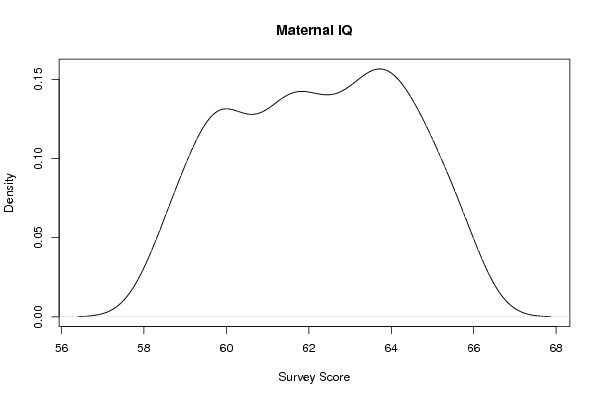
| Title produced by software | Histogram, QQplot and Density | |||||||||||||||||||||||||||||||||
| Date of computation | Thu, 13 Oct 2011 07:41:03 -0400 | |||||||||||||||||||||||||||||||||
| Cite this page as follows | Statistical Computations at FreeStatistics.org, Office for Research Development and Education, URL https://freestatistics.org/blog/index.php?v=date/2011/Oct/13/t1318506077onw6ht14x41142r.htm/, Retrieved Mon, 03 Aug 2026 03:05:49 +0000 | |||||||||||||||||||||||||||||||||
| Statistical Computations at FreeStatistics.org, Office for Research Development and Education, URL https://freestatistics.org/blog/index.php?pk=128644, Retrieved Mon, 03 Aug 2026 03:05:49 +0000 | ||||||||||||||||||||||||||||||||||
| QR Codes: | ||||||||||||||||||||||||||||||||||
|
| ||||||||||||||||||||||||||||||||||
| Original text written by user: | ||||||||||||||||||||||||||||||||||
| IsPrivate? | No (this computation is public) | |||||||||||||||||||||||||||||||||
| User-defined keywords | ||||||||||||||||||||||||||||||||||
| Estimated Impact | 499 | |||||||||||||||||||||||||||||||||
Tree of Dependent Computations | ||||||||||||||||||||||||||||||||||
| Family? (F = Feedback message, R = changed R code, M = changed R Module, P = changed Parameters, D = changed Data) | ||||||||||||||||||||||||||||||||||
| - [Histogram and QQplot] [PY2224 Aston Work...] [2009-10-06 09:57:09] [98fd0e87c3eb04e0cc2efde01dbafab6] - P [Histogram and QQplot] [olivia friday] [2009-10-09 12:41:21] [3fdd735c61ad38cbc9b3393dc997cdb7] - RMPD [Histogram and QQplot] [Reddy Moores Hist...] [2009-10-09 13:23:16] [98fd0e87c3eb04e0cc2efde01dbafab6] - RM [Histogram and QQPlot (Reddy-Moores Data)] [Histogram and QQP...] [2011-10-10 10:35:06] [98fd0e87c3eb04e0cc2efde01dbafab6] - RM [Histogram, QQplot and Density] [workshop - week 2] [2011-10-12 08:06:48] [72617798859a54657cdee39682e42a20] - R D [Histogram, QQplot and Density] [Histogram] [2011-10-13 11:17:50] [8c60ff0ea9ca69d00e25d4c2af5148c1] - D [Histogram, QQplot and Density] [histogram with 20...] [2011-10-13 11:41:03] [e5da91a4a4a2bb37f292412a4532c33b] [Current] | ||||||||||||||||||||||||||||||||||
| Feedback Forum | ||||||||||||||||||||||||||||||||||
Post a new message | ||||||||||||||||||||||||||||||||||
Dataset | ||||||||||||||||||||||||||||||||||
| Dataseries X: | ||||||||||||||||||||||||||||||||||
58.27 58.33 58.33 58.33 58.40 58.67 58.67 58.67 58.67 58.67 58.67 58.67 58.80 58.80 58.93 59.00 59.00 59.00 59.13 59.13 59.33 59.33 59.33 59.33 59.33 59.40 59.47 59.53 59.53 59.53 59.60 59.67 59.67 59.67 59.67 59.67 59.67 59.67 59.67 59.73 59.73 59.73 59.80 59.80 59.87 60.00 60.00 60.00 60.00 60.00 60.00 60.00 60.00 60.00 60.13 60.13 60.13 60.33 60.33 60.33 60.33 60.33 60.33 60.33 60.40 60.47 60.67 60.67 60.67 60.67 60.67 60.73 60.80 60.87 61.00 61.00 61.00 61.00 61.00 61.00 61.00 61.00 61.27 61.27 61.33 61.33 61.33 61.33 61.33 61.33 61.33 61.33 61.40 61.40 61.47 61.47 61.60 61.60 61.60 61.67 61.67 61.67 61.67 61.67 61.67 61.67 61.67 61.67 61.80 61.87 61.93 61.93 61.93 62.00 62.00 62.00 62.00 62.00 62.00 62.00 62.13 62.20 62.33 62.33 62.33 62.33 62.40 62.40 62.40 62.40 62.40 62.53 62.60 62.60 62.60 62.60 62.67 62.67 62.67 62.80 62.80 62.80 62.87 62.87 62.93 62.93 63.00 63.00 63.00 63.00 63.00 63.07 63.13 63.20 63.27 63.33 63.33 63.33 63.33 63.33 63.33 63.33 63.47 63.53 63.53 63.53 63.60 63.67 63.67 63.67 63.67 63.67 63.67 63.67 63.67 63.67 63.67 63.67 63.67 63.73 63.73 63.73 63.87 64.00 64.00 64.00 64.00 64.00 64.00 64.00 64.00 64.00 64.07 64.07 64.07 64.13 64.20 64.20 64.27 64.27 64.33 64.33 64.40 64.47 64.60 64.60 64.67 64.67 64.67 64.67 64.67 64.67 64.67 64.67 64.67 64.67 64.67 64.67 64.73 64.80 64.87 65.00 65.00 65.00 65.00 65.00 65.07 65.07 65.20 65.33 65.33 65.47 65.47 65.60 65.67 65.67 65.67 65.67 65.67 65.67 65.67 65.80 65.80 65.80 65.93 66.00 | ||||||||||||||||||||||||||||||||||
Tables (Output of Computation) | ||||||||||||||||||||||||||||||||||
| ||||||||||||||||||||||||||||||||||
Figures (Output of Computation) | ||||||||||||||||||||||||||||||||||
Input Parameters & R Code | ||||||||||||||||||||||||||||||||||
| Parameters (Session): | ||||||||||||||||||||||||||||||||||
| par1 = 10 ; | ||||||||||||||||||||||||||||||||||
| Parameters (R input): | ||||||||||||||||||||||||||||||||||
| par1 = 10 ; | ||||||||||||||||||||||||||||||||||
| R code (references can be found in the software module): | ||||||||||||||||||||||||||||||||||
bitmap(file='test1.png') | ||||||||||||||||||||||||||||||||||