Free Statistics

of Irreproducible Research!

Author's title

Author*The author of this computation has been verified*
R Software Modulerwasp_centraltendency.wasp
Title produced by softwareCentral Tendency
Date of computationTue, 15 Nov 2011 11:37:46 -0500
Cite this page as followsStatistical Computations at FreeStatistics.org, Office for Research Development and Education, URL https://freestatistics.org/blog/index.php?v=date/2011/Nov/15/t1321375121dq21sdouy0iv6te.htm/, Retrieved Fri, 19 Apr 2024 21:20:25 +0000
Statistical Computations at FreeStatistics.org, Office for Research Development and Education, URL https://freestatistics.org/blog/index.php?pk=143176, Retrieved Fri, 19 Apr 2024 21:20:25 +0000
QR Codes:

Original text written by user:
IsPrivate?No (this computation is public)
User-defined keywords
Estimated Impact105
Family? (F = Feedback message, R = changed R code, M = changed R Module, P = changed Parameters, D = changed Data)
-     [Central Tendency] [Arabica Price in ...] [2008-01-06 21:28:17] [74be16979710d4c4e7c6647856088456]
- RM D  [Central Tendency] [US car sales] [2010-11-06 13:18:47] [97ad38b1c3b35a5feca8b85f7bc7b3ff]
-    D    [Central Tendency] [Central tendency ...] [2010-11-06 16:38:19] [97ad38b1c3b35a5feca8b85f7bc7b3ff]
- R  D        [Central Tendency] [] [2011-11-15 16:37:46] [ce4468323d272130d499477f5e05a6d2] [Current]
Feedback Forum

Post a new message
Dataseries X:
127800
127700
128500
129400
128800
128800
131300
131100
131500
132900
133500
133400
134828
136488
135943
138717
139223
139869
140507
140259
139220
144033
144683
147354
148813
152657
155912
155271
161382
162106
164825
162810
163398
164844
165910
165774
164881
164861
165501
164334
162229
162748
163915
160890
159779
161106
160659
160007
158917
159052
159507
159107
159925
161327
159957
156997
159316
159793
161383
161828
162887
164071
163810
166708
168481
169913
169602
170559
170943


Summary of computational transaction
Raw Inputview raw input (R code)
Raw Outputview raw output of R engine
Computing time1 seconds
R Server'Herman Ole Andreas Wold' @ wold.wessa.net

\begin{tabular}{lllllllll}
\hline
Summary of computational transaction \tabularnewline
Raw Input & view raw input (R code)  \tabularnewline
Raw Output & view raw output of R engine  \tabularnewline
Computing time & 1 seconds \tabularnewline
R Server & 'Herman Ole Andreas Wold' @ wold.wessa.net \tabularnewline
\hline
\end{tabular}
%Source: https://freestatistics.org/blog/index.php?pk=143176&T=0

[TABLE]
[ROW][C]Summary of computational transaction[/C][/ROW]
[ROW][C]Raw Input[/C][C]view raw input (R code) [/C][/ROW]
[ROW][C]Raw Output[/C][C]view raw output of R engine [/C][/ROW]
[ROW][C]Computing time[/C][C]1 seconds[/C][/ROW]
[ROW][C]R Server[/C][C]'Herman Ole Andreas Wold' @ wold.wessa.net[/C][/ROW]
[/TABLE]
Source: https://freestatistics.org/blog/index.php?pk=143176&T=0

Globally Unique Identifier (entire table): ba.freestatistics.org/blog/index.php?pk=143176&T=0

As an alternative you can also use a QR Code:  

The GUIDs for individual cells are displayed in the table below:

Summary of computational transaction
Raw Inputview raw input (R code)
Raw Outputview raw output of R engine
Computing time1 seconds
R Server'Herman Ole Andreas Wold' @ wold.wessa.net


Central Tendency - Ungrouped Data
MeasureValueS.E.Value/S.E.
Arithmetic Mean152819.1159420291664.6982070132691.7998921956016
Geometric Mean152176.40358462
Harmonic Mean151509.33005464
Quadratic Mean153434.432789686
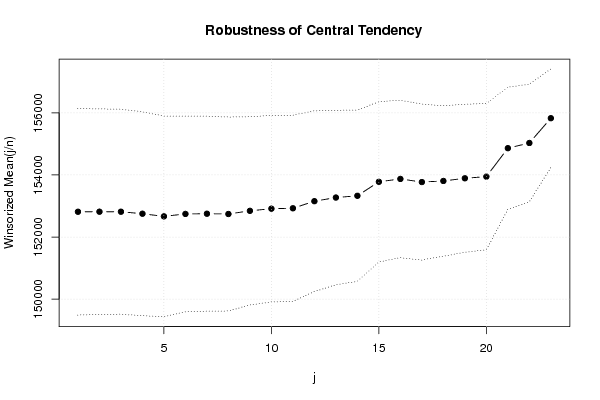
Winsorized Mean ( 1 / 23 )1528151663.4951576082891.8638081397921
Winsorized Mean ( 2 / 23 )152816.5652173911656.1711364200792.2709989667585
Winsorized Mean ( 3 / 23 )152816.0869565221651.331096263992.5411550126229
Winsorized Mean ( 4 / 23 )152751.1014492751641.895255199793.0334020794138
Winsorized Mean ( 5 / 23 )152666.1014492751615.3574153560194.509177967669
Winsorized Mean ( 6 / 23 )152744.5362318841576.0659007814496.91506944992
Winsorized Mean ( 7 / 23 )152751.0289855071570.2901845967997.2756694806254
Winsorized Mean ( 8 / 23 )152742.5652173911561.8104690967997.7984001514114
Winsorized Mean ( 9 / 23 )152844.3043478261516.29812404495100.80095854771
Winsorized Mean ( 10 / 23 )152913.8695652171502.02840188935101.804912192654
Winsorized Mean ( 11 / 23 )152927.1014492751498.66902077189102.041944772109
Winsorized Mean ( 12 / 23 )153154.7536231881454.86587980498105.270702783763
Winsorized Mean ( 13 / 23 )153272.318840581405.54539606432109.048287781924
Winsorized Mean ( 14 / 23 )153329.5362318841379.44929808094111.152716120261
Winsorized Mean ( 15 / 23 )153780.1884057971290.39418864749119.173032363839
Winsorized Mean ( 16 / 23 )153872.478260871267.6592769585121.38315165417
Winsorized Mean ( 17 / 23 )153771.7101449281255.96126038844122.433481823611
Winsorized Mean ( 18 / 23 )153806.9275362321212.50575258456126.85047242735
Winsorized Mean ( 19 / 23 )153893.1159420291192.06314138572129.098124586869
Winsorized Mean ( 20 / 23 )153947.0289855071178.01166611154130.68378982499
Winsorized Mean ( 21 / 23 )154862.202898551983.440279252279157.469859803072
Winsorized Mean ( 22 / 23 )155030.231884058945.666479263223163.937535361138
Winsorized Mean ( 23 / 23 )155827.898550725793.749563007425196.318720429036
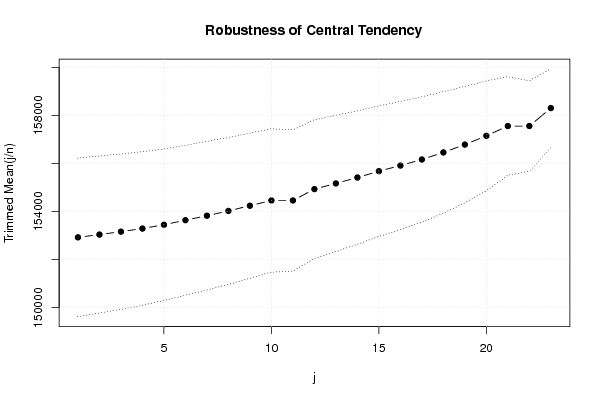
Trimmed Mean ( 1 / 23 )152923.522388061650.2394395239792.6674752314563
Trimmed Mean ( 2 / 23 )153038.7230769231633.4341201172893.6913960545497
Trimmed Mean ( 3 / 23 )153160.3809523811616.8834186380894.7256797780696
Trimmed Mean ( 4 / 23 )153290.1967213111598.0452244056695.9235661045344
Trimmed Mean ( 5 / 23 )153447.8135593221577.4124949169697.2781780629929
Trimmed Mean ( 6 / 23 )153637.0701754391559.0458975970998.5455722709862
Trimmed Mean ( 7 / 23 )153823.6909090911545.9398677379999.5017297368521
Trimmed Mean ( 8 / 23 )154023.1886792451529.32823600816100.712969951615
Trimmed Mean ( 9 / 23 )154239.7647058821508.7236614887102.231951843116
Trimmed Mean ( 10 / 23 )154458.1020408161491.68225818769103.546248668583
Trimmed Mean ( 11 / 23 )154458.1020408161471.18376718076104.988992868515
Trimmed Mean ( 12 / 23 )154929.8222222221443.32081920843107.342608906031
Trimmed Mean ( 13 / 23 )155167.1860465121415.83083671791109.594438842857
Trimmed Mean ( 14 / 23 )155412.4878048781389.02472546517111.886048502723
Trimmed Mean ( 15 / 23 )155675.7179487181356.84168826076114.73388479703
Trimmed Mean ( 16 / 23 )155911.3783783781334.13601759358116.863180607027
Trimmed Mean ( 17 / 23 )156162.61305.33898054017119.633752096622
Trimmed Mean ( 18 / 23 )156456.6666666671263.37465326806123.840276723891
Trimmed Mean ( 19 / 23 )156784.3225806451211.80128999101129.381214457866
Trimmed Mean ( 20 / 23 )157146.3793103451138.48565201189138.031058215483
Trimmed Mean ( 21 / 23 )157555.1851851851026.51046380407153.486194969034
Trimmed Mean ( 22 / 23 )157555.185185185941.530913494967167.339364992637
Trimmed Mean ( 23 / 23 )158301.695652174814.63826554784194.321458182076
Median159779
Midrange149321.5
Midmean - Weighted Average at Xnp155949.794117647
Midmean - Weighted Average at X(n+1)p156162.6
Midmean - Empirical Distribution Function156162.6
Midmean - Empirical Distribution Function - Averaging156162.6
Midmean - Empirical Distribution Function - Interpolation156162.6
Midmean - Closest Observation155691.972222222
Midmean - True Basic - Statistics Graphics Toolkit156162.6
Midmean - MS Excel (old versions)156162.6
Number of observations69

\begin{tabular}{lllllllll}
\hline
Central Tendency - Ungrouped Data \tabularnewline
Measure & Value & S.E. & Value/S.E. \tabularnewline
Arithmetic Mean & 152819.115942029 & 1664.69820701326 & 91.7998921956016 \tabularnewline
Geometric Mean & 152176.40358462 &  &  \tabularnewline
Harmonic Mean & 151509.33005464 &  &  \tabularnewline
Quadratic Mean & 153434.432789686 &  &  \tabularnewline
Winsorized Mean ( 1 / 23 ) & 152815 & 1663.49515760828 & 91.8638081397921 \tabularnewline
Winsorized Mean ( 2 / 23 ) & 152816.565217391 & 1656.17113642007 & 92.2709989667585 \tabularnewline
Winsorized Mean ( 3 / 23 ) & 152816.086956522 & 1651.3310962639 & 92.5411550126229 \tabularnewline
Winsorized Mean ( 4 / 23 ) & 152751.101449275 & 1641.8952551997 & 93.0334020794138 \tabularnewline
Winsorized Mean ( 5 / 23 ) & 152666.101449275 & 1615.35741535601 & 94.509177967669 \tabularnewline
Winsorized Mean ( 6 / 23 ) & 152744.536231884 & 1576.06590078144 & 96.91506944992 \tabularnewline
Winsorized Mean ( 7 / 23 ) & 152751.028985507 & 1570.29018459679 & 97.2756694806254 \tabularnewline
Winsorized Mean ( 8 / 23 ) & 152742.565217391 & 1561.81046909679 & 97.7984001514114 \tabularnewline
Winsorized Mean ( 9 / 23 ) & 152844.304347826 & 1516.29812404495 & 100.80095854771 \tabularnewline
Winsorized Mean ( 10 / 23 ) & 152913.869565217 & 1502.02840188935 & 101.804912192654 \tabularnewline
Winsorized Mean ( 11 / 23 ) & 152927.101449275 & 1498.66902077189 & 102.041944772109 \tabularnewline
Winsorized Mean ( 12 / 23 ) & 153154.753623188 & 1454.86587980498 & 105.270702783763 \tabularnewline
Winsorized Mean ( 13 / 23 ) & 153272.31884058 & 1405.54539606432 & 109.048287781924 \tabularnewline
Winsorized Mean ( 14 / 23 ) & 153329.536231884 & 1379.44929808094 & 111.152716120261 \tabularnewline
Winsorized Mean ( 15 / 23 ) & 153780.188405797 & 1290.39418864749 & 119.173032363839 \tabularnewline
Winsorized Mean ( 16 / 23 ) & 153872.47826087 & 1267.6592769585 & 121.38315165417 \tabularnewline
Winsorized Mean ( 17 / 23 ) & 153771.710144928 & 1255.96126038844 & 122.433481823611 \tabularnewline
Winsorized Mean ( 18 / 23 ) & 153806.927536232 & 1212.50575258456 & 126.85047242735 \tabularnewline
Winsorized Mean ( 19 / 23 ) & 153893.115942029 & 1192.06314138572 & 129.098124586869 \tabularnewline
Winsorized Mean ( 20 / 23 ) & 153947.028985507 & 1178.01166611154 & 130.68378982499 \tabularnewline
Winsorized Mean ( 21 / 23 ) & 154862.202898551 & 983.440279252279 & 157.469859803072 \tabularnewline
Winsorized Mean ( 22 / 23 ) & 155030.231884058 & 945.666479263223 & 163.937535361138 \tabularnewline
Winsorized Mean ( 23 / 23 ) & 155827.898550725 & 793.749563007425 & 196.318720429036 \tabularnewline
Trimmed Mean ( 1 / 23 ) & 152923.52238806 & 1650.23943952397 & 92.6674752314563 \tabularnewline
Trimmed Mean ( 2 / 23 ) & 153038.723076923 & 1633.43412011728 & 93.6913960545497 \tabularnewline
Trimmed Mean ( 3 / 23 ) & 153160.380952381 & 1616.88341863808 & 94.7256797780696 \tabularnewline
Trimmed Mean ( 4 / 23 ) & 153290.196721311 & 1598.04522440566 & 95.9235661045344 \tabularnewline
Trimmed Mean ( 5 / 23 ) & 153447.813559322 & 1577.41249491696 & 97.2781780629929 \tabularnewline
Trimmed Mean ( 6 / 23 ) & 153637.070175439 & 1559.04589759709 & 98.5455722709862 \tabularnewline
Trimmed Mean ( 7 / 23 ) & 153823.690909091 & 1545.93986773799 & 99.5017297368521 \tabularnewline
Trimmed Mean ( 8 / 23 ) & 154023.188679245 & 1529.32823600816 & 100.712969951615 \tabularnewline
Trimmed Mean ( 9 / 23 ) & 154239.764705882 & 1508.7236614887 & 102.231951843116 \tabularnewline
Trimmed Mean ( 10 / 23 ) & 154458.102040816 & 1491.68225818769 & 103.546248668583 \tabularnewline
Trimmed Mean ( 11 / 23 ) & 154458.102040816 & 1471.18376718076 & 104.988992868515 \tabularnewline
Trimmed Mean ( 12 / 23 ) & 154929.822222222 & 1443.32081920843 & 107.342608906031 \tabularnewline
Trimmed Mean ( 13 / 23 ) & 155167.186046512 & 1415.83083671791 & 109.594438842857 \tabularnewline
Trimmed Mean ( 14 / 23 ) & 155412.487804878 & 1389.02472546517 & 111.886048502723 \tabularnewline
Trimmed Mean ( 15 / 23 ) & 155675.717948718 & 1356.84168826076 & 114.73388479703 \tabularnewline
Trimmed Mean ( 16 / 23 ) & 155911.378378378 & 1334.13601759358 & 116.863180607027 \tabularnewline
Trimmed Mean ( 17 / 23 ) & 156162.6 & 1305.33898054017 & 119.633752096622 \tabularnewline
Trimmed Mean ( 18 / 23 ) & 156456.666666667 & 1263.37465326806 & 123.840276723891 \tabularnewline
Trimmed Mean ( 19 / 23 ) & 156784.322580645 & 1211.80128999101 & 129.381214457866 \tabularnewline
Trimmed Mean ( 20 / 23 ) & 157146.379310345 & 1138.48565201189 & 138.031058215483 \tabularnewline
Trimmed Mean ( 21 / 23 ) & 157555.185185185 & 1026.51046380407 & 153.486194969034 \tabularnewline
Trimmed Mean ( 22 / 23 ) & 157555.185185185 & 941.530913494967 & 167.339364992637 \tabularnewline
Trimmed Mean ( 23 / 23 ) & 158301.695652174 & 814.63826554784 & 194.321458182076 \tabularnewline
Median & 159779 &  &  \tabularnewline
Midrange & 149321.5 &  &  \tabularnewline
Midmean - Weighted Average at Xnp & 155949.794117647 &  &  \tabularnewline
Midmean - Weighted Average at X(n+1)p & 156162.6 &  &  \tabularnewline
Midmean - Empirical Distribution Function & 156162.6 &  &  \tabularnewline
Midmean - Empirical Distribution Function - Averaging & 156162.6 &  &  \tabularnewline
Midmean - Empirical Distribution Function - Interpolation & 156162.6 &  &  \tabularnewline
Midmean - Closest Observation & 155691.972222222 &  &  \tabularnewline
Midmean - True Basic - Statistics Graphics Toolkit & 156162.6 &  &  \tabularnewline
Midmean - MS Excel (old versions) & 156162.6 &  &  \tabularnewline
Number of observations & 69 &  &  \tabularnewline
\hline
\end{tabular}
%Source: https://freestatistics.org/blog/index.php?pk=143176&T=1

[TABLE]
[ROW][C]Central Tendency - Ungrouped Data[/C][/ROW]
[ROW][C]Measure[/C][C]Value[/C][C]S.E.[/C][C]Value/S.E.[/C][/ROW]
[ROW][C]Arithmetic Mean[/C][C]152819.115942029[/C][C]1664.69820701326[/C][C]91.7998921956016[/C][/ROW]
[ROW][C]Geometric Mean[/C][C]152176.40358462[/C][C][/C][C][/C][/ROW]
[ROW][C]Harmonic Mean[/C][C]151509.33005464[/C][C][/C][C][/C][/ROW]
[ROW][C]Quadratic Mean[/C][C]153434.432789686[/C][C][/C][C][/C][/ROW]
[ROW][C]Winsorized Mean ( 1 / 23 )[/C][C]152815[/C][C]1663.49515760828[/C][C]91.8638081397921[/C][/ROW]
[ROW][C]Winsorized Mean ( 2 / 23 )[/C][C]152816.565217391[/C][C]1656.17113642007[/C][C]92.2709989667585[/C][/ROW]
[ROW][C]Winsorized Mean ( 3 / 23 )[/C][C]152816.086956522[/C][C]1651.3310962639[/C][C]92.5411550126229[/C][/ROW]
[ROW][C]Winsorized Mean ( 4 / 23 )[/C][C]152751.101449275[/C][C]1641.8952551997[/C][C]93.0334020794138[/C][/ROW]
[ROW][C]Winsorized Mean ( 5 / 23 )[/C][C]152666.101449275[/C][C]1615.35741535601[/C][C]94.509177967669[/C][/ROW]
[ROW][C]Winsorized Mean ( 6 / 23 )[/C][C]152744.536231884[/C][C]1576.06590078144[/C][C]96.91506944992[/C][/ROW]
[ROW][C]Winsorized Mean ( 7 / 23 )[/C][C]152751.028985507[/C][C]1570.29018459679[/C][C]97.2756694806254[/C][/ROW]
[ROW][C]Winsorized Mean ( 8 / 23 )[/C][C]152742.565217391[/C][C]1561.81046909679[/C][C]97.7984001514114[/C][/ROW]
[ROW][C]Winsorized Mean ( 9 / 23 )[/C][C]152844.304347826[/C][C]1516.29812404495[/C][C]100.80095854771[/C][/ROW]
[ROW][C]Winsorized Mean ( 10 / 23 )[/C][C]152913.869565217[/C][C]1502.02840188935[/C][C]101.804912192654[/C][/ROW]
[ROW][C]Winsorized Mean ( 11 / 23 )[/C][C]152927.101449275[/C][C]1498.66902077189[/C][C]102.041944772109[/C][/ROW]
[ROW][C]Winsorized Mean ( 12 / 23 )[/C][C]153154.753623188[/C][C]1454.86587980498[/C][C]105.270702783763[/C][/ROW]
[ROW][C]Winsorized Mean ( 13 / 23 )[/C][C]153272.31884058[/C][C]1405.54539606432[/C][C]109.048287781924[/C][/ROW]
[ROW][C]Winsorized Mean ( 14 / 23 )[/C][C]153329.536231884[/C][C]1379.44929808094[/C][C]111.152716120261[/C][/ROW]
[ROW][C]Winsorized Mean ( 15 / 23 )[/C][C]153780.188405797[/C][C]1290.39418864749[/C][C]119.173032363839[/C][/ROW]
[ROW][C]Winsorized Mean ( 16 / 23 )[/C][C]153872.47826087[/C][C]1267.6592769585[/C][C]121.38315165417[/C][/ROW]
[ROW][C]Winsorized Mean ( 17 / 23 )[/C][C]153771.710144928[/C][C]1255.96126038844[/C][C]122.433481823611[/C][/ROW]
[ROW][C]Winsorized Mean ( 18 / 23 )[/C][C]153806.927536232[/C][C]1212.50575258456[/C][C]126.85047242735[/C][/ROW]
[ROW][C]Winsorized Mean ( 19 / 23 )[/C][C]153893.115942029[/C][C]1192.06314138572[/C][C]129.098124586869[/C][/ROW]
[ROW][C]Winsorized Mean ( 20 / 23 )[/C][C]153947.028985507[/C][C]1178.01166611154[/C][C]130.68378982499[/C][/ROW]
[ROW][C]Winsorized Mean ( 21 / 23 )[/C][C]154862.202898551[/C][C]983.440279252279[/C][C]157.469859803072[/C][/ROW]
[ROW][C]Winsorized Mean ( 22 / 23 )[/C][C]155030.231884058[/C][C]945.666479263223[/C][C]163.937535361138[/C][/ROW]
[ROW][C]Winsorized Mean ( 23 / 23 )[/C][C]155827.898550725[/C][C]793.749563007425[/C][C]196.318720429036[/C][/ROW]
[ROW][C]Trimmed Mean ( 1 / 23 )[/C][C]152923.52238806[/C][C]1650.23943952397[/C][C]92.6674752314563[/C][/ROW]
[ROW][C]Trimmed Mean ( 2 / 23 )[/C][C]153038.723076923[/C][C]1633.43412011728[/C][C]93.6913960545497[/C][/ROW]
[ROW][C]Trimmed Mean ( 3 / 23 )[/C][C]153160.380952381[/C][C]1616.88341863808[/C][C]94.7256797780696[/C][/ROW]
[ROW][C]Trimmed Mean ( 4 / 23 )[/C][C]153290.196721311[/C][C]1598.04522440566[/C][C]95.9235661045344[/C][/ROW]
[ROW][C]Trimmed Mean ( 5 / 23 )[/C][C]153447.813559322[/C][C]1577.41249491696[/C][C]97.2781780629929[/C][/ROW]
[ROW][C]Trimmed Mean ( 6 / 23 )[/C][C]153637.070175439[/C][C]1559.04589759709[/C][C]98.5455722709862[/C][/ROW]
[ROW][C]Trimmed Mean ( 7 / 23 )[/C][C]153823.690909091[/C][C]1545.93986773799[/C][C]99.5017297368521[/C][/ROW]
[ROW][C]Trimmed Mean ( 8 / 23 )[/C][C]154023.188679245[/C][C]1529.32823600816[/C][C]100.712969951615[/C][/ROW]
[ROW][C]Trimmed Mean ( 9 / 23 )[/C][C]154239.764705882[/C][C]1508.7236614887[/C][C]102.231951843116[/C][/ROW]
[ROW][C]Trimmed Mean ( 10 / 23 )[/C][C]154458.102040816[/C][C]1491.68225818769[/C][C]103.546248668583[/C][/ROW]
[ROW][C]Trimmed Mean ( 11 / 23 )[/C][C]154458.102040816[/C][C]1471.18376718076[/C][C]104.988992868515[/C][/ROW]
[ROW][C]Trimmed Mean ( 12 / 23 )[/C][C]154929.822222222[/C][C]1443.32081920843[/C][C]107.342608906031[/C][/ROW]
[ROW][C]Trimmed Mean ( 13 / 23 )[/C][C]155167.186046512[/C][C]1415.83083671791[/C][C]109.594438842857[/C][/ROW]
[ROW][C]Trimmed Mean ( 14 / 23 )[/C][C]155412.487804878[/C][C]1389.02472546517[/C][C]111.886048502723[/C][/ROW]
[ROW][C]Trimmed Mean ( 15 / 23 )[/C][C]155675.717948718[/C][C]1356.84168826076[/C][C]114.73388479703[/C][/ROW]
[ROW][C]Trimmed Mean ( 16 / 23 )[/C][C]155911.378378378[/C][C]1334.13601759358[/C][C]116.863180607027[/C][/ROW]
[ROW][C]Trimmed Mean ( 17 / 23 )[/C][C]156162.6[/C][C]1305.33898054017[/C][C]119.633752096622[/C][/ROW]
[ROW][C]Trimmed Mean ( 18 / 23 )[/C][C]156456.666666667[/C][C]1263.37465326806[/C][C]123.840276723891[/C][/ROW]
[ROW][C]Trimmed Mean ( 19 / 23 )[/C][C]156784.322580645[/C][C]1211.80128999101[/C][C]129.381214457866[/C][/ROW]
[ROW][C]Trimmed Mean ( 20 / 23 )[/C][C]157146.379310345[/C][C]1138.48565201189[/C][C]138.031058215483[/C][/ROW]
[ROW][C]Trimmed Mean ( 21 / 23 )[/C][C]157555.185185185[/C][C]1026.51046380407[/C][C]153.486194969034[/C][/ROW]
[ROW][C]Trimmed Mean ( 22 / 23 )[/C][C]157555.185185185[/C][C]941.530913494967[/C][C]167.339364992637[/C][/ROW]
[ROW][C]Trimmed Mean ( 23 / 23 )[/C][C]158301.695652174[/C][C]814.63826554784[/C][C]194.321458182076[/C][/ROW]
[ROW][C]Median[/C][C]159779[/C][C][/C][C][/C][/ROW]
[ROW][C]Midrange[/C][C]149321.5[/C][C][/C][C][/C][/ROW]
[ROW][C]Midmean - Weighted Average at Xnp[/C][C]155949.794117647[/C][C][/C][C][/C][/ROW]
[ROW][C]Midmean - Weighted Average at X(n+1)p[/C][C]156162.6[/C][C][/C][C][/C][/ROW]
[ROW][C]Midmean - Empirical Distribution Function[/C][C]156162.6[/C][C][/C][C][/C][/ROW]
[ROW][C]Midmean - Empirical Distribution Function - Averaging[/C][C]156162.6[/C][C][/C][C][/C][/ROW]
[ROW][C]Midmean - Empirical Distribution Function - Interpolation[/C][C]156162.6[/C][C][/C][C][/C][/ROW]
[ROW][C]Midmean - Closest Observation[/C][C]155691.972222222[/C][C][/C][C][/C][/ROW]
[ROW][C]Midmean - True Basic - Statistics Graphics Toolkit[/C][C]156162.6[/C][C][/C][C][/C][/ROW]
[ROW][C]Midmean - MS Excel (old versions)[/C][C]156162.6[/C][C][/C][C][/C][/ROW]
[ROW][C]Number of observations[/C][C]69[/C][C][/C][C][/C][/ROW]
[/TABLE]
Source: https://freestatistics.org/blog/index.php?pk=143176&T=1

Globally Unique Identifier (entire table): ba.freestatistics.org/blog/index.php?pk=143176&T=1

As an alternative you can also use a QR Code:  

The GUIDs for individual cells are displayed in the table below:

Central Tendency - Ungrouped Data
MeasureValueS.E.Value/S.E.
Arithmetic Mean152819.1159420291664.6982070132691.7998921956016
Geometric Mean152176.40358462
Harmonic Mean151509.33005464
Quadratic Mean153434.432789686
Winsorized Mean ( 1 / 23 )1528151663.4951576082891.8638081397921
Winsorized Mean ( 2 / 23 )152816.5652173911656.1711364200792.2709989667585
Winsorized Mean ( 3 / 23 )152816.0869565221651.331096263992.5411550126229
Winsorized Mean ( 4 / 23 )152751.1014492751641.895255199793.0334020794138
Winsorized Mean ( 5 / 23 )152666.1014492751615.3574153560194.509177967669
Winsorized Mean ( 6 / 23 )152744.5362318841576.0659007814496.91506944992
Winsorized Mean ( 7 / 23 )152751.0289855071570.2901845967997.2756694806254
Winsorized Mean ( 8 / 23 )152742.5652173911561.8104690967997.7984001514114
Winsorized Mean ( 9 / 23 )152844.3043478261516.29812404495100.80095854771
Winsorized Mean ( 10 / 23 )152913.8695652171502.02840188935101.804912192654
Winsorized Mean ( 11 / 23 )152927.1014492751498.66902077189102.041944772109
Winsorized Mean ( 12 / 23 )153154.7536231881454.86587980498105.270702783763
Winsorized Mean ( 13 / 23 )153272.318840581405.54539606432109.048287781924
Winsorized Mean ( 14 / 23 )153329.5362318841379.44929808094111.152716120261
Winsorized Mean ( 15 / 23 )153780.1884057971290.39418864749119.173032363839
Winsorized Mean ( 16 / 23 )153872.478260871267.6592769585121.38315165417
Winsorized Mean ( 17 / 23 )153771.7101449281255.96126038844122.433481823611
Winsorized Mean ( 18 / 23 )153806.9275362321212.50575258456126.85047242735
Winsorized Mean ( 19 / 23 )153893.1159420291192.06314138572129.098124586869
Winsorized Mean ( 20 / 23 )153947.0289855071178.01166611154130.68378982499
Winsorized Mean ( 21 / 23 )154862.202898551983.440279252279157.469859803072
Winsorized Mean ( 22 / 23 )155030.231884058945.666479263223163.937535361138
Winsorized Mean ( 23 / 23 )155827.898550725793.749563007425196.318720429036
Trimmed Mean ( 1 / 23 )152923.522388061650.2394395239792.6674752314563
Trimmed Mean ( 2 / 23 )153038.7230769231633.4341201172893.6913960545497
Trimmed Mean ( 3 / 23 )153160.3809523811616.8834186380894.7256797780696
Trimmed Mean ( 4 / 23 )153290.1967213111598.0452244056695.9235661045344
Trimmed Mean ( 5 / 23 )153447.8135593221577.4124949169697.2781780629929
Trimmed Mean ( 6 / 23 )153637.0701754391559.0458975970998.5455722709862
Trimmed Mean ( 7 / 23 )153823.6909090911545.9398677379999.5017297368521
Trimmed Mean ( 8 / 23 )154023.1886792451529.32823600816100.712969951615
Trimmed Mean ( 9 / 23 )154239.7647058821508.7236614887102.231951843116
Trimmed Mean ( 10 / 23 )154458.1020408161491.68225818769103.546248668583
Trimmed Mean ( 11 / 23 )154458.1020408161471.18376718076104.988992868515
Trimmed Mean ( 12 / 23 )154929.8222222221443.32081920843107.342608906031
Trimmed Mean ( 13 / 23 )155167.1860465121415.83083671791109.594438842857
Trimmed Mean ( 14 / 23 )155412.4878048781389.02472546517111.886048502723
Trimmed Mean ( 15 / 23 )155675.7179487181356.84168826076114.73388479703
Trimmed Mean ( 16 / 23 )155911.3783783781334.13601759358116.863180607027
Trimmed Mean ( 17 / 23 )156162.61305.33898054017119.633752096622
Trimmed Mean ( 18 / 23 )156456.6666666671263.37465326806123.840276723891
Trimmed Mean ( 19 / 23 )156784.3225806451211.80128999101129.381214457866
Trimmed Mean ( 20 / 23 )157146.3793103451138.48565201189138.031058215483
Trimmed Mean ( 21 / 23 )157555.1851851851026.51046380407153.486194969034
Trimmed Mean ( 22 / 23 )157555.185185185941.530913494967167.339364992637
Trimmed Mean ( 23 / 23 )158301.695652174814.63826554784194.321458182076
Median159779
Midrange149321.5
Midmean - Weighted Average at Xnp155949.794117647
Midmean - Weighted Average at X(n+1)p156162.6
Midmean - Empirical Distribution Function156162.6
Midmean - Empirical Distribution Function - Averaging156162.6
Midmean - Empirical Distribution Function - Interpolation156162.6
Midmean - Closest Observation155691.972222222
Midmean - True Basic - Statistics Graphics Toolkit156162.6
Midmean - MS Excel (old versions)156162.6
Number of observations69


Parameters (Session):
Parameters (R input):
R code (references can be found in the software module):
geomean <- function(x) {
return(exp(mean(log(x))))
}
harmean <- function(x) {
return(1/mean(1/x))
}
quamean <- function(x) {
return(sqrt(mean(x*x)))
}
winmean <- function(x) {
x <-sort(x[!is.na(x)])
n<-length(x)
denom <- 3
nodenom <- n/denom
if (nodenom>40) denom <- n/40
sqrtn = sqrt(n)
roundnodenom = floor(nodenom)
win <- array(NA,dim=c(roundnodenom,2))
for (j in 1:roundnodenom) {
win[j,1] <- (j*x[j+1]+sum(x[(j+1):(n-j)])+j*x[n-j])/n
win[j,2] <- sd(c(rep(x[j+1],j),x[(j+1):(n-j)],rep(x[n-j],j)))/sqrtn
}
return(win)
}
trimean <- function(x) {
x <-sort(x[!is.na(x)])
n<-length(x)
denom <- 3
nodenom <- n/denom
if (nodenom>40) denom <- n/40
sqrtn = sqrt(n)
roundnodenom = floor(nodenom)
tri <- array(NA,dim=c(roundnodenom,2))
for (j in 1:roundnodenom) {
tri[j,1] <- mean(x,trim=j/n)
tri[j,2] <- sd(x[(j+1):(n-j)]) / sqrt(n-j*2)
}
return(tri)
}
midrange <- function(x) {
return((max(x)+min(x))/2)
}
q1 <- function(data,n,p,i,f) {
np <- n*p;
i <<- floor(np)
f <<- np - i
qvalue <- (1-f)*data[i] + f*data[i+1]
}
q2 <- function(data,n,p,i,f) {
np <- (n+1)*p
i <<- floor(np)
f <<- np - i
qvalue <- (1-f)*data[i] + f*data[i+1]
}
q3 <- function(data,n,p,i,f) {
np <- n*p
i <<- floor(np)
f <<- np - i
if (f==0) {
qvalue <- data[i]
} else {
qvalue <- data[i+1]
}
}
q4 <- function(data,n,p,i,f) {
np <- n*p
i <<- floor(np)
f <<- np - i
if (f==0) {
qvalue <- (data[i]+data[i+1])/2
} else {
qvalue <- data[i+1]
}
}
q5 <- function(data,n,p,i,f) {
np <- (n-1)*p
i <<- floor(np)
f <<- np - i
if (f==0) {
qvalue <- data[i+1]
} else {
qvalue <- data[i+1] + f*(data[i+2]-data[i+1])
}
}
q6 <- function(data,n,p,i,f) {
np <- n*p+0.5
i <<- floor(np)
f <<- np - i
qvalue <- data[i]
}
q7 <- function(data,n,p,i,f) {
np <- (n+1)*p
i <<- floor(np)
f <<- np - i
if (f==0) {
qvalue <- data[i]
} else {
qvalue <- f*data[i] + (1-f)*data[i+1]
}
}
q8 <- function(data,n,p,i,f) {
np <- (n+1)*p
i <<- floor(np)
f <<- np - i
if (f==0) {
qvalue <- data[i]
} else {
if (f == 0.5) {
qvalue <- (data[i]+data[i+1])/2
} else {
if (f < 0.5) {
qvalue <- data[i]
} else {
qvalue <- data[i+1]
}
}
}
}
midmean <- function(x,def) {
x <-sort(x[!is.na(x)])
n<-length(x)
if (def==1) {
qvalue1 <- q1(x,n,0.25,i,f)
qvalue3 <- q1(x,n,0.75,i,f)
}
if (def==2) {
qvalue1 <- q2(x,n,0.25,i,f)
qvalue3 <- q2(x,n,0.75,i,f)
}
if (def==3) {
qvalue1 <- q3(x,n,0.25,i,f)
qvalue3 <- q3(x,n,0.75,i,f)
}
if (def==4) {
qvalue1 <- q4(x,n,0.25,i,f)
qvalue3 <- q4(x,n,0.75,i,f)
}
if (def==5) {
qvalue1 <- q5(x,n,0.25,i,f)
qvalue3 <- q5(x,n,0.75,i,f)
}
if (def==6) {
qvalue1 <- q6(x,n,0.25,i,f)
qvalue3 <- q6(x,n,0.75,i,f)
}
if (def==7) {
qvalue1 <- q7(x,n,0.25,i,f)
qvalue3 <- q7(x,n,0.75,i,f)
}
if (def==8) {
qvalue1 <- q8(x,n,0.25,i,f)
qvalue3 <- q8(x,n,0.75,i,f)
}
midm <- 0
myn <- 0
roundno4 <- round(n/4)
round3no4 <- round(3*n/4)
for (i in 1:n) {
if ((x[i]>=qvalue1) & (x[i]<=qvalue3)){
midm = midm + x[i]
myn = myn + 1
}
}
midm = midm / myn
return(midm)
}
(arm <- mean(x))
sqrtn <- sqrt(length(x))
(armse <- sd(x) / sqrtn)
(armose <- arm / armse)
(geo <- geomean(x))
(har <- harmean(x))
(qua <- quamean(x))
(win <- winmean(x))
(tri <- trimean(x))
(midr <- midrange(x))
midm <- array(NA,dim=8)
for (j in 1:8) midm[j] <- midmean(x,j)
midm
bitmap(file='test1.png')
lb <- win[,1] - 2*win[,2]
ub <- win[,1] + 2*win[,2]
if ((ylimmin == '') | (ylimmax == '')) plot(win[,1],type='b',main=main, xlab='j', pch=19, ylab='Winsorized Mean(j/n)', ylim=c(min(lb),max(ub))) else plot(win[,1],type='l',main=main, xlab='j', pch=19, ylab='Winsorized Mean(j/n)', ylim=c(ylimmin,ylimmax))
lines(ub,lty=3)
lines(lb,lty=3)
grid()
dev.off()
bitmap(file='test2.png')
lb <- tri[,1] - 2*tri[,2]
ub <- tri[,1] + 2*tri[,2]
if ((ylimmin == '') | (ylimmax == '')) plot(tri[,1],type='b',main=main, xlab='j', pch=19, ylab='Trimmed Mean(j/n)', ylim=c(min(lb),max(ub))) else plot(tri[,1],type='l',main=main, xlab='j', pch=19, ylab='Trimmed Mean(j/n)', ylim=c(ylimmin,ylimmax))
lines(ub,lty=3)
lines(lb,lty=3)
grid()
dev.off()
load(file='createtable')
a<-table.start()
a<-table.row.start(a)
a<-table.element(a,'Central Tendency - Ungrouped Data',4,TRUE)
a<-table.row.end(a)
a<-table.row.start(a)
a<-table.element(a,'Measure',header=TRUE)
a<-table.element(a,'Value',header=TRUE)
a<-table.element(a,'S.E.',header=TRUE)
a<-table.element(a,'Value/S.E.',header=TRUE)
a<-table.row.end(a)
a<-table.row.start(a)
a<-table.element(a,hyperlink('arithmetic_mean.htm', 'Arithmetic Mean', 'click to view the definition of the Arithmetic Mean'),header=TRUE)
a<-table.element(a,arm)
a<-table.element(a,hyperlink('arithmetic_mean_standard_error.htm', armse, 'click to view the definition of the Standard Error of the Arithmetic Mean'))
a<-table.element(a,armose)
a<-table.row.end(a)
a<-table.row.start(a)
a<-table.element(a,hyperlink('geometric_mean.htm', 'Geometric Mean', 'click to view the definition of the Geometric Mean'),header=TRUE)
a<-table.element(a,geo)
a<-table.element(a,'')
a<-table.row.end(a)
a<-table.row.start(a)
a<-table.element(a,hyperlink('harmonic_mean.htm', 'Harmonic Mean', 'click to view the definition of the Harmonic Mean'),header=TRUE)
a<-table.element(a,har)
a<-table.element(a,'')
a<-table.row.end(a)
a<-table.row.start(a)
a<-table.element(a,hyperlink('quadratic_mean.htm', 'Quadratic Mean', 'click to view the definition of the Quadratic Mean'),header=TRUE)
a<-table.element(a,qua)
a<-table.element(a,'')
a<-table.row.end(a)
for (j in 1:length(win[,1])) {
a<-table.row.start(a)
mylabel <- paste('Winsorized Mean (',j)
mylabel <- paste(mylabel,'/')
mylabel <- paste(mylabel,length(win[,1]))
mylabel <- paste(mylabel,')')
a<-table.element(a,hyperlink('winsorized_mean.htm', mylabel, 'click to view the definition of the Winsorized Mean'),header=TRUE)
a<-table.element(a,win[j,1])
a<-table.element(a,win[j,2])
a<-table.element(a,win[j,1]/win[j,2])
a<-table.row.end(a)
}
for (j in 1:length(tri[,1])) {
a<-table.row.start(a)
mylabel <- paste('Trimmed Mean (',j)
mylabel <- paste(mylabel,'/')
mylabel <- paste(mylabel,length(tri[,1]))
mylabel <- paste(mylabel,')')
a<-table.element(a,hyperlink('arithmetic_mean.htm', mylabel, 'click to view the definition of the Trimmed Mean'),header=TRUE)
a<-table.element(a,tri[j,1])
a<-table.element(a,tri[j,2])
a<-table.element(a,tri[j,1]/tri[j,2])
a<-table.row.end(a)
}
a<-table.row.start(a)
a<-table.element(a,hyperlink('median_1.htm', 'Median', 'click to view the definition of the Median'),header=TRUE)
a<-table.element(a,median(x))
a<-table.element(a,'')
a<-table.row.end(a)
a<-table.row.start(a)
a<-table.element(a,hyperlink('midrange.htm', 'Midrange', 'click to view the definition of the Midrange'),header=TRUE)
a<-table.element(a,midr)
a<-table.element(a,'')
a<-table.row.end(a)
a<-table.row.start(a)
mymid <- hyperlink('midmean.htm', 'Midmean', 'click to view the definition of the Midmean')
mylabel <- paste(mymid,hyperlink('method_1.htm','Weighted Average at Xnp',''),sep=' - ')
a<-table.element(a,mylabel,header=TRUE)
a<-table.element(a,midm[1])
a<-table.element(a,'')
a<-table.row.end(a)
a<-table.row.start(a)
mymid <- hyperlink('midmean.htm', 'Midmean', 'click to view the definition of the Midmean')
mylabel <- paste(mymid,hyperlink('method_2.htm','Weighted Average at X(n+1)p',''),sep=' - ')
a<-table.element(a,mylabel,header=TRUE)
a<-table.element(a,midm[2])
a<-table.element(a,'')
a<-table.row.end(a)
a<-table.row.start(a)
mymid <- hyperlink('midmean.htm', 'Midmean', 'click to view the definition of the Midmean')
mylabel <- paste(mymid,hyperlink('method_3.htm','Empirical Distribution Function',''),sep=' - ')
a<-table.element(a,mylabel,header=TRUE)
a<-table.element(a,midm[3])
a<-table.element(a,'')
a<-table.row.end(a)
a<-table.row.start(a)
mymid <- hyperlink('midmean.htm', 'Midmean', 'click to view the definition of the Midmean')
mylabel <- paste(mymid,hyperlink('method_4.htm','Empirical Distribution Function - Averaging',''),sep=' - ')
a<-table.element(a,mylabel,header=TRUE)
a<-table.element(a,midm[4])
a<-table.element(a,'')
a<-table.row.end(a)
a<-table.row.start(a)
mymid <- hyperlink('midmean.htm', 'Midmean', 'click to view the definition of the Midmean')
mylabel <- paste(mymid,hyperlink('method_5.htm','Empirical Distribution Function - Interpolation',''),sep=' - ')
a<-table.element(a,mylabel,header=TRUE)
a<-table.element(a,midm[5])
a<-table.element(a,'')
a<-table.row.end(a)
a<-table.row.start(a)
mymid <- hyperlink('midmean.htm', 'Midmean', 'click to view the definition of the Midmean')
mylabel <- paste(mymid,hyperlink('method_6.htm','Closest Observation',''),sep=' - ')
a<-table.element(a,mylabel,header=TRUE)
a<-table.element(a,midm[6])
a<-table.element(a,'')
a<-table.row.end(a)
a<-table.row.start(a)
mymid <- hyperlink('midmean.htm', 'Midmean', 'click to view the definition of the Midmean')
mylabel <- paste(mymid,hyperlink('method_7.htm','True Basic - Statistics Graphics Toolkit',''),sep=' - ')
a<-table.element(a,mylabel,header=TRUE)
a<-table.element(a,midm[7])
a<-table.element(a,'')
a<-table.row.end(a)
a<-table.row.start(a)
mymid <- hyperlink('midmean.htm', 'Midmean', 'click to view the definition of the Midmean')
mylabel <- paste(mymid,hyperlink('method_8.htm','MS Excel (old versions)',''),sep=' - ')
a<-table.element(a,mylabel,header=TRUE)
a<-table.element(a,midm[8])
a<-table.element(a,'')
a<-table.row.end(a)
a<-table.row.start(a)
a<-table.element(a,'Number of observations',header=TRUE)
a<-table.element(a,length(x))
a<-table.element(a,'')
a<-table.row.end(a)
a<-table.end(a)
table.save(a,file='mytable.tab')