Free Statistics

of Irreproducible Research!

Author's title

Author*Unverified author*
R Software Modulerwasp_exponentialsmoothing.wasp
Title produced by softwareExponential Smoothing
Date of computationTue, 27 Dec 2011 07:36:44 -0500
Cite this page as followsStatistical Computations at FreeStatistics.org, Office for Research Development and Education, URL https://freestatistics.org/blog/index.php?v=date/2011/Dec/27/t1324989445cre6ti7k9zdmhx8.htm/, Retrieved Mon, 20 May 2024 09:14:54 +0000
Statistical Computations at FreeStatistics.org, Office for Research Development and Education, URL https://freestatistics.org/blog/index.php?pk=160845, Retrieved Mon, 20 May 2024 09:14:54 +0000
QR Codes:

Original text written by user:
IsPrivate?No (this computation is public)
User-defined keywordsKDGP2W102
Estimated Impact139
Family? (F = Feedback message, R = changed R code, M = changed R Module, P = changed Parameters, D = changed Data)
-       [Exponential Smoothing] [aantal faillissem...] [2011-12-27 12:36:44] [ce97780edec5de939908d2a0576fedc2] [Current]
Feedback Forum

Post a new message
Dataseries X:
797
840
988
819
831
904
814
798
828
789
930
744
832
826
907
776
835
715
729
733
736
712
711
667
799
661
692
649
729
622
671
635
648
745
624
477
710
515
461
590
415
554
585
513
591
561
684
668
795
776
1043
964
762
1030
939
779
918
839
874
840
794
820
1003
780
607
1001
743
810
716
775
883
633


Summary of computational transaction
Raw Inputview raw input (R code)
Raw Outputview raw output of R engine
Computing time1 seconds
R Server'Gwilym Jenkins' @ jenkins.wessa.net

\begin{tabular}{lllllllll}
\hline
Summary of computational transaction \tabularnewline
Raw Input & view raw input (R code)  \tabularnewline
Raw Output & view raw output of R engine  \tabularnewline
Computing time & 1 seconds \tabularnewline
R Server & 'Gwilym Jenkins' @ jenkins.wessa.net \tabularnewline
\hline
\end{tabular}
%Source: https://freestatistics.org/blog/index.php?pk=160845&T=0

[TABLE]
[ROW][C]Summary of computational transaction[/C][/ROW]
[ROW][C]Raw Input[/C][C]view raw input (R code) [/C][/ROW]
[ROW][C]Raw Output[/C][C]view raw output of R engine [/C][/ROW]
[ROW][C]Computing time[/C][C]1 seconds[/C][/ROW]
[ROW][C]R Server[/C][C]'Gwilym Jenkins' @ jenkins.wessa.net[/C][/ROW]
[/TABLE]
Source: https://freestatistics.org/blog/index.php?pk=160845&T=0

Globally Unique Identifier (entire table): ba.freestatistics.org/blog/index.php?pk=160845&T=0

As an alternative you can also use a QR Code:  

The GUIDs for individual cells are displayed in the table below:

Summary of computational transaction
Raw Inputview raw input (R code)
Raw Outputview raw output of R engine
Computing time1 seconds
R Server'Gwilym Jenkins' @ jenkins.wessa.net


Estimated Parameters of Exponential Smoothing
ParameterValue
alpha0.448618209057209
beta0
gamma0.86289889643411

\begin{tabular}{lllllllll}
\hline
Estimated Parameters of Exponential Smoothing \tabularnewline
Parameter & Value \tabularnewline
alpha & 0.448618209057209 \tabularnewline
beta & 0 \tabularnewline
gamma & 0.86289889643411 \tabularnewline
\hline
\end{tabular}
%Source: https://freestatistics.org/blog/index.php?pk=160845&T=1

[TABLE]
[ROW][C]Estimated Parameters of Exponential Smoothing[/C][/ROW]
[ROW][C]Parameter[/C][C]Value[/C][/ROW]
[ROW][C]alpha[/C][C]0.448618209057209[/C][/ROW]
[ROW][C]beta[/C][C]0[/C][/ROW]
[ROW][C]gamma[/C][C]0.86289889643411[/C][/ROW]
[/TABLE]
Source: https://freestatistics.org/blog/index.php?pk=160845&T=1

Globally Unique Identifier (entire table): ba.freestatistics.org/blog/index.php?pk=160845&T=1

As an alternative you can also use a QR Code:  

The GUIDs for individual cells are displayed in the table below:

Estimated Parameters of Exponential Smoothing
ParameterValue
alpha0.448618209057209
beta0
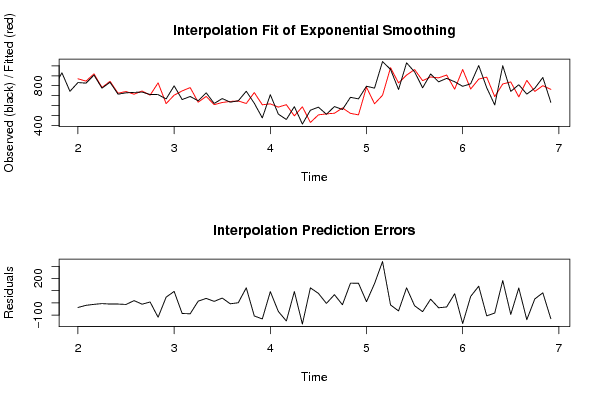
gamma0.86289889643411


Interpolation Forecasts of Exponential Smoothing
tObservedFittedResiduals
13832869.732516875563-37.7325168755627
14826846.278440480348-20.2784404803477
15907919.114701645612-12.1147016456122
16776782.027913271544-6.02791327154421
17835844.580863779155-9.5808637791547
18715724.771096959208-9.77109695920774
19729741.958904014387-12.9589040143868
20733714.51000493246818.4899950675318
21736746.829611181699-10.8296111816989
22712704.9934587631577.00654123684285
23711828.742555398247-117.742555398247
24667620.42752099107546.5724790089251
25799705.15265360163993.8473463983607
26661748.0320663702-87.0320663701999
27692781.389327892443-89.3893278924431
28649634.94157288929514.0584271107052
29729692.47164574409536.5283542559046
30622609.83054332298312.1694566770166
31671631.57643340729639.4235665927038
32635642.520136677478-7.52013667747815
33648647.0791615029350.920838497064665
34745621.660635598996123.339364401004
35624731.307202304441-107.307202304441
36477608.789705243846-131.789705243846
37710617.86455892001392.1354410799869
38515585.227033333295-70.2270333332947
39461609.70931201212-148.70931201212
40590497.06388255187892.9361174481215
41415588.659560479999-173.659560479999
42554431.044268593028122.955731406972
43585507.25365638893877.7463436110624
44513517.301813753796-4.30181375379641
45591523.8037827373567.1962172626496
46561576.544950741902-15.5449507419015
47684522.407477837853161.592522162147
48668507.26151446321160.73848553679
49795785.4558478372349.54415216276584
50776618.479801437525157.520198562475
511043704.360246131817338.639753868183
52964981.134239383329-17.134239383329
53762828.075338959402-66.075338959402
541030906.722282964829123.277717035171
55939962.480538144713-23.4805381447134
56779851.090983140557-72.0909831405569
57918887.86452271287730.1354772871227
58839879.164176504194-40.1641765041937
59874907.553787976557-33.553787976557
60840764.96653271758975.0334672824106
61794963.630061547161-169.630061547161
62820767.0401796233752.9598203766298
631003866.405968410597136.594031589403
64780886.492640992838-106.492640992838
65607690.382300551707-83.3823005517066
661001817.877864858186183.122135141814
67743837.914850875543-94.9148508755433
68810688.419711905111121.580288094889
69716853.906753275172-137.906753275172
70775742.63214227693232.3678577230683
71883800.74173677713582.2582632228651
72633763.408547189597-130.408547189597

\begin{tabular}{lllllllll}
\hline
Interpolation Forecasts of Exponential Smoothing \tabularnewline
t & Observed & Fitted & Residuals \tabularnewline
13 & 832 & 869.732516875563 & -37.7325168755627 \tabularnewline
14 & 826 & 846.278440480348 & -20.2784404803477 \tabularnewline
15 & 907 & 919.114701645612 & -12.1147016456122 \tabularnewline
16 & 776 & 782.027913271544 & -6.02791327154421 \tabularnewline
17 & 835 & 844.580863779155 & -9.5808637791547 \tabularnewline
18 & 715 & 724.771096959208 & -9.77109695920774 \tabularnewline
19 & 729 & 741.958904014387 & -12.9589040143868 \tabularnewline
20 & 733 & 714.510004932468 & 18.4899950675318 \tabularnewline
21 & 736 & 746.829611181699 & -10.8296111816989 \tabularnewline
22 & 712 & 704.993458763157 & 7.00654123684285 \tabularnewline
23 & 711 & 828.742555398247 & -117.742555398247 \tabularnewline
24 & 667 & 620.427520991075 & 46.5724790089251 \tabularnewline
25 & 799 & 705.152653601639 & 93.8473463983607 \tabularnewline
26 & 661 & 748.0320663702 & -87.0320663701999 \tabularnewline
27 & 692 & 781.389327892443 & -89.3893278924431 \tabularnewline
28 & 649 & 634.941572889295 & 14.0584271107052 \tabularnewline
29 & 729 & 692.471645744095 & 36.5283542559046 \tabularnewline
30 & 622 & 609.830543322983 & 12.1694566770166 \tabularnewline
31 & 671 & 631.576433407296 & 39.4235665927038 \tabularnewline
32 & 635 & 642.520136677478 & -7.52013667747815 \tabularnewline
33 & 648 & 647.079161502935 & 0.920838497064665 \tabularnewline
34 & 745 & 621.660635598996 & 123.339364401004 \tabularnewline
35 & 624 & 731.307202304441 & -107.307202304441 \tabularnewline
36 & 477 & 608.789705243846 & -131.789705243846 \tabularnewline
37 & 710 & 617.864558920013 & 92.1354410799869 \tabularnewline
38 & 515 & 585.227033333295 & -70.2270333332947 \tabularnewline
39 & 461 & 609.70931201212 & -148.70931201212 \tabularnewline
40 & 590 & 497.063882551878 & 92.9361174481215 \tabularnewline
41 & 415 & 588.659560479999 & -173.659560479999 \tabularnewline
42 & 554 & 431.044268593028 & 122.955731406972 \tabularnewline
43 & 585 & 507.253656388938 & 77.7463436110624 \tabularnewline
44 & 513 & 517.301813753796 & -4.30181375379641 \tabularnewline
45 & 591 & 523.80378273735 & 67.1962172626496 \tabularnewline
46 & 561 & 576.544950741902 & -15.5449507419015 \tabularnewline
47 & 684 & 522.407477837853 & 161.592522162147 \tabularnewline
48 & 668 & 507.26151446321 & 160.73848553679 \tabularnewline
49 & 795 & 785.455847837234 & 9.54415216276584 \tabularnewline
50 & 776 & 618.479801437525 & 157.520198562475 \tabularnewline
51 & 1043 & 704.360246131817 & 338.639753868183 \tabularnewline
52 & 964 & 981.134239383329 & -17.134239383329 \tabularnewline
53 & 762 & 828.075338959402 & -66.075338959402 \tabularnewline
54 & 1030 & 906.722282964829 & 123.277717035171 \tabularnewline
55 & 939 & 962.480538144713 & -23.4805381447134 \tabularnewline
56 & 779 & 851.090983140557 & -72.0909831405569 \tabularnewline
57 & 918 & 887.864522712877 & 30.1354772871227 \tabularnewline
58 & 839 & 879.164176504194 & -40.1641765041937 \tabularnewline
59 & 874 & 907.553787976557 & -33.553787976557 \tabularnewline
60 & 840 & 764.966532717589 & 75.0334672824106 \tabularnewline
61 & 794 & 963.630061547161 & -169.630061547161 \tabularnewline
62 & 820 & 767.04017962337 & 52.9598203766298 \tabularnewline
63 & 1003 & 866.405968410597 & 136.594031589403 \tabularnewline
64 & 780 & 886.492640992838 & -106.492640992838 \tabularnewline
65 & 607 & 690.382300551707 & -83.3823005517066 \tabularnewline
66 & 1001 & 817.877864858186 & 183.122135141814 \tabularnewline
67 & 743 & 837.914850875543 & -94.9148508755433 \tabularnewline
68 & 810 & 688.419711905111 & 121.580288094889 \tabularnewline
69 & 716 & 853.906753275172 & -137.906753275172 \tabularnewline
70 & 775 & 742.632142276932 & 32.3678577230683 \tabularnewline
71 & 883 & 800.741736777135 & 82.2582632228651 \tabularnewline
72 & 633 & 763.408547189597 & -130.408547189597 \tabularnewline
\hline
\end{tabular}
%Source: https://freestatistics.org/blog/index.php?pk=160845&T=2

[TABLE]
[ROW][C]Interpolation Forecasts of Exponential Smoothing[/C][/ROW]
[ROW][C]t[/C][C]Observed[/C][C]Fitted[/C][C]Residuals[/C][/ROW]
[ROW][C]13[/C][C]832[/C][C]869.732516875563[/C][C]-37.7325168755627[/C][/ROW]
[ROW][C]14[/C][C]826[/C][C]846.278440480348[/C][C]-20.2784404803477[/C][/ROW]
[ROW][C]15[/C][C]907[/C][C]919.114701645612[/C][C]-12.1147016456122[/C][/ROW]
[ROW][C]16[/C][C]776[/C][C]782.027913271544[/C][C]-6.02791327154421[/C][/ROW]
[ROW][C]17[/C][C]835[/C][C]844.580863779155[/C][C]-9.5808637791547[/C][/ROW]
[ROW][C]18[/C][C]715[/C][C]724.771096959208[/C][C]-9.77109695920774[/C][/ROW]
[ROW][C]19[/C][C]729[/C][C]741.958904014387[/C][C]-12.9589040143868[/C][/ROW]
[ROW][C]20[/C][C]733[/C][C]714.510004932468[/C][C]18.4899950675318[/C][/ROW]
[ROW][C]21[/C][C]736[/C][C]746.829611181699[/C][C]-10.8296111816989[/C][/ROW]
[ROW][C]22[/C][C]712[/C][C]704.993458763157[/C][C]7.00654123684285[/C][/ROW]
[ROW][C]23[/C][C]711[/C][C]828.742555398247[/C][C]-117.742555398247[/C][/ROW]
[ROW][C]24[/C][C]667[/C][C]620.427520991075[/C][C]46.5724790089251[/C][/ROW]
[ROW][C]25[/C][C]799[/C][C]705.152653601639[/C][C]93.8473463983607[/C][/ROW]
[ROW][C]26[/C][C]661[/C][C]748.0320663702[/C][C]-87.0320663701999[/C][/ROW]
[ROW][C]27[/C][C]692[/C][C]781.389327892443[/C][C]-89.3893278924431[/C][/ROW]
[ROW][C]28[/C][C]649[/C][C]634.941572889295[/C][C]14.0584271107052[/C][/ROW]
[ROW][C]29[/C][C]729[/C][C]692.471645744095[/C][C]36.5283542559046[/C][/ROW]
[ROW][C]30[/C][C]622[/C][C]609.830543322983[/C][C]12.1694566770166[/C][/ROW]
[ROW][C]31[/C][C]671[/C][C]631.576433407296[/C][C]39.4235665927038[/C][/ROW]
[ROW][C]32[/C][C]635[/C][C]642.520136677478[/C][C]-7.52013667747815[/C][/ROW]
[ROW][C]33[/C][C]648[/C][C]647.079161502935[/C][C]0.920838497064665[/C][/ROW]
[ROW][C]34[/C][C]745[/C][C]621.660635598996[/C][C]123.339364401004[/C][/ROW]
[ROW][C]35[/C][C]624[/C][C]731.307202304441[/C][C]-107.307202304441[/C][/ROW]
[ROW][C]36[/C][C]477[/C][C]608.789705243846[/C][C]-131.789705243846[/C][/ROW]
[ROW][C]37[/C][C]710[/C][C]617.864558920013[/C][C]92.1354410799869[/C][/ROW]
[ROW][C]38[/C][C]515[/C][C]585.227033333295[/C][C]-70.2270333332947[/C][/ROW]
[ROW][C]39[/C][C]461[/C][C]609.70931201212[/C][C]-148.70931201212[/C][/ROW]
[ROW][C]40[/C][C]590[/C][C]497.063882551878[/C][C]92.9361174481215[/C][/ROW]
[ROW][C]41[/C][C]415[/C][C]588.659560479999[/C][C]-173.659560479999[/C][/ROW]
[ROW][C]42[/C][C]554[/C][C]431.044268593028[/C][C]122.955731406972[/C][/ROW]
[ROW][C]43[/C][C]585[/C][C]507.253656388938[/C][C]77.7463436110624[/C][/ROW]
[ROW][C]44[/C][C]513[/C][C]517.301813753796[/C][C]-4.30181375379641[/C][/ROW]
[ROW][C]45[/C][C]591[/C][C]523.80378273735[/C][C]67.1962172626496[/C][/ROW]
[ROW][C]46[/C][C]561[/C][C]576.544950741902[/C][C]-15.5449507419015[/C][/ROW]
[ROW][C]47[/C][C]684[/C][C]522.407477837853[/C][C]161.592522162147[/C][/ROW]
[ROW][C]48[/C][C]668[/C][C]507.26151446321[/C][C]160.73848553679[/C][/ROW]
[ROW][C]49[/C][C]795[/C][C]785.455847837234[/C][C]9.54415216276584[/C][/ROW]
[ROW][C]50[/C][C]776[/C][C]618.479801437525[/C][C]157.520198562475[/C][/ROW]
[ROW][C]51[/C][C]1043[/C][C]704.360246131817[/C][C]338.639753868183[/C][/ROW]
[ROW][C]52[/C][C]964[/C][C]981.134239383329[/C][C]-17.134239383329[/C][/ROW]
[ROW][C]53[/C][C]762[/C][C]828.075338959402[/C][C]-66.075338959402[/C][/ROW]
[ROW][C]54[/C][C]1030[/C][C]906.722282964829[/C][C]123.277717035171[/C][/ROW]
[ROW][C]55[/C][C]939[/C][C]962.480538144713[/C][C]-23.4805381447134[/C][/ROW]
[ROW][C]56[/C][C]779[/C][C]851.090983140557[/C][C]-72.0909831405569[/C][/ROW]
[ROW][C]57[/C][C]918[/C][C]887.864522712877[/C][C]30.1354772871227[/C][/ROW]
[ROW][C]58[/C][C]839[/C][C]879.164176504194[/C][C]-40.1641765041937[/C][/ROW]
[ROW][C]59[/C][C]874[/C][C]907.553787976557[/C][C]-33.553787976557[/C][/ROW]
[ROW][C]60[/C][C]840[/C][C]764.966532717589[/C][C]75.0334672824106[/C][/ROW]
[ROW][C]61[/C][C]794[/C][C]963.630061547161[/C][C]-169.630061547161[/C][/ROW]
[ROW][C]62[/C][C]820[/C][C]767.04017962337[/C][C]52.9598203766298[/C][/ROW]
[ROW][C]63[/C][C]1003[/C][C]866.405968410597[/C][C]136.594031589403[/C][/ROW]
[ROW][C]64[/C][C]780[/C][C]886.492640992838[/C][C]-106.492640992838[/C][/ROW]
[ROW][C]65[/C][C]607[/C][C]690.382300551707[/C][C]-83.3823005517066[/C][/ROW]
[ROW][C]66[/C][C]1001[/C][C]817.877864858186[/C][C]183.122135141814[/C][/ROW]
[ROW][C]67[/C][C]743[/C][C]837.914850875543[/C][C]-94.9148508755433[/C][/ROW]
[ROW][C]68[/C][C]810[/C][C]688.419711905111[/C][C]121.580288094889[/C][/ROW]
[ROW][C]69[/C][C]716[/C][C]853.906753275172[/C][C]-137.906753275172[/C][/ROW]
[ROW][C]70[/C][C]775[/C][C]742.632142276932[/C][C]32.3678577230683[/C][/ROW]
[ROW][C]71[/C][C]883[/C][C]800.741736777135[/C][C]82.2582632228651[/C][/ROW]
[ROW][C]72[/C][C]633[/C][C]763.408547189597[/C][C]-130.408547189597[/C][/ROW]
[/TABLE]
Source: https://freestatistics.org/blog/index.php?pk=160845&T=2

Globally Unique Identifier (entire table): ba.freestatistics.org/blog/index.php?pk=160845&T=2

As an alternative you can also use a QR Code:  

The GUIDs for individual cells are displayed in the table below:

Interpolation Forecasts of Exponential Smoothing
tObservedFittedResiduals
13832869.732516875563-37.7325168755627
14826846.278440480348-20.2784404803477
15907919.114701645612-12.1147016456122
16776782.027913271544-6.02791327154421
17835844.580863779155-9.5808637791547
18715724.771096959208-9.77109695920774
19729741.958904014387-12.9589040143868
20733714.51000493246818.4899950675318
21736746.829611181699-10.8296111816989
22712704.9934587631577.00654123684285
23711828.742555398247-117.742555398247
24667620.42752099107546.5724790089251
25799705.15265360163993.8473463983607
26661748.0320663702-87.0320663701999
27692781.389327892443-89.3893278924431
28649634.94157288929514.0584271107052
29729692.47164574409536.5283542559046
30622609.83054332298312.1694566770166
31671631.57643340729639.4235665927038
32635642.520136677478-7.52013667747815
33648647.0791615029350.920838497064665
34745621.660635598996123.339364401004
35624731.307202304441-107.307202304441
36477608.789705243846-131.789705243846
37710617.86455892001392.1354410799869
38515585.227033333295-70.2270333332947
39461609.70931201212-148.70931201212
40590497.06388255187892.9361174481215
41415588.659560479999-173.659560479999
42554431.044268593028122.955731406972
43585507.25365638893877.7463436110624
44513517.301813753796-4.30181375379641
45591523.8037827373567.1962172626496
46561576.544950741902-15.5449507419015
47684522.407477837853161.592522162147
48668507.26151446321160.73848553679
49795785.4558478372349.54415216276584
50776618.479801437525157.520198562475
511043704.360246131817338.639753868183
52964981.134239383329-17.134239383329
53762828.075338959402-66.075338959402
541030906.722282964829123.277717035171
55939962.480538144713-23.4805381447134
56779851.090983140557-72.0909831405569
57918887.86452271287730.1354772871227
58839879.164176504194-40.1641765041937
59874907.553787976557-33.553787976557
60840764.96653271758975.0334672824106
61794963.630061547161-169.630061547161
62820767.0401796233752.9598203766298
631003866.405968410597136.594031589403
64780886.492640992838-106.492640992838
65607690.382300551707-83.3823005517066
661001817.877864858186183.122135141814
67743837.914850875543-94.9148508755433
68810688.419711905111121.580288094889
69716853.906753275172-137.906753275172
70775742.63214227693232.3678577230683
71883800.74173677713582.2582632228651
72633763.408547189597-130.408547189597


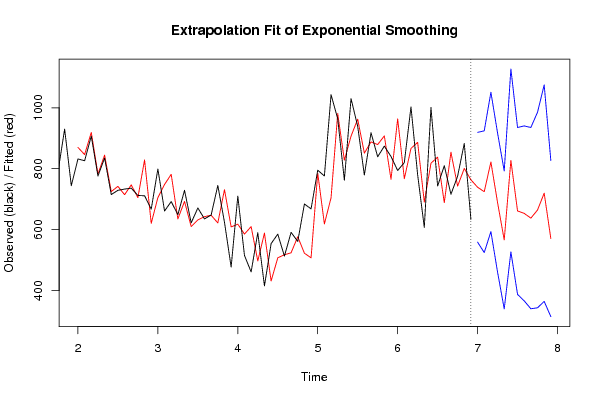
Extrapolation Forecasts of Exponential Smoothing
tForecast95% Lower Bound95% Upper Bound
73739.026347524761558.850867867622919.201827181901
74724.389694559014524.513243445673924.266145672354
75822.129527828152593.3617581810741050.89729747523
76688.681006257738460.314078497518917.047934017959
77565.968367083755339.494993178493792.441740989017
78827.181229211335526.9416168166121127.42084160606
79661.179489039499387.235665250563935.123312828435
80653.203244620892365.995047184279940.411442057504
81637.605782259264340.035836845981935.175727672547
82664.246173257271343.195002999046985.297343515497
83719.592827461445364.2891068607021074.89654806219
84570.311988212091314.142581006183826.481395418

\begin{tabular}{lllllllll}
\hline
Extrapolation Forecasts of Exponential Smoothing \tabularnewline
t & Forecast & 95% Lower Bound & 95% Upper Bound \tabularnewline
73 & 739.026347524761 & 558.850867867622 & 919.201827181901 \tabularnewline
74 & 724.389694559014 & 524.513243445673 & 924.266145672354 \tabularnewline
75 & 822.129527828152 & 593.361758181074 & 1050.89729747523 \tabularnewline
76 & 688.681006257738 & 460.314078497518 & 917.047934017959 \tabularnewline
77 & 565.968367083755 & 339.494993178493 & 792.441740989017 \tabularnewline
78 & 827.181229211335 & 526.941616816612 & 1127.42084160606 \tabularnewline
79 & 661.179489039499 & 387.235665250563 & 935.123312828435 \tabularnewline
80 & 653.203244620892 & 365.995047184279 & 940.411442057504 \tabularnewline
81 & 637.605782259264 & 340.035836845981 & 935.175727672547 \tabularnewline
82 & 664.246173257271 & 343.195002999046 & 985.297343515497 \tabularnewline
83 & 719.592827461445 & 364.289106860702 & 1074.89654806219 \tabularnewline
84 & 570.311988212091 & 314.142581006183 & 826.481395418 \tabularnewline
\hline
\end{tabular}
%Source: https://freestatistics.org/blog/index.php?pk=160845&T=3

[TABLE]
[ROW][C]Extrapolation Forecasts of Exponential Smoothing[/C][/ROW]
[ROW][C]t[/C][C]Forecast[/C][C]95% Lower Bound[/C][C]95% Upper Bound[/C][/ROW]
[ROW][C]73[/C][C]739.026347524761[/C][C]558.850867867622[/C][C]919.201827181901[/C][/ROW]
[ROW][C]74[/C][C]724.389694559014[/C][C]524.513243445673[/C][C]924.266145672354[/C][/ROW]
[ROW][C]75[/C][C]822.129527828152[/C][C]593.361758181074[/C][C]1050.89729747523[/C][/ROW]
[ROW][C]76[/C][C]688.681006257738[/C][C]460.314078497518[/C][C]917.047934017959[/C][/ROW]
[ROW][C]77[/C][C]565.968367083755[/C][C]339.494993178493[/C][C]792.441740989017[/C][/ROW]
[ROW][C]78[/C][C]827.181229211335[/C][C]526.941616816612[/C][C]1127.42084160606[/C][/ROW]
[ROW][C]79[/C][C]661.179489039499[/C][C]387.235665250563[/C][C]935.123312828435[/C][/ROW]
[ROW][C]80[/C][C]653.203244620892[/C][C]365.995047184279[/C][C]940.411442057504[/C][/ROW]
[ROW][C]81[/C][C]637.605782259264[/C][C]340.035836845981[/C][C]935.175727672547[/C][/ROW]
[ROW][C]82[/C][C]664.246173257271[/C][C]343.195002999046[/C][C]985.297343515497[/C][/ROW]
[ROW][C]83[/C][C]719.592827461445[/C][C]364.289106860702[/C][C]1074.89654806219[/C][/ROW]
[ROW][C]84[/C][C]570.311988212091[/C][C]314.142581006183[/C][C]826.481395418[/C][/ROW]
[/TABLE]
Source: https://freestatistics.org/blog/index.php?pk=160845&T=3

Globally Unique Identifier (entire table): ba.freestatistics.org/blog/index.php?pk=160845&T=3

As an alternative you can also use a QR Code:  

The GUIDs for individual cells are displayed in the table below:

Extrapolation Forecasts of Exponential Smoothing
tForecast95% Lower Bound95% Upper Bound
73739.026347524761558.850867867622919.201827181901
74724.389694559014524.513243445673924.266145672354
75822.129527828152593.3617581810741050.89729747523
76688.681006257738460.314078497518917.047934017959
77565.968367083755339.494993178493792.441740989017
78827.181229211335526.9416168166121127.42084160606
79661.179489039499387.235665250563935.123312828435
80653.203244620892365.995047184279940.411442057504
81637.605782259264340.035836845981935.175727672547
82664.246173257271343.195002999046985.297343515497
83719.592827461445364.2891068607021074.89654806219
84570.311988212091314.142581006183826.481395418


Parameters (Session):
par1 = 12 ; par2 = Triple ; par3 = multiplicative ;
Parameters (R input):
par1 = 12 ; par2 = Triple ; par3 = multiplicative ;
R code (references can be found in the software module):
par1 <- as.numeric(par1)
if (par2 == 'Single') K <- 1
if (par2 == 'Double') K <- 2
if (par2 == 'Triple') K <- par1
nx <- length(x)
nxmK <- nx - K
x <- ts(x, frequency = par1)
if (par2 == 'Single') fit <- HoltWinters(x, gamma=F, beta=F)
if (par2 == 'Double') fit <- HoltWinters(x, gamma=F)
if (par2 == 'Triple') fit <- HoltWinters(x, seasonal=par3)
fit
myresid <- x - fit$fitted[,'xhat']
bitmap(file='test1.png')
op <- par(mfrow=c(2,1))
plot(fit,ylab='Observed (black) / Fitted (red)',main='Interpolation Fit of Exponential Smoothing')
plot(myresid,ylab='Residuals',main='Interpolation Prediction Errors')
par(op)
dev.off()
bitmap(file='test2.png')
p <- predict(fit, par1, prediction.interval=TRUE)
np <- length(p[,1])
plot(fit,p,ylab='Observed (black) / Fitted (red)',main='Extrapolation Fit of Exponential Smoothing')
dev.off()
bitmap(file='test3.png')
op <- par(mfrow = c(2,2))
acf(as.numeric(myresid),lag.max = nx/2,main='Residual ACF')
spectrum(myresid,main='Residals Periodogram')
cpgram(myresid,main='Residal Cumulative Periodogram')
qqnorm(myresid,main='Residual Normal QQ Plot')
qqline(myresid)
par(op)
dev.off()
load(file='createtable')
a<-table.start()
a<-table.row.start(a)
a<-table.element(a,'Estimated Parameters of Exponential Smoothing',2,TRUE)
a<-table.row.end(a)
a<-table.row.start(a)
a<-table.element(a,'Parameter',header=TRUE)
a<-table.element(a,'Value',header=TRUE)
a<-table.row.end(a)
a<-table.row.start(a)
a<-table.element(a,'alpha',header=TRUE)
a<-table.element(a,fit$alpha)
a<-table.row.end(a)
a<-table.row.start(a)
a<-table.element(a,'beta',header=TRUE)
a<-table.element(a,fit$beta)
a<-table.row.end(a)
a<-table.row.start(a)
a<-table.element(a,'gamma',header=TRUE)
a<-table.element(a,fit$gamma)
a<-table.row.end(a)
a<-table.end(a)
table.save(a,file='mytable.tab')
a<-table.start()
a<-table.row.start(a)
a<-table.element(a,'Interpolation Forecasts of Exponential Smoothing',4,TRUE)
a<-table.row.end(a)
a<-table.row.start(a)
a<-table.element(a,'t',header=TRUE)
a<-table.element(a,'Observed',header=TRUE)
a<-table.element(a,'Fitted',header=TRUE)
a<-table.element(a,'Residuals',header=TRUE)
a<-table.row.end(a)
for (i in 1:nxmK) {
a<-table.row.start(a)
a<-table.element(a,i+K,header=TRUE)
a<-table.element(a,x[i+K])
a<-table.element(a,fit$fitted[i,'xhat'])
a<-table.element(a,myresid[i])
a<-table.row.end(a)
}
a<-table.end(a)
table.save(a,file='mytable1.tab')
a<-table.start()
a<-table.row.start(a)
a<-table.element(a,'Extrapolation Forecasts of Exponential Smoothing',4,TRUE)
a<-table.row.end(a)
a<-table.row.start(a)
a<-table.element(a,'t',header=TRUE)
a<-table.element(a,'Forecast',header=TRUE)
a<-table.element(a,'95% Lower Bound',header=TRUE)
a<-table.element(a,'95% Upper Bound',header=TRUE)
a<-table.row.end(a)
for (i in 1:np) {
a<-table.row.start(a)
a<-table.element(a,nx+i,header=TRUE)
a<-table.element(a,p[i,'fit'])
a<-table.element(a,p[i,'lwr'])
a<-table.element(a,p[i,'upr'])
a<-table.row.end(a)
}
a<-table.end(a)
table.save(a,file='mytable2.tab')