Free Statistics
of Irreproducible Research!
Description of Statistical Computation | |||||||||||||||||||||||||||||||||||||||||
|---|---|---|---|---|---|---|---|---|---|---|---|---|---|---|---|---|---|---|---|---|---|---|---|---|---|---|---|---|---|---|---|---|---|---|---|---|---|---|---|---|---|
| Author's title | |||||||||||||||||||||||||||||||||||||||||
| Author | *The author of this computation has been verified* | ||||||||||||||||||||||||||||||||||||||||
| R Software Module | rwasp_univariatedataseries.wasp | ||||||||||||||||||||||||||||||||||||||||
| Title produced by software | Univariate Data Series | ||||||||||||||||||||||||||||||||||||||||
| Date of computation | Wed, 21 Dec 2011 18:40:13 -0500 | ||||||||||||||||||||||||||||||||||||||||
| Cite this page as follows | Statistical Computations at FreeStatistics.org, Office for Research Development and Education, URL https://freestatistics.org/blog/index.php?v=date/2011/Dec/21/t132451082651y24t8nru7jyj2.htm/, Retrieved Tue, 16 Sep 2025 03:33:24 +0000 | ||||||||||||||||||||||||||||||||||||||||
| Statistical Computations at FreeStatistics.org, Office for Research Development and Education, URL https://freestatistics.org/blog/index.php?pk=159136, Retrieved Tue, 16 Sep 2025 03:33:24 +0000 | |||||||||||||||||||||||||||||||||||||||||
| QR Codes: | |||||||||||||||||||||||||||||||||||||||||
|
| |||||||||||||||||||||||||||||||||||||||||
| Original text written by user: | |||||||||||||||||||||||||||||||||||||||||
| IsPrivate? | No (this computation is public) | ||||||||||||||||||||||||||||||||||||||||
| User-defined keywords | |||||||||||||||||||||||||||||||||||||||||
| Estimated Impact | 255 | ||||||||||||||||||||||||||||||||||||||||
Tree of Dependent Computations | |||||||||||||||||||||||||||||||||||||||||
| Family? (F = Feedback message, R = changed R code, M = changed R Module, P = changed Parameters, D = changed Data) | |||||||||||||||||||||||||||||||||||||||||
| F [Univariate Data Series] [HPC Retail Sales] [2008-03-02 15:42:48] [74be16979710d4c4e7c6647856088456] - RMPD [Univariate Data Series] [] [2011-11-25 14:57:13] [493236dcc414c5f9e1823f06b33a5ad6] - D [Univariate Data Series] [] [2011-12-21 21:39:24] [493236dcc414c5f9e1823f06b33a5ad6] - PD [Univariate Data Series] [] [2011-12-21 23:36:19] [493236dcc414c5f9e1823f06b33a5ad6] - D [Univariate Data Series] [] [2011-12-21 23:40:13] [75a32e1bc492240bc1028714aca23077] [Current] - D [Univariate Data Series] [] [2011-12-21 23:41:33] [493236dcc414c5f9e1823f06b33a5ad6] - RM D [Linear Regression Graphical Model Validation] [] [2011-12-21 23:57:45] [493236dcc414c5f9e1823f06b33a5ad6] | |||||||||||||||||||||||||||||||||||||||||
| Feedback Forum | |||||||||||||||||||||||||||||||||||||||||
Post a new message | |||||||||||||||||||||||||||||||||||||||||
Dataset | |||||||||||||||||||||||||||||||||||||||||
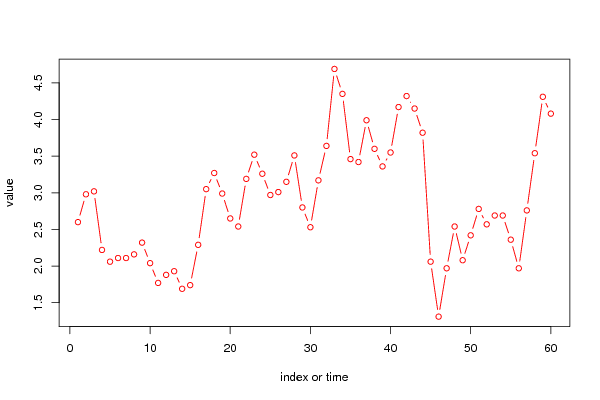
| Dataseries X: | |||||||||||||||||||||||||||||||||||||||||
2,60 2,98 3,02 2,22 2,06 2,11 2,11 2,16 2,32 2,04 1,77 1,88 1,93 1,69 1,74 2,29 3,05 3,27 2,99 2,65 2,54 3,19 3,52 3,26 2,97 3,01 3,15 3,51 2,80 2,53 3,17 3,64 4,69 4,35 3,46 3,42 3,99 3,60 3,36 3,55 4,17 4,32 4,15 3,82 2,06 1,31 1,97 2,54 2,08 2,42 2,78 2,57 2,69 2,69 2,36 1,97 2,76 3,54 4,31 4,08 | |||||||||||||||||||||||||||||||||||||||||
Tables (Output of Computation) | |||||||||||||||||||||||||||||||||||||||||
| |||||||||||||||||||||||||||||||||||||||||
Figures (Output of Computation) | |||||||||||||||||||||||||||||||||||||||||
Input Parameters & R Code | |||||||||||||||||||||||||||||||||||||||||
| Parameters (Session): | |||||||||||||||||||||||||||||||||||||||||
| par1 = additive ; par2 = 12 ; | |||||||||||||||||||||||||||||||||||||||||
| Parameters (R input): | |||||||||||||||||||||||||||||||||||||||||
| par1 = Inflatie VS in 2003-2007 ; par2 = www.ecb.int ; par3 = ; par4 = 12 ; | |||||||||||||||||||||||||||||||||||||||||
| R code (references can be found in the software module): | |||||||||||||||||||||||||||||||||||||||||
bitmap(file='test1.png') | |||||||||||||||||||||||||||||||||||||||||