Free Statistics

of Irreproducible Research!

Author's title

Author*The author of this computation has been verified*
R Software Modulerwasp_pairs.wasp
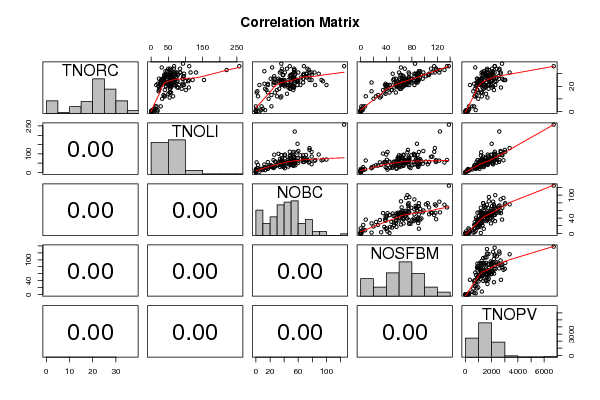
Title produced by softwareKendall tau Correlation Matrix
Date of computationTue, 20 Dec 2011 03:56:34 -0500
Cite this page as followsStatistical Computations at FreeStatistics.org, Office for Research Development and Education, URL https://freestatistics.org/blog/index.php?v=date/2011/Dec/20/t13243714192jdvfx9mcwdydpp.htm/, Retrieved Sun, 28 Apr 2024 14:47:44 +0000
Statistical Computations at FreeStatistics.org, Office for Research Development and Education, URL https://freestatistics.org/blog/index.php?pk=157804, Retrieved Sun, 28 Apr 2024 14:47:44 +0000
QR Codes:

Original text written by user:
IsPrivate?No (this computation is public)
User-defined keywords
Estimated Impact128
Family? (F = Feedback message, R = changed R code, M = changed R Module, P = changed Parameters, D = changed Data)
-     [Kendall tau Correlation Matrix] [] [2011-11-24 12:37:04] [be8fee7ddc6548b264a38e197c691443]
-    D    [Kendall tau Correlation Matrix] [] [2011-12-20 08:56:34] [05300ca098a536dd63793e3fbb62faf1] [Current]
- RMP       [Multiple Regression] [] [2011-12-20 09:25:32] [be8fee7ddc6548b264a38e197c691443]
- RMP       [Recursive Partitioning (Regression Trees)] [] [2011-12-20 09:41:38] [be8fee7ddc6548b264a38e197c691443]
Feedback Forum

Post a new message
Dataseries X:
18	89	48	63	1760
20	56	52	56	1609
0	18	0	0	192
26	92	49	60	2182
31	131	76	116	3367
36	257	125	138	6727
23	55	46	71	1619
30	56	68	107	1507
30	42	52	50	1682
26	92	67	79	2812
24	74	50	58	1943
30	66	71	91	2017
21	96	41	40	1702
25	110	79	91	3034
18	55	49	61	1379
19	79	54	65	1517
33	53	75	131	1637
15	54	1	45	1169
34	84	54	110	2384
18	24	13	41	726
15	55	17	37	993
30	96	89	84	2683
25	70	37	67	1713
34	50	44	69	2027
21	81	50	58	1818
21	28	39	60	1393
25	154	59	88	2000
31	85	79	75	1346
31	115	60	98	2676
20	43	52	67	2106
28	43	50	84	1591
20	43	54	58	1519
17	101	53	35	2171
25	121	76	74	3003
24	52	60	89	2364
0	1	0	0	1
27	60	53	75	2017
14	50	44	39	1564
32	47	36	93	2072
31	63	83	123	2106
21	69	100	73	2270
34	56	37	118	1643
23	29	25	76	957
24	77	59	65	2025
26	46	55	97	1236
22	91	41	67	1178
35	31	23	63	744
21	92	63	84	1976
31	85	54	112	2224
26	56	67	75	2561
22	28	12	39	658
21	65	84	63	1779
27	71	64	93	2355
30	77	56	76	2017
33	59	54	117	1758
11	54	35	30	1675
26	62	52	65	1760
26	23	25	78	875
23	65	67	87	1169
38	93	36	85	2789
29	56	50	107	1606
19	76	48	60	2020
19	58	46	53	1300
26	35	53	67	1235
26	32	27	90	1215
29	38	38	89	1230
36	67	68	135	2226
25	65	93	71	2897
24	38	56	75	1071
21	15	5	42	340
19	110	53	42	2704
12	64	36	8	1247
30	64	72	86	1422
21	68	46	41	1535
34	66	73	118	2593
32	42	12	91	1397
28	58	76	102	2162
28	94	71	89	2513
21	26	17	46	917
31	71	34	60	1234
26	66	54	69	917
29	59	39	95	1924
23	27	26	17	853
25	34	40	61	1398
22	44	35	55	986
26	47	32	55	1608
33	220	55	124	2577
24	108	58	73	1201
24	56	39	73	1189
21	50	39	67	1431
28	40	48	66	1698
27	74	72	75	2185
25	56	39	83	1228
15	58	27	55	1266
13	36	22	27	830
36	111	48	115	2238
24	68	95	76	1787
1	12	13	0	223
24	100	32	83	2254
31	75	41	90	1952
4	28	22	4	665
20	22	41	56	804
23	49	55	63	1211
23	57	28	52	1143
12	38	30	24	710
16	22	2	17	596
29	44	79	105	1353
10	32	18	20	971
0	0	0	0	0
25	31	46	51	1030
21	66	25	76	1130
23	44	50	59	1284
21	61	59	70	1438
21	57	36	38	849
0	5	0	0	78
0	0	0	0	0
23	39	35	81	925
29	78	68	64	1518
28	95	26	67	1946
23	37	36	89	914
1	19	7	3	778
29	71	67	87	1713
17	40	30	48	895
29	52	55	62	1756
12	40	3	32	701
2	12	10	4	285
21	55	46	70	1774
25	29	34	90	1071
29	46	49	91	1582
2	9	1	1	256
0	9	0	0	98
18	55	33	39	1358
1	3	0	0	41
21	58	48	45	1771
0	3	5	0	42
4	16	8	7	528
0	0	0	0	0
25	45	35	75	1026
26	38	21	52	1296
0	4	0	0	81
4	13	0	1	257
17	23	15	49	914
21	50	50	69	1178
22	19	17	56	1080


Summary of computational transaction
Raw Inputview raw input (R code)
Raw Outputview raw output of R engine
Computing time1 seconds
R Server'Herman Ole Andreas Wold' @ wold.wessa.net

\begin{tabular}{lllllllll}
\hline
Summary of computational transaction \tabularnewline
Raw Input & view raw input (R code)  \tabularnewline
Raw Output & view raw output of R engine  \tabularnewline
Computing time & 1 seconds \tabularnewline
R Server & 'Herman Ole Andreas Wold' @ wold.wessa.net \tabularnewline
\hline
\end{tabular}
%Source: https://freestatistics.org/blog/index.php?pk=157804&T=0

[TABLE]
[ROW][C]Summary of computational transaction[/C][/ROW]
[ROW][C]Raw Input[/C][C]view raw input (R code) [/C][/ROW]
[ROW][C]Raw Output[/C][C]view raw output of R engine [/C][/ROW]
[ROW][C]Computing time[/C][C]1 seconds[/C][/ROW]
[ROW][C]R Server[/C][C]'Herman Ole Andreas Wold' @ wold.wessa.net[/C][/ROW]
[/TABLE]
Source: https://freestatistics.org/blog/index.php?pk=157804&T=0

Globally Unique Identifier (entire table): ba.freestatistics.org/blog/index.php?pk=157804&T=0

As an alternative you can also use a QR Code:  

The GUIDs for individual cells are displayed in the table below:

Summary of computational transaction
Raw Inputview raw input (R code)
Raw Outputview raw output of R engine
Computing time1 seconds
R Server'Herman Ole Andreas Wold' @ wold.wessa.net


Correlations for all pairs of data series (method=pearson)
TNORCTNOLINOBCNOSFBMTNOPV
TNORC10.5580.6710.8920.669
TNOLI0.55810.6650.5940.838
NOBC0.6710.66510.7220.788
NOSFBM0.8920.5940.72210.693
TNOPV0.6690.8380.7880.6931

\begin{tabular}{lllllllll}
\hline
Correlations for all pairs of data series (method=pearson) \tabularnewline
  & TNORC & TNOLI & NOBC & NOSFBM & TNOPV \tabularnewline
TNORC & 1 & 0.558 & 0.671 & 0.892 & 0.669 \tabularnewline
TNOLI & 0.558 & 1 & 0.665 & 0.594 & 0.838 \tabularnewline
NOBC & 0.671 & 0.665 & 1 & 0.722 & 0.788 \tabularnewline
NOSFBM & 0.892 & 0.594 & 0.722 & 1 & 0.693 \tabularnewline
TNOPV & 0.669 & 0.838 & 0.788 & 0.693 & 1 \tabularnewline
\hline
\end{tabular}
%Source: https://freestatistics.org/blog/index.php?pk=157804&T=1

[TABLE]
[ROW][C]Correlations for all pairs of data series (method=pearson)[/C][/ROW]
[ROW][C] [/C][C]TNORC[/C][C]TNOLI[/C][C]NOBC[/C][C]NOSFBM[/C][C]TNOPV[/C][/ROW]
[ROW][C]TNORC[/C][C]1[/C][C]0.558[/C][C]0.671[/C][C]0.892[/C][C]0.669[/C][/ROW]
[ROW][C]TNOLI[/C][C]0.558[/C][C]1[/C][C]0.665[/C][C]0.594[/C][C]0.838[/C][/ROW]
[ROW][C]NOBC[/C][C]0.671[/C][C]0.665[/C][C]1[/C][C]0.722[/C][C]0.788[/C][/ROW]
[ROW][C]NOSFBM[/C][C]0.892[/C][C]0.594[/C][C]0.722[/C][C]1[/C][C]0.693[/C][/ROW]
[ROW][C]TNOPV[/C][C]0.669[/C][C]0.838[/C][C]0.788[/C][C]0.693[/C][C]1[/C][/ROW]
[/TABLE]
Source: https://freestatistics.org/blog/index.php?pk=157804&T=1

Globally Unique Identifier (entire table): ba.freestatistics.org/blog/index.php?pk=157804&T=1

As an alternative you can also use a QR Code:  

The GUIDs for individual cells are displayed in the table below:

Correlations for all pairs of data series (method=pearson)
TNORCTNOLINOBCNOSFBMTNOPV
TNORC10.5580.6710.8920.669
TNOLI0.55810.6650.5940.838
NOBC0.6710.66510.7220.788
NOSFBM0.8920.5940.72210.693
TNOPV0.6690.8380.7880.6931


Correlations for all pairs of data series with p-values
pairPearson rSpearman rhoKendall tau
TNORC;TNOLI0.55830.5060.3761
p-value(0)(0)(0)
TNORC;NOBC0.67050.59110.4389
p-value(0)(0)(0)
TNORC;NOSFBM0.89170.83860.6891
p-value(0)(0)(0)
TNORC;TNOPV0.66870.62550.4711
p-value(0)(0)(0)
TNOLI;NOBC0.66540.70570.5296
p-value(0)(0)(0)
TNOLI;NOSFBM0.5940.54960.4061
p-value(0)(0)(0)
TNOLI;TNOPV0.83820.81350.6432
p-value(0)(0)(0)
NOBC;NOSFBM0.72240.67840.5097
p-value(0)(0)(0)
NOBC;TNOPV0.78830.76720.5906
p-value(0)(0)(0)
NOSFBM;TNOPV0.69290.65260.4895
p-value(0)(0)(0)

\begin{tabular}{lllllllll}
\hline
Correlations for all pairs of data series with p-values \tabularnewline
pair & Pearson r & Spearman rho & Kendall tau \tabularnewline
TNORC;TNOLI & 0.5583 & 0.506 & 0.3761 \tabularnewline
p-value & (0) & (0) & (0) \tabularnewline
TNORC;NOBC & 0.6705 & 0.5911 & 0.4389 \tabularnewline
p-value & (0) & (0) & (0) \tabularnewline
TNORC;NOSFBM & 0.8917 & 0.8386 & 0.6891 \tabularnewline
p-value & (0) & (0) & (0) \tabularnewline
TNORC;TNOPV & 0.6687 & 0.6255 & 0.4711 \tabularnewline
p-value & (0) & (0) & (0) \tabularnewline
TNOLI;NOBC & 0.6654 & 0.7057 & 0.5296 \tabularnewline
p-value & (0) & (0) & (0) \tabularnewline
TNOLI;NOSFBM & 0.594 & 0.5496 & 0.4061 \tabularnewline
p-value & (0) & (0) & (0) \tabularnewline
TNOLI;TNOPV & 0.8382 & 0.8135 & 0.6432 \tabularnewline
p-value & (0) & (0) & (0) \tabularnewline
NOBC;NOSFBM & 0.7224 & 0.6784 & 0.5097 \tabularnewline
p-value & (0) & (0) & (0) \tabularnewline
NOBC;TNOPV & 0.7883 & 0.7672 & 0.5906 \tabularnewline
p-value & (0) & (0) & (0) \tabularnewline
NOSFBM;TNOPV & 0.6929 & 0.6526 & 0.4895 \tabularnewline
p-value & (0) & (0) & (0) \tabularnewline
\hline
\end{tabular}
%Source: https://freestatistics.org/blog/index.php?pk=157804&T=2

[TABLE]
[ROW][C]Correlations for all pairs of data series with p-values[/C][/ROW]
[ROW][C]pair[/C][C]Pearson r[/C][C]Spearman rho[/C][C]Kendall tau[/C][/ROW]
[ROW][C]TNORC;TNOLI[/C][C]0.5583[/C][C]0.506[/C][C]0.3761[/C][/ROW]
[ROW][C]p-value[/C][C](0)[/C][C](0)[/C][C](0)[/C][/ROW]
[ROW][C]TNORC;NOBC[/C][C]0.6705[/C][C]0.5911[/C][C]0.4389[/C][/ROW]
[ROW][C]p-value[/C][C](0)[/C][C](0)[/C][C](0)[/C][/ROW]
[ROW][C]TNORC;NOSFBM[/C][C]0.8917[/C][C]0.8386[/C][C]0.6891[/C][/ROW]
[ROW][C]p-value[/C][C](0)[/C][C](0)[/C][C](0)[/C][/ROW]
[ROW][C]TNORC;TNOPV[/C][C]0.6687[/C][C]0.6255[/C][C]0.4711[/C][/ROW]
[ROW][C]p-value[/C][C](0)[/C][C](0)[/C][C](0)[/C][/ROW]
[ROW][C]TNOLI;NOBC[/C][C]0.6654[/C][C]0.7057[/C][C]0.5296[/C][/ROW]
[ROW][C]p-value[/C][C](0)[/C][C](0)[/C][C](0)[/C][/ROW]
[ROW][C]TNOLI;NOSFBM[/C][C]0.594[/C][C]0.5496[/C][C]0.4061[/C][/ROW]
[ROW][C]p-value[/C][C](0)[/C][C](0)[/C][C](0)[/C][/ROW]
[ROW][C]TNOLI;TNOPV[/C][C]0.8382[/C][C]0.8135[/C][C]0.6432[/C][/ROW]
[ROW][C]p-value[/C][C](0)[/C][C](0)[/C][C](0)[/C][/ROW]
[ROW][C]NOBC;NOSFBM[/C][C]0.7224[/C][C]0.6784[/C][C]0.5097[/C][/ROW]
[ROW][C]p-value[/C][C](0)[/C][C](0)[/C][C](0)[/C][/ROW]
[ROW][C]NOBC;TNOPV[/C][C]0.7883[/C][C]0.7672[/C][C]0.5906[/C][/ROW]
[ROW][C]p-value[/C][C](0)[/C][C](0)[/C][C](0)[/C][/ROW]
[ROW][C]NOSFBM;TNOPV[/C][C]0.6929[/C][C]0.6526[/C][C]0.4895[/C][/ROW]
[ROW][C]p-value[/C][C](0)[/C][C](0)[/C][C](0)[/C][/ROW]
[/TABLE]
Source: https://freestatistics.org/blog/index.php?pk=157804&T=2

Globally Unique Identifier (entire table): ba.freestatistics.org/blog/index.php?pk=157804&T=2

As an alternative you can also use a QR Code:  

The GUIDs for individual cells are displayed in the table below:

Correlations for all pairs of data series with p-values
pairPearson rSpearman rhoKendall tau
TNORC;TNOLI0.55830.5060.3761
p-value(0)(0)(0)
TNORC;NOBC0.67050.59110.4389
p-value(0)(0)(0)
TNORC;NOSFBM0.89170.83860.6891
p-value(0)(0)(0)
TNORC;TNOPV0.66870.62550.4711
p-value(0)(0)(0)
TNOLI;NOBC0.66540.70570.5296
p-value(0)(0)(0)
TNOLI;NOSFBM0.5940.54960.4061
p-value(0)(0)(0)
TNOLI;TNOPV0.83820.81350.6432
p-value(0)(0)(0)
NOBC;NOSFBM0.72240.67840.5097
p-value(0)(0)(0)
NOBC;TNOPV0.78830.76720.5906
p-value(0)(0)(0)
NOSFBM;TNOPV0.69290.65260.4895
p-value(0)(0)(0)


Parameters (Session):
par1 = pearson ;
Parameters (R input):
par1 = pearson ;
R code (references can be found in the software module):
panel.tau <- function(x, y, digits=2, prefix='', cex.cor)
{
usr <- par('usr'); on.exit(par(usr))
par(usr = c(0, 1, 0, 1))
rr <- cor.test(x, y, method=par1)
r <- round(rr$p.value,2)
txt <- format(c(r, 0.123456789), digits=digits)[1]
txt <- paste(prefix, txt, sep='')
if(missing(cex.cor)) cex <- 0.5/strwidth(txt)
text(0.5, 0.5, txt, cex = cex)
}
panel.hist <- function(x, ...)
{
usr <- par('usr'); on.exit(par(usr))
par(usr = c(usr[1:2], 0, 1.5) )
h <- hist(x, plot = FALSE)
breaks <- h$breaks; nB <- length(breaks)
y <- h$counts; y <- y/max(y)
rect(breaks[-nB], 0, breaks[-1], y, col='grey', ...)
}
bitmap(file='test1.png')
pairs(t(y),diag.panel=panel.hist, upper.panel=panel.smooth, lower.panel=panel.tau, main=main)
dev.off()
load(file='createtable')
n <- length(y[,1])
n
a<-table.start()
a<-table.row.start(a)
a<-table.element(a,paste('Correlations for all pairs of data series (method=',par1,')',sep=''),n+1,TRUE)
a<-table.row.end(a)
a<-table.row.start(a)
a<-table.element(a,' ',header=TRUE)
for (i in 1:n) {
a<-table.element(a,dimnames(t(x))[[2]][i],header=TRUE)
}
a<-table.row.end(a)
for (i in 1:n) {
a<-table.row.start(a)
a<-table.element(a,dimnames(t(x))[[2]][i],header=TRUE)
for (j in 1:n) {
r <- cor.test(y[i,],y[j,],method=par1)
a<-table.element(a,round(r$estimate,3))
}
a<-table.row.end(a)
}
a<-table.end(a)
table.save(a,file='mytable.tab')
a<-table.start()
a<-table.row.start(a)
a<-table.element(a,'Correlations for all pairs of data series with p-values',4,TRUE)
a<-table.row.end(a)
a<-table.row.start(a)
a<-table.element(a,'pair',1,TRUE)
a<-table.element(a,'Pearson r',1,TRUE)
a<-table.element(a,'Spearman rho',1,TRUE)
a<-table.element(a,'Kendall tau',1,TRUE)
a<-table.row.end(a)
cor.test(y[1,],y[2,],method=par1)
for (i in 1:(n-1))
{
for (j in (i+1):n)
{
a<-table.row.start(a)
dum <- paste(dimnames(t(x))[[2]][i],';',dimnames(t(x))[[2]][j],sep='')
a<-table.element(a,dum,header=TRUE)
rp <- cor.test(y[i,],y[j,],method='pearson')
a<-table.element(a,round(rp$estimate,4))
rs <- cor.test(y[i,],y[j,],method='spearman')
a<-table.element(a,round(rs$estimate,4))
rk <- cor.test(y[i,],y[j,],method='kendall')
a<-table.element(a,round(rk$estimate,4))
a<-table.row.end(a)
a<-table.row.start(a)
a<-table.element(a,'p-value',header=T)
a<-table.element(a,paste('(',round(rp$p.value,4),')',sep=''))
a<-table.element(a,paste('(',round(rs$p.value,4),')',sep=''))
a<-table.element(a,paste('(',round(rk$p.value,4),')',sep=''))
a<-table.row.end(a)
}
}
a<-table.end(a)
table.save(a,file='mytable1.tab')