Free Statistics

of Irreproducible Research!

Author's title

Author*The author of this computation has been verified*
R Software Modulerwasp_smp.wasp
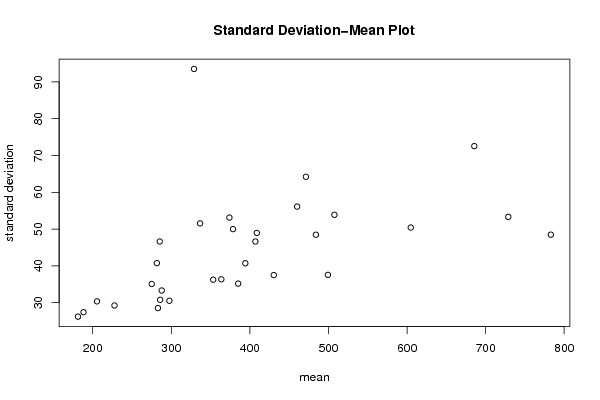
Title produced by softwareStandard Deviation-Mean Plot
Date of computationFri, 16 Dec 2011 10:59:09 -0500
Cite this page as followsStatistical Computations at FreeStatistics.org, Office for Research Development and Education, URL https://freestatistics.org/blog/index.php?v=date/2011/Dec/16/t1324051177zi2cpz3yyku8iln.htm/, Retrieved Thu, 25 Apr 2024 06:58:40 +0000
Statistical Computations at FreeStatistics.org, Office for Research Development and Education, URL https://freestatistics.org/blog/index.php?pk=156069, Retrieved Thu, 25 Apr 2024 06:58:40 +0000
QR Codes:

Original text written by user:
IsPrivate?No (this computation is public)
User-defined keywords
Estimated Impact97
Family? (F = Feedback message, R = changed R code, M = changed R Module, P = changed Parameters, D = changed Data)
F     [Univariate Data Series] [HPC Retail Sales] [2008-03-02 15:42:48] [74be16979710d4c4e7c6647856088456]
- RMPD  [Central Tendency] [Workshop 8 STAP 1...] [2011-11-26 13:04:08] [de8512d9b386046939a89973b76869e3]
- RMPD    [Decomposition by Loess] [Workshop 8 STAP 3...] [2011-11-26 14:09:35] [de8512d9b386046939a89973b76869e3]
- RMP       [Structural Time Series Models] [Workshop 8 STAP 3...] [2011-11-26 14:16:57] [de8512d9b386046939a89973b76869e3]
- RMPD        [Multiple Regression] [Workshop 8 STAP 5...] [2011-11-26 14:57:33] [de8512d9b386046939a89973b76869e3]
- RMPD          [(Partial) Autocorrelation Function] [Paper SHW Deel 2...] [2011-12-16 15:43:57] [de8512d9b386046939a89973b76869e3]
- RM                [Standard Deviation-Mean Plot] [Paper SHW Deel 2 ...] [2011-12-16 15:59:09] [5c44e6aad476a1bab98fc6774eca4c08] [Current]
Feedback Forum

Post a new message
Dataseries X:
235.10
280.70
264.60
240.70
201.40
240.80
241.10
223.80
206.10
174.70
203.30
220.50
299.50
347.40
338.30
327.70
351.60
396.60
438.80
395.60
363.50
378.80
357.00
369.00
464.80
479.10
431.30
366.50
326.30
355.10
331.60
261.30
249.00
205.50
235.60
240.90
264.90
253.80
232.30
193.80
177.00
213.20
207.20
180.60
188.60
175.40
199.00
179.60
225.80
234.00
200.20
183.60
178.20
203.20
208.50
191.80
172.80
148.00
159.40
154.50
213.20
196.40
182.80
176.40
153.60
173.20
171.00
151.20
161.90
157.20
201.70
236.40
356.10
398.30
403.70
384.60
365.80
368.10
367.90
347.00
343.30
292.90
311.50
300.90
366.90
356.90
329.70
316.20
269.00
289.30
266.20
253.60
233.80
228.40
253.60
260.10
306.60
309.20
309.50
271.00
279.90
317.90
298.40
246.70
227.30
209.10
259.90
266.00
320.60
308.50
282.20
262.70
263.50
313.10
284.30
252.60
250.30
246.50
312.70
333.20
446.40
511.60
515.50
506.40
483.20
522.30
509.80
460.70
405.80
375.00
378.50
406.80
467.80
469.80
429.80
355.80
332.70
378.00
360.50
334.70
319.50
323.10
363.60
352.10
411.90
388.60
416.40
360.70
338.00
417.20
388.40
371.10
331.50
353.70
396.70
447.00
533.50
565.40
542.30
488.70
467.10
531.30
496.10
444.00
403.40
386.30
394.10
404.10
462.10
448.10
432.30
386.30
395.20
421.90
382.90
384.20
345.50
323.40
372.60
376.00
462.70
487.00
444.20
399.30
394.90
455.40
414.00
375.50
347.00
339.40
385.80
378.80
451.80
446.10
422.50
383.10
352.80
445.30
367.50
355.10
326.20
319.80
331.80
340.90
394.10
417.20
369.90
349.20
321.40
405.70
342.90
316.50
284.20
270.90
288.80
278.80
324.40
310.90
299.00
273.00
279.30
359.20
305.00
282.10
250.30
246.50
257.90
266.50
315.90
318.40
295.40
266.40
245.80
362.80
324.90
294.20
289.50
295.20
290.30
272.00
307.40
328.70
292.90
249.10
230.40
361.50
321.70
277.20
260.70
251.00
257.60
241.80
287.50
292.30
274.70
254.20
230.00
339.00
318.20
287.00
295.80
284.00
271.00
262.70
340.60
379.40
373.30
355.20
338.40
466.90
451.00
422.00
429.20
425.90
460.70
463.60
541.40
544.20
517.50
469.40
439.40
549.00
533.00
506.10
484.00
457.00
481.50
469.50
544.70
541.20
521.50
469.70
434.40
542.60
517.30
485.70
465.80
447.00
426.60
411.60
467.50
484.50
451.20
417.40
379.90
484.70
455.00
420.80
416.50
376.30
405.60
405.80
500.80
514.00
475.50
430.10
414.40
538.00
526.00
488.50
520.20
504.40
568.50
610.60
818.00
830.90
835.90
782.00
762.30
856.90
820.90
769.60
752.20
724.40
723.10
719.50
817.40
803.30
752.50
689.00
630.40
765.50
757.70
732.20
702.60
683.30
709.50
702.20
784.80
810.90
755.60
656.80
615.10
745.30
694.10
675.70
643.70
622.10
634.60
588.00
689.70
673.90
647.90
568.80
545.70
632.60
643.80
593.10
579.70
546.00
562.90
572.50


Summary of computational transaction
Raw Inputview raw input (R code)
Raw Outputview raw output of R engine
Computing time1 seconds
R Server'Herman Ole Andreas Wold' @ wold.wessa.net

\begin{tabular}{lllllllll}
\hline
Summary of computational transaction \tabularnewline
Raw Input & view raw input (R code)  \tabularnewline
Raw Output & view raw output of R engine  \tabularnewline
Computing time & 1 seconds \tabularnewline
R Server & 'Herman Ole Andreas Wold' @ wold.wessa.net \tabularnewline
\hline
\end{tabular}
%Source: https://freestatistics.org/blog/index.php?pk=156069&T=0

[TABLE]
[ROW][C]Summary of computational transaction[/C][/ROW]
[ROW][C]Raw Input[/C][C]view raw input (R code) [/C][/ROW]
[ROW][C]Raw Output[/C][C]view raw output of R engine [/C][/ROW]
[ROW][C]Computing time[/C][C]1 seconds[/C][/ROW]
[ROW][C]R Server[/C][C]'Herman Ole Andreas Wold' @ wold.wessa.net[/C][/ROW]
[/TABLE]
Source: https://freestatistics.org/blog/index.php?pk=156069&T=0

Globally Unique Identifier (entire table): ba.freestatistics.org/blog/index.php?pk=156069&T=0

As an alternative you can also use a QR Code:  

The GUIDs for individual cells are displayed in the table below:

Summary of computational transaction
Raw Inputview raw input (R code)
Raw Outputview raw output of R engine
Computing time1 seconds
R Server'Herman Ole Andreas Wold' @ wold.wessa.net


Standard Deviation-Mean Plot
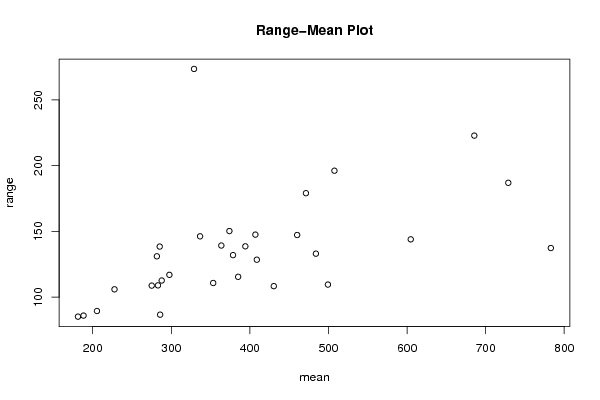
SectionMeanStandard DeviationRange
1227.73333333333329.1940010442162106
2363.6536.3267119348834139.3
3328.91666666666793.5458451857438273.6
4205.4530.324712394649189.5
5188.33333333333327.377373980362186
6181.2526.157199599901685.2
7353.34166666666736.2089506346236110.8
8285.30833333333346.6051783766048138.5
9275.12535.0509272345255108.8
10285.8530.740926229613686.7
11460.16666666666756.0969831198748147.3
12373.9553.1021228817215150.3
13385.135.1442999387072115.5
14471.35833333333364.2130184808676179.1
15394.20833333333340.6847628018454138.7
1640746.6030432092544147.6
17378.57549.9696839912143132
18336.63333333333351.5290973993129146.3
19287.84166666666733.2699826033054112.7
20297.56666666666730.476438987082117
21281.66666666666740.7140434412173131.1
22283.03333333333328.4860837901065109
23408.8548.934882520271128.5
24499.33333333333337.5159925494408109.6
25484.00833333333348.4390236808249133.1
26430.43333333333337.4665022103584108.4
27507.58333333333353.8722703730919196.2
28782.97548.4555489832973137.4
29728.853.3077684940777187
30685.55833333333372.5442618285032222.9
31604.71666666666750.4040372360882144

\begin{tabular}{lllllllll}
\hline
Standard Deviation-Mean Plot \tabularnewline
Section & Mean & Standard Deviation & Range \tabularnewline
1 & 227.733333333333 & 29.1940010442162 & 106 \tabularnewline
2 & 363.65 & 36.3267119348834 & 139.3 \tabularnewline
3 & 328.916666666667 & 93.5458451857438 & 273.6 \tabularnewline
4 & 205.45 & 30.3247123946491 & 89.5 \tabularnewline
5 & 188.333333333333 & 27.3773739803621 & 86 \tabularnewline
6 & 181.25 & 26.1571995999016 & 85.2 \tabularnewline
7 & 353.341666666667 & 36.2089506346236 & 110.8 \tabularnewline
8 & 285.308333333333 & 46.6051783766048 & 138.5 \tabularnewline
9 & 275.125 & 35.0509272345255 & 108.8 \tabularnewline
10 & 285.85 & 30.7409262296136 & 86.7 \tabularnewline
11 & 460.166666666667 & 56.0969831198748 & 147.3 \tabularnewline
12 & 373.95 & 53.1021228817215 & 150.3 \tabularnewline
13 & 385.1 & 35.1442999387072 & 115.5 \tabularnewline
14 & 471.358333333333 & 64.2130184808676 & 179.1 \tabularnewline
15 & 394.208333333333 & 40.6847628018454 & 138.7 \tabularnewline
16 & 407 & 46.6030432092544 & 147.6 \tabularnewline
17 & 378.575 & 49.9696839912143 & 132 \tabularnewline
18 & 336.633333333333 & 51.5290973993129 & 146.3 \tabularnewline
19 & 287.841666666667 & 33.2699826033054 & 112.7 \tabularnewline
20 & 297.566666666667 & 30.476438987082 & 117 \tabularnewline
21 & 281.666666666667 & 40.7140434412173 & 131.1 \tabularnewline
22 & 283.033333333333 & 28.4860837901065 & 109 \tabularnewline
23 & 408.85 & 48.934882520271 & 128.5 \tabularnewline
24 & 499.333333333333 & 37.5159925494408 & 109.6 \tabularnewline
25 & 484.008333333333 & 48.4390236808249 & 133.1 \tabularnewline
26 & 430.433333333333 & 37.4665022103584 & 108.4 \tabularnewline
27 & 507.583333333333 & 53.8722703730919 & 196.2 \tabularnewline
28 & 782.975 & 48.4555489832973 & 137.4 \tabularnewline
29 & 728.8 & 53.3077684940777 & 187 \tabularnewline
30 & 685.558333333333 & 72.5442618285032 & 222.9 \tabularnewline
31 & 604.716666666667 & 50.4040372360882 & 144 \tabularnewline
\hline
\end{tabular}
%Source: https://freestatistics.org/blog/index.php?pk=156069&T=1

[TABLE]
[ROW][C]Standard Deviation-Mean Plot[/C][/ROW]
[ROW][C]Section[/C][C]Mean[/C][C]Standard Deviation[/C][C]Range[/C][/ROW]
[ROW][C]1[/C][C]227.733333333333[/C][C]29.1940010442162[/C][C]106[/C][/ROW]
[ROW][C]2[/C][C]363.65[/C][C]36.3267119348834[/C][C]139.3[/C][/ROW]
[ROW][C]3[/C][C]328.916666666667[/C][C]93.5458451857438[/C][C]273.6[/C][/ROW]
[ROW][C]4[/C][C]205.45[/C][C]30.3247123946491[/C][C]89.5[/C][/ROW]
[ROW][C]5[/C][C]188.333333333333[/C][C]27.3773739803621[/C][C]86[/C][/ROW]
[ROW][C]6[/C][C]181.25[/C][C]26.1571995999016[/C][C]85.2[/C][/ROW]
[ROW][C]7[/C][C]353.341666666667[/C][C]36.2089506346236[/C][C]110.8[/C][/ROW]
[ROW][C]8[/C][C]285.308333333333[/C][C]46.6051783766048[/C][C]138.5[/C][/ROW]
[ROW][C]9[/C][C]275.125[/C][C]35.0509272345255[/C][C]108.8[/C][/ROW]
[ROW][C]10[/C][C]285.85[/C][C]30.7409262296136[/C][C]86.7[/C][/ROW]
[ROW][C]11[/C][C]460.166666666667[/C][C]56.0969831198748[/C][C]147.3[/C][/ROW]
[ROW][C]12[/C][C]373.95[/C][C]53.1021228817215[/C][C]150.3[/C][/ROW]
[ROW][C]13[/C][C]385.1[/C][C]35.1442999387072[/C][C]115.5[/C][/ROW]
[ROW][C]14[/C][C]471.358333333333[/C][C]64.2130184808676[/C][C]179.1[/C][/ROW]
[ROW][C]15[/C][C]394.208333333333[/C][C]40.6847628018454[/C][C]138.7[/C][/ROW]
[ROW][C]16[/C][C]407[/C][C]46.6030432092544[/C][C]147.6[/C][/ROW]
[ROW][C]17[/C][C]378.575[/C][C]49.9696839912143[/C][C]132[/C][/ROW]
[ROW][C]18[/C][C]336.633333333333[/C][C]51.5290973993129[/C][C]146.3[/C][/ROW]
[ROW][C]19[/C][C]287.841666666667[/C][C]33.2699826033054[/C][C]112.7[/C][/ROW]
[ROW][C]20[/C][C]297.566666666667[/C][C]30.476438987082[/C][C]117[/C][/ROW]
[ROW][C]21[/C][C]281.666666666667[/C][C]40.7140434412173[/C][C]131.1[/C][/ROW]
[ROW][C]22[/C][C]283.033333333333[/C][C]28.4860837901065[/C][C]109[/C][/ROW]
[ROW][C]23[/C][C]408.85[/C][C]48.934882520271[/C][C]128.5[/C][/ROW]
[ROW][C]24[/C][C]499.333333333333[/C][C]37.5159925494408[/C][C]109.6[/C][/ROW]
[ROW][C]25[/C][C]484.008333333333[/C][C]48.4390236808249[/C][C]133.1[/C][/ROW]
[ROW][C]26[/C][C]430.433333333333[/C][C]37.4665022103584[/C][C]108.4[/C][/ROW]
[ROW][C]27[/C][C]507.583333333333[/C][C]53.8722703730919[/C][C]196.2[/C][/ROW]
[ROW][C]28[/C][C]782.975[/C][C]48.4555489832973[/C][C]137.4[/C][/ROW]
[ROW][C]29[/C][C]728.8[/C][C]53.3077684940777[/C][C]187[/C][/ROW]
[ROW][C]30[/C][C]685.558333333333[/C][C]72.5442618285032[/C][C]222.9[/C][/ROW]
[ROW][C]31[/C][C]604.716666666667[/C][C]50.4040372360882[/C][C]144[/C][/ROW]
[/TABLE]
Source: https://freestatistics.org/blog/index.php?pk=156069&T=1

Globally Unique Identifier (entire table): ba.freestatistics.org/blog/index.php?pk=156069&T=1

As an alternative you can also use a QR Code:  

The GUIDs for individual cells are displayed in the table below:

Standard Deviation-Mean Plot
SectionMeanStandard DeviationRange
1227.73333333333329.1940010442162106
2363.6536.3267119348834139.3
3328.91666666666793.5458451857438273.6
4205.4530.324712394649189.5
5188.33333333333327.377373980362186
6181.2526.157199599901685.2
7353.34166666666736.2089506346236110.8
8285.30833333333346.6051783766048138.5
9275.12535.0509272345255108.8
10285.8530.740926229613686.7
11460.16666666666756.0969831198748147.3
12373.9553.1021228817215150.3
13385.135.1442999387072115.5
14471.35833333333364.2130184808676179.1
15394.20833333333340.6847628018454138.7
1640746.6030432092544147.6
17378.57549.9696839912143132
18336.63333333333351.5290973993129146.3
19287.84166666666733.2699826033054112.7
20297.56666666666730.476438987082117
21281.66666666666740.7140434412173131.1
22283.03333333333328.4860837901065109
23408.8548.934882520271128.5
24499.33333333333337.5159925494408109.6
25484.00833333333348.4390236808249133.1
26430.43333333333337.4665022103584108.4
27507.58333333333353.8722703730919196.2
28782.97548.4555489832973137.4
29728.853.3077684940777187
30685.55833333333372.5442618285032222.9
31604.71666666666750.4040372360882144


Regression: S.E.(k) = alpha + beta * Mean(k)
alpha25.0818554501784
beta0.0488516650103526
S.D.0.01553848376954
T-STAT3.14391453728042
p-value0.00382792717820019

\begin{tabular}{lllllllll}
\hline
Regression: S.E.(k) = alpha + beta * Mean(k) \tabularnewline
alpha & 25.0818554501784 \tabularnewline
beta & 0.0488516650103526 \tabularnewline
S.D. & 0.01553848376954 \tabularnewline
T-STAT & 3.14391453728042 \tabularnewline
p-value & 0.00382792717820019 \tabularnewline
\hline
\end{tabular}
%Source: https://freestatistics.org/blog/index.php?pk=156069&T=2

[TABLE]
[ROW][C]Regression: S.E.(k) = alpha + beta * Mean(k)[/C][/ROW]
[ROW][C]alpha[/C][C]25.0818554501784[/C][/ROW]
[ROW][C]beta[/C][C]0.0488516650103526[/C][/ROW]
[ROW][C]S.D.[/C][C]0.01553848376954[/C][/ROW]
[ROW][C]T-STAT[/C][C]3.14391453728042[/C][/ROW]
[ROW][C]p-value[/C][C]0.00382792717820019[/C][/ROW]
[/TABLE]
Source: https://freestatistics.org/blog/index.php?pk=156069&T=2

Globally Unique Identifier (entire table): ba.freestatistics.org/blog/index.php?pk=156069&T=2

As an alternative you can also use a QR Code:  

The GUIDs for individual cells are displayed in the table below:

Regression: S.E.(k) = alpha + beta * Mean(k)
alpha25.0818554501784
beta0.0488516650103526
S.D.0.01553848376954
T-STAT3.14391453728042
p-value0.00382792717820019


Regression: ln S.E.(k) = alpha + beta * ln Mean(k)
alpha0.596066412617832
beta0.532942026074987
S.D.0.115396834084912
T-STAT4.61834183148243
p-value7.31833172336402e-05
Lambda0.467057973925013

\begin{tabular}{lllllllll}
\hline
Regression: ln S.E.(k) = alpha + beta * ln Mean(k) \tabularnewline
alpha & 0.596066412617832 \tabularnewline
beta & 0.532942026074987 \tabularnewline
S.D. & 0.115396834084912 \tabularnewline
T-STAT & 4.61834183148243 \tabularnewline
p-value & 7.31833172336402e-05 \tabularnewline
Lambda & 0.467057973925013 \tabularnewline
\hline
\end{tabular}
%Source: https://freestatistics.org/blog/index.php?pk=156069&T=3

[TABLE]
[ROW][C]Regression: ln S.E.(k) = alpha + beta * ln Mean(k)[/C][/ROW]
[ROW][C]alpha[/C][C]0.596066412617832[/C][/ROW]
[ROW][C]beta[/C][C]0.532942026074987[/C][/ROW]
[ROW][C]S.D.[/C][C]0.115396834084912[/C][/ROW]
[ROW][C]T-STAT[/C][C]4.61834183148243[/C][/ROW]
[ROW][C]p-value[/C][C]7.31833172336402e-05[/C][/ROW]
[ROW][C]Lambda[/C][C]0.467057973925013[/C][/ROW]
[/TABLE]
Source: https://freestatistics.org/blog/index.php?pk=156069&T=3

Globally Unique Identifier (entire table): ba.freestatistics.org/blog/index.php?pk=156069&T=3

As an alternative you can also use a QR Code:  

The GUIDs for individual cells are displayed in the table below:

Regression: ln S.E.(k) = alpha + beta * ln Mean(k)
alpha0.596066412617832
beta0.532942026074987
S.D.0.115396834084912
T-STAT4.61834183148243
p-value7.31833172336402e-05
Lambda0.467057973925013


Parameters (Session):
par1 = additive ; par2 = 12 ;
Parameters (R input):
par1 = 12 ;
R code (references can be found in the software module):
par1 <- as.numeric(par1)
(n <- length(x))
(np <- floor(n / par1))
arr <- array(NA,dim=c(par1,np))
j <- 0
k <- 1
for (i in 1:(np*par1))
{
j = j + 1
arr[j,k] <- x[i]
if (j == par1) {
j = 0
k=k+1
}
}
arr
arr.mean <- array(NA,dim=np)
arr.sd <- array(NA,dim=np)
arr.range <- array(NA,dim=np)
for (j in 1:np)
{
arr.mean[j] <- mean(arr[,j],na.rm=TRUE)
arr.sd[j] <- sd(arr[,j],na.rm=TRUE)
arr.range[j] <- max(arr[,j],na.rm=TRUE) - min(arr[,j],na.rm=TRUE)
}
arr.mean
arr.sd
arr.range
(lm1 <- lm(arr.sd~arr.mean))
(lnlm1 <- lm(log(arr.sd)~log(arr.mean)))
(lm2 <- lm(arr.range~arr.mean))
bitmap(file='test1.png')
plot(arr.mean,arr.sd,main='Standard Deviation-Mean Plot',xlab='mean',ylab='standard deviation')
dev.off()
bitmap(file='test2.png')
plot(arr.mean,arr.range,main='Range-Mean Plot',xlab='mean',ylab='range')
dev.off()
load(file='createtable')
a<-table.start()
a<-table.row.start(a)
a<-table.element(a,'Standard Deviation-Mean Plot',4,TRUE)
a<-table.row.end(a)
a<-table.row.start(a)
a<-table.element(a,'Section',header=TRUE)
a<-table.element(a,'Mean',header=TRUE)
a<-table.element(a,'Standard Deviation',header=TRUE)
a<-table.element(a,'Range',header=TRUE)
a<-table.row.end(a)
for (j in 1:np) {
a<-table.row.start(a)
a<-table.element(a,j,header=TRUE)
a<-table.element(a,arr.mean[j])
a<-table.element(a,arr.sd[j] )
a<-table.element(a,arr.range[j] )
a<-table.row.end(a)
}
a<-table.end(a)
table.save(a,file='mytable.tab')
a<-table.start()
a<-table.row.start(a)
a<-table.element(a,'Regression: S.E.(k) = alpha + beta * Mean(k)',2,TRUE)
a<-table.row.end(a)
a<-table.row.start(a)
a<-table.element(a,'alpha',header=TRUE)
a<-table.element(a,lm1$coefficients[[1]])
a<-table.row.end(a)
a<-table.row.start(a)
a<-table.element(a,'beta',header=TRUE)
a<-table.element(a,lm1$coefficients[[2]])
a<-table.row.end(a)
a<-table.row.start(a)
a<-table.element(a,'S.D.',header=TRUE)
a<-table.element(a,summary(lm1)$coefficients[2,2])
a<-table.row.end(a)
a<-table.row.start(a)
a<-table.element(a,'T-STAT',header=TRUE)
a<-table.element(a,summary(lm1)$coefficients[2,3])
a<-table.row.end(a)
a<-table.row.start(a)
a<-table.element(a,'p-value',header=TRUE)
a<-table.element(a,summary(lm1)$coefficients[2,4])
a<-table.row.end(a)
a<-table.end(a)
table.save(a,file='mytable1.tab')
a<-table.start()
a<-table.row.start(a)
a<-table.element(a,'Regression: ln S.E.(k) = alpha + beta * ln Mean(k)',2,TRUE)
a<-table.row.end(a)
a<-table.row.start(a)
a<-table.element(a,'alpha',header=TRUE)
a<-table.element(a,lnlm1$coefficients[[1]])
a<-table.row.end(a)
a<-table.row.start(a)
a<-table.element(a,'beta',header=TRUE)
a<-table.element(a,lnlm1$coefficients[[2]])
a<-table.row.end(a)
a<-table.row.start(a)
a<-table.element(a,'S.D.',header=TRUE)
a<-table.element(a,summary(lnlm1)$coefficients[2,2])
a<-table.row.end(a)
a<-table.row.start(a)
a<-table.element(a,'T-STAT',header=TRUE)
a<-table.element(a,summary(lnlm1)$coefficients[2,3])
a<-table.row.end(a)
a<-table.row.start(a)
a<-table.element(a,'p-value',header=TRUE)
a<-table.element(a,summary(lnlm1)$coefficients[2,4])
a<-table.row.end(a)
a<-table.row.start(a)
a<-table.element(a,'Lambda',header=TRUE)
a<-table.element(a,1-lnlm1$coefficients[[2]])
a<-table.row.end(a)
a<-table.end(a)
table.save(a,file='mytable2.tab')