Free Statistics

of Irreproducible Research!

Author's title

Author*The author of this computation has been verified*
R Software Modulerwasp_multipleregression.wasp
Title produced by softwareMultiple Regression
Date of computationFri, 16 Dec 2011 09:35:59 -0500
Cite this page as followsStatistical Computations at FreeStatistics.org, Office for Research Development and Education, URL https://freestatistics.org/blog/index.php?v=date/2011/Dec/16/t1324046214mewlgaea1ut4zq6.htm/, Retrieved Sat, 27 Apr 2024 15:17:49 +0000
Statistical Computations at FreeStatistics.org, Office for Research Development and Education, URL https://freestatistics.org/blog/index.php?pk=155991, Retrieved Sat, 27 Apr 2024 15:17:49 +0000
QR Codes:

Original text written by user:
IsPrivate?No (this computation is public)
User-defined keywords
Estimated Impact101
Family? (F = Feedback message, R = changed R code, M = changed R Module, P = changed Parameters, D = changed Data)
-     [Univariate Data Series] [data set] [2008-12-01 19:54:57] [b98453cac15ba1066b407e146608df68]
- RMP   [Multiple Regression] [Workshop 8 - Mult...] [2011-11-29 10:02:15] [4cb29c3614c5a92c2f34c46f79abd839]
-   P     [Multiple Regression] [WS 8 - Multiple R...] [2011-11-29 16:42:26] [59e9c089bdd600b584669dddc48fbcc3]
- R PD      [Multiple Regression] [Paper deel 2 - MR] [2011-12-16 10:36:57] [59e9c089bdd600b584669dddc48fbcc3]
-   P           [Multiple Regression] [Paper deel 2 - MR...] [2011-12-16 14:35:59] [e1c4030d3eb0ab0fcc7a7b48aeaac474] [Current]
Feedback Forum

Post a new message
Dataseries X:
655362
873127
1107897
1555964
1671159
1493308
2957796
2638691
1305669
1280496
921900
867888
652586
913831
1108544
1555827
1699283
1509458
3268975
2425016
1312703
1365498
934453
775019
651142
843192
1146766
1652601
1465906
1652734
2922334
2702805
1458956
1410363
1019279
936574
708917
885295
1099663
1576220
1487870
1488635
2882530
2677026
1404398
1344370
936865
872705
628151
953712
1160384
1400618
1661511
1495347
2918786
2775677
1407026
1370199
964526
850851
683118
847224
1073256
1514326
1503734
1507712
2865698
2788128
1391596
1366378
946295
859626


Summary of computational transaction
Raw Inputview raw input (R code)
Raw Outputview raw output of R engine
Computing time4 seconds
R Server'Gwilym Jenkins' @ jenkins.wessa.net

\begin{tabular}{lllllllll}
\hline
Summary of computational transaction \tabularnewline
Raw Input & view raw input (R code)  \tabularnewline
Raw Output & view raw output of R engine  \tabularnewline
Computing time & 4 seconds \tabularnewline
R Server & 'Gwilym Jenkins' @ jenkins.wessa.net \tabularnewline
\hline
\end{tabular}
%Source: https://freestatistics.org/blog/index.php?pk=155991&T=0

[TABLE]
[ROW][C]Summary of computational transaction[/C][/ROW]
[ROW][C]Raw Input[/C][C]view raw input (R code) [/C][/ROW]
[ROW][C]Raw Output[/C][C]view raw output of R engine [/C][/ROW]
[ROW][C]Computing time[/C][C]4 seconds[/C][/ROW]
[ROW][C]R Server[/C][C]'Gwilym Jenkins' @ jenkins.wessa.net[/C][/ROW]
[/TABLE]
Source: https://freestatistics.org/blog/index.php?pk=155991&T=0

Globally Unique Identifier (entire table): ba.freestatistics.org/blog/index.php?pk=155991&T=0

As an alternative you can also use a QR Code:  

The GUIDs for individual cells are displayed in the table below:

Summary of computational transaction
Raw Inputview raw input (R code)
Raw Outputview raw output of R engine
Computing time4 seconds
R Server'Gwilym Jenkins' @ jenkins.wessa.net


Multiple Linear Regression - Estimated Regression Equation
Overnachtingen[t] = + 860443.833333333 -197231.166666667M1[t] + 25619.6666666668M2[t] + 255641.166666667M3[t] + 682148.833333333M4[t] + 721133.333333333M5[t] + 664088.5M6[t] + 2108909.33333333M7[t] + 1807446.66666667M8[t] + 519614.166666667M9[t] + 495773.5M10[t] + 93442.5M11[t] + e[t]

\begin{tabular}{lllllllll}
\hline
Multiple Linear Regression - Estimated Regression Equation \tabularnewline
Overnachtingen[t] =  +  860443.833333333 -197231.166666667M1[t] +  25619.6666666668M2[t] +  255641.166666667M3[t] +  682148.833333333M4[t] +  721133.333333333M5[t] +  664088.5M6[t] +  2108909.33333333M7[t] +  1807446.66666667M8[t] +  519614.166666667M9[t] +  495773.5M10[t] +  93442.5M11[t]  + e[t] \tabularnewline
\hline
\end{tabular}
%Source: https://freestatistics.org/blog/index.php?pk=155991&T=1

[TABLE]
[ROW][C]Multiple Linear Regression - Estimated Regression Equation[/C][/ROW]
[ROW][C]Overnachtingen[t] =  +  860443.833333333 -197231.166666667M1[t] +  25619.6666666668M2[t] +  255641.166666667M3[t] +  682148.833333333M4[t] +  721133.333333333M5[t] +  664088.5M6[t] +  2108909.33333333M7[t] +  1807446.66666667M8[t] +  519614.166666667M9[t] +  495773.5M10[t] +  93442.5M11[t]  + e[t][/C][/ROW]
[/TABLE]
Source: https://freestatistics.org/blog/index.php?pk=155991&T=1

Globally Unique Identifier (entire table): ba.freestatistics.org/blog/index.php?pk=155991&T=1

As an alternative you can also use a QR Code:  

The GUIDs for individual cells are displayed in the table below:

Multiple Linear Regression - Estimated Regression Equation
Overnachtingen[t] = + 860443.833333333 -197231.166666667M1[t] + 25619.6666666668M2[t] + 255641.166666667M3[t] + 682148.833333333M4[t] + 721133.333333333M5[t] + 664088.5M6[t] + 2108909.33333333M7[t] + 1807446.66666667M8[t] + 519614.166666667M9[t] + 495773.5M10[t] + 93442.5M11[t] + e[t]


Multiple Linear Regression - Ordinary Least Squares
VariableParameterS.D.T-STATH0: parameter = 02-tail p-value1-tail p-value
(Intercept)860443.83333333332307.74302926.632700
M1-197231.16666666745690.048361-4.31676e-053e-05
M225619.666666666845690.0483610.56070.5770710.288536
M3255641.16666666745690.0483615.59511e-060
M4682148.83333333345690.04836114.929900
M5721133.33333333345690.04836115.783200
M6664088.545690.04836114.534600
M72108909.3333333345690.04836146.156900
M81807446.6666666745690.04836139.558900
M9519614.16666666745690.04836111.372600
M10495773.545690.04836110.850800
M1193442.545690.0483612.04510.0452340.022617

\begin{tabular}{lllllllll}
\hline
Multiple Linear Regression - Ordinary Least Squares \tabularnewline
Variable & Parameter & S.D. & T-STATH0: parameter = 0 & 2-tail p-value & 1-tail p-value \tabularnewline
(Intercept) & 860443.833333333 & 32307.743029 & 26.6327 & 0 & 0 \tabularnewline
M1 & -197231.166666667 & 45690.048361 & -4.3167 & 6e-05 & 3e-05 \tabularnewline
M2 & 25619.6666666668 & 45690.048361 & 0.5607 & 0.577071 & 0.288536 \tabularnewline
M3 & 255641.166666667 & 45690.048361 & 5.5951 & 1e-06 & 0 \tabularnewline
M4 & 682148.833333333 & 45690.048361 & 14.9299 & 0 & 0 \tabularnewline
M5 & 721133.333333333 & 45690.048361 & 15.7832 & 0 & 0 \tabularnewline
M6 & 664088.5 & 45690.048361 & 14.5346 & 0 & 0 \tabularnewline
M7 & 2108909.33333333 & 45690.048361 & 46.1569 & 0 & 0 \tabularnewline
M8 & 1807446.66666667 & 45690.048361 & 39.5589 & 0 & 0 \tabularnewline
M9 & 519614.166666667 & 45690.048361 & 11.3726 & 0 & 0 \tabularnewline
M10 & 495773.5 & 45690.048361 & 10.8508 & 0 & 0 \tabularnewline
M11 & 93442.5 & 45690.048361 & 2.0451 & 0.045234 & 0.022617 \tabularnewline
\hline
\end{tabular}
%Source: https://freestatistics.org/blog/index.php?pk=155991&T=2

[TABLE]
[ROW][C]Multiple Linear Regression - Ordinary Least Squares[/C][/ROW]
[ROW][C]Variable[/C][C]Parameter[/C][C]S.D.[/C][C]T-STATH0: parameter = 0[/C][C]2-tail p-value[/C][C]1-tail p-value[/C][/ROW]
[ROW][C](Intercept)[/C][C]860443.833333333[/C][C]32307.743029[/C][C]26.6327[/C][C]0[/C][C]0[/C][/ROW]
[ROW][C]M1[/C][C]-197231.166666667[/C][C]45690.048361[/C][C]-4.3167[/C][C]6e-05[/C][C]3e-05[/C][/ROW]
[ROW][C]M2[/C][C]25619.6666666668[/C][C]45690.048361[/C][C]0.5607[/C][C]0.577071[/C][C]0.288536[/C][/ROW]
[ROW][C]M3[/C][C]255641.166666667[/C][C]45690.048361[/C][C]5.5951[/C][C]1e-06[/C][C]0[/C][/ROW]
[ROW][C]M4[/C][C]682148.833333333[/C][C]45690.048361[/C][C]14.9299[/C][C]0[/C][C]0[/C][/ROW]
[ROW][C]M5[/C][C]721133.333333333[/C][C]45690.048361[/C][C]15.7832[/C][C]0[/C][C]0[/C][/ROW]
[ROW][C]M6[/C][C]664088.5[/C][C]45690.048361[/C][C]14.5346[/C][C]0[/C][C]0[/C][/ROW]
[ROW][C]M7[/C][C]2108909.33333333[/C][C]45690.048361[/C][C]46.1569[/C][C]0[/C][C]0[/C][/ROW]
[ROW][C]M8[/C][C]1807446.66666667[/C][C]45690.048361[/C][C]39.5589[/C][C]0[/C][C]0[/C][/ROW]
[ROW][C]M9[/C][C]519614.166666667[/C][C]45690.048361[/C][C]11.3726[/C][C]0[/C][C]0[/C][/ROW]
[ROW][C]M10[/C][C]495773.5[/C][C]45690.048361[/C][C]10.8508[/C][C]0[/C][C]0[/C][/ROW]
[ROW][C]M11[/C][C]93442.5[/C][C]45690.048361[/C][C]2.0451[/C][C]0.045234[/C][C]0.022617[/C][/ROW]
[/TABLE]
Source: https://freestatistics.org/blog/index.php?pk=155991&T=2

Globally Unique Identifier (entire table): ba.freestatistics.org/blog/index.php?pk=155991&T=2

As an alternative you can also use a QR Code:  

The GUIDs for individual cells are displayed in the table below:

Multiple Linear Regression - Ordinary Least Squares
VariableParameterS.D.T-STATH0: parameter = 02-tail p-value1-tail p-value
(Intercept)860443.83333333332307.74302926.632700
M1-197231.16666666745690.048361-4.31676e-053e-05
M225619.666666666845690.0483610.56070.5770710.288536
M3255641.16666666745690.0483615.59511e-060
M4682148.83333333345690.04836114.929900
M5721133.33333333345690.04836115.783200
M6664088.545690.04836114.534600
M72108909.3333333345690.04836146.156900
M81807446.6666666745690.04836139.558900
M9519614.16666666745690.04836111.372600
M10495773.545690.04836110.850800
M1193442.545690.0483612.04510.0452340.022617


Multiple Linear Regression - Regression Statistics
Multiple R0.994332507390672
R-squared0.98869713525382
Adjusted R-squared0.986624943383687
F-TEST (value)477.12624950623
F-TEST (DF numerator)11
F-TEST (DF denominator)60
p-value0
Multiple Linear Regression - Residual Statistics
Residual Standard Deviation79137.4851620232
Sum Squared Residuals375764493466.166

\begin{tabular}{lllllllll}
\hline
Multiple Linear Regression - Regression Statistics \tabularnewline
Multiple R & 0.994332507390672 \tabularnewline
R-squared & 0.98869713525382 \tabularnewline
Adjusted R-squared & 0.986624943383687 \tabularnewline
F-TEST (value) & 477.12624950623 \tabularnewline
F-TEST (DF numerator) & 11 \tabularnewline
F-TEST (DF denominator) & 60 \tabularnewline
p-value & 0 \tabularnewline
Multiple Linear Regression - Residual Statistics \tabularnewline
Residual Standard Deviation & 79137.4851620232 \tabularnewline
Sum Squared Residuals & 375764493466.166 \tabularnewline
\hline
\end{tabular}
%Source: https://freestatistics.org/blog/index.php?pk=155991&T=3

[TABLE]
[ROW][C]Multiple Linear Regression - Regression Statistics[/C][/ROW]
[ROW][C]Multiple R[/C][C]0.994332507390672[/C][/ROW]
[ROW][C]R-squared[/C][C]0.98869713525382[/C][/ROW]
[ROW][C]Adjusted R-squared[/C][C]0.986624943383687[/C][/ROW]
[ROW][C]F-TEST (value)[/C][C]477.12624950623[/C][/ROW]
[ROW][C]F-TEST (DF numerator)[/C][C]11[/C][/ROW]
[ROW][C]F-TEST (DF denominator)[/C][C]60[/C][/ROW]
[ROW][C]p-value[/C][C]0[/C][/ROW]
[ROW][C]Multiple Linear Regression - Residual Statistics[/C][/ROW]
[ROW][C]Residual Standard Deviation[/C][C]79137.4851620232[/C][/ROW]
[ROW][C]Sum Squared Residuals[/C][C]375764493466.166[/C][/ROW]
[/TABLE]
Source: https://freestatistics.org/blog/index.php?pk=155991&T=3

Globally Unique Identifier (entire table): ba.freestatistics.org/blog/index.php?pk=155991&T=3

As an alternative you can also use a QR Code:  

The GUIDs for individual cells are displayed in the table below:

Multiple Linear Regression - Regression Statistics
Multiple R0.994332507390672
R-squared0.98869713525382
Adjusted R-squared0.986624943383687
F-TEST (value)477.12624950623
F-TEST (DF numerator)11
F-TEST (DF denominator)60
p-value0
Multiple Linear Regression - Residual Statistics
Residual Standard Deviation79137.4851620232
Sum Squared Residuals375764493466.166


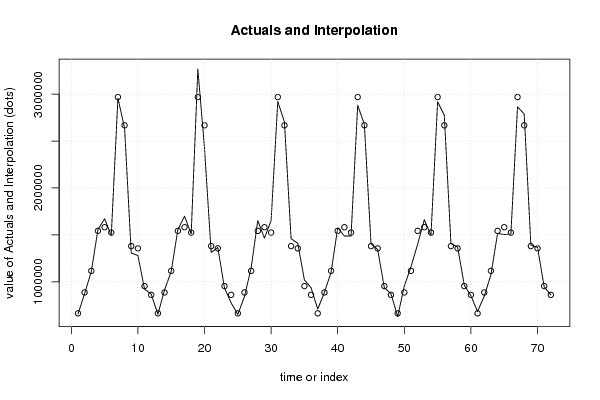
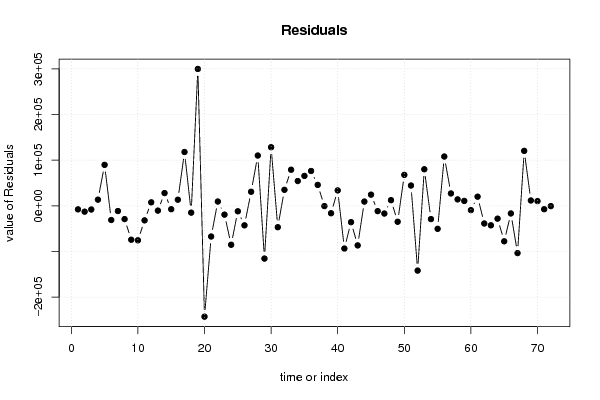
Multiple Linear Regression - Actuals, Interpolation, and Residuals
Time or IndexActualsInterpolationForecastResidualsPrediction Error
1655362663212.666666667-7850.6666666669
2873127886063.5-12936.5
311078971116085-8188.00000000007
415559641542592.6666666713371.3333333331
516711591581577.1666666789581.8333333331
614933081524532.33333333-31224.3333333332
729577962969353.16666667-11557.1666666665
826386912667890.5-29199.4999999995
913056691380058-74388.9999999999
1012804961356217.33333333-75721.3333333332
11921900953886.333333333-31986.3333333334
12867888860443.8333333337444.16666666663
13652586663212.666666667-10626.6666666666
14913831886063.527767.5
1511085441116085-7540.99999999998
1615558271542592.6666666713234.3333333334
1716992831581577.16666667117705.833333333
1815094581524532.33333333-15074.3333333334
1932689752969353.16666667299621.833333333
2024250162667890.5-242874.5
2113127031380058-67355.0000000001
2213654981356217.333333339280.66666666662
23934453953886.333333333-19433.3333333333
24775019860443.833333333-85424.8333333332
25651142663212.666666667-12070.6666666666
26843192886063.5-42871.4999999999
271146766111608530681
2816526011542592.66666667110008.333333333
2914659061581577.16666667-115671.166666667
3016527341524532.33333333128201.666666667
3129223342969353.16666667-47019.1666666667
3227028052667890.534914.4999999998
331458956138005878898
3414103631356217.3333333354145.6666666667
351019279953886.33333333365392.6666666666
36936574860443.83333333376130.1666666667
37708917663212.66666666745704.3333333334
38885295886063.5-768.500000000034
3910996631116085-16422
4015762201542592.6666666733627.3333333334
4114878701581577.16666667-93707.1666666666
4214886351524532.33333333-35897.3333333334
4328825302969353.16666667-86823.1666666667
4426770262667890.59135.4999999998
451404398138005824340
4613443701356217.33333333-11847.3333333334
47936865953886.333333333-17021.3333333333
48872705860443.83333333312261.1666666667
49628151663212.666666667-35061.6666666666
50953712886063.567648.4999999999
511160384111608544299
5214006181542592.66666667-141974.666666667
5316615111581577.1666666779933.8333333333
5414953471524532.33333333-29185.3333333334
5529187862969353.16666667-50567.1666666667
5627756772667890.5107786.5
571407026138005826968
5813701991356217.3333333313981.6666666666
59964526953886.33333333310639.6666666667
60850851860443.833333333-9592.83333333334
61683118663212.66666666719905.3333333334
62847224886063.5-38839.4999999999
6310732561116085-42829
6415143261542592.66666667-28266.6666666666
6515037341581577.16666667-77843.1666666666
6615077121524532.33333333-16820.3333333334
6728656982969353.16666667-103655.166666667
6827881282667890.5120237.5
691391596138005811538
7013663781356217.3333333310160.6666666666
71946295953886.333333333-7591.33333333332
72859626860443.833333333-817.833333333343

\begin{tabular}{lllllllll}
\hline
Multiple Linear Regression - Actuals, Interpolation, and Residuals \tabularnewline
Time or Index & Actuals & InterpolationForecast & ResidualsPrediction Error \tabularnewline
1 & 655362 & 663212.666666667 & -7850.6666666669 \tabularnewline
2 & 873127 & 886063.5 & -12936.5 \tabularnewline
3 & 1107897 & 1116085 & -8188.00000000007 \tabularnewline
4 & 1555964 & 1542592.66666667 & 13371.3333333331 \tabularnewline
5 & 1671159 & 1581577.16666667 & 89581.8333333331 \tabularnewline
6 & 1493308 & 1524532.33333333 & -31224.3333333332 \tabularnewline
7 & 2957796 & 2969353.16666667 & -11557.1666666665 \tabularnewline
8 & 2638691 & 2667890.5 & -29199.4999999995 \tabularnewline
9 & 1305669 & 1380058 & -74388.9999999999 \tabularnewline
10 & 1280496 & 1356217.33333333 & -75721.3333333332 \tabularnewline
11 & 921900 & 953886.333333333 & -31986.3333333334 \tabularnewline
12 & 867888 & 860443.833333333 & 7444.16666666663 \tabularnewline
13 & 652586 & 663212.666666667 & -10626.6666666666 \tabularnewline
14 & 913831 & 886063.5 & 27767.5 \tabularnewline
15 & 1108544 & 1116085 & -7540.99999999998 \tabularnewline
16 & 1555827 & 1542592.66666667 & 13234.3333333334 \tabularnewline
17 & 1699283 & 1581577.16666667 & 117705.833333333 \tabularnewline
18 & 1509458 & 1524532.33333333 & -15074.3333333334 \tabularnewline
19 & 3268975 & 2969353.16666667 & 299621.833333333 \tabularnewline
20 & 2425016 & 2667890.5 & -242874.5 \tabularnewline
21 & 1312703 & 1380058 & -67355.0000000001 \tabularnewline
22 & 1365498 & 1356217.33333333 & 9280.66666666662 \tabularnewline
23 & 934453 & 953886.333333333 & -19433.3333333333 \tabularnewline
24 & 775019 & 860443.833333333 & -85424.8333333332 \tabularnewline
25 & 651142 & 663212.666666667 & -12070.6666666666 \tabularnewline
26 & 843192 & 886063.5 & -42871.4999999999 \tabularnewline
27 & 1146766 & 1116085 & 30681 \tabularnewline
28 & 1652601 & 1542592.66666667 & 110008.333333333 \tabularnewline
29 & 1465906 & 1581577.16666667 & -115671.166666667 \tabularnewline
30 & 1652734 & 1524532.33333333 & 128201.666666667 \tabularnewline
31 & 2922334 & 2969353.16666667 & -47019.1666666667 \tabularnewline
32 & 2702805 & 2667890.5 & 34914.4999999998 \tabularnewline
33 & 1458956 & 1380058 & 78898 \tabularnewline
34 & 1410363 & 1356217.33333333 & 54145.6666666667 \tabularnewline
35 & 1019279 & 953886.333333333 & 65392.6666666666 \tabularnewline
36 & 936574 & 860443.833333333 & 76130.1666666667 \tabularnewline
37 & 708917 & 663212.666666667 & 45704.3333333334 \tabularnewline
38 & 885295 & 886063.5 & -768.500000000034 \tabularnewline
39 & 1099663 & 1116085 & -16422 \tabularnewline
40 & 1576220 & 1542592.66666667 & 33627.3333333334 \tabularnewline
41 & 1487870 & 1581577.16666667 & -93707.1666666666 \tabularnewline
42 & 1488635 & 1524532.33333333 & -35897.3333333334 \tabularnewline
43 & 2882530 & 2969353.16666667 & -86823.1666666667 \tabularnewline
44 & 2677026 & 2667890.5 & 9135.4999999998 \tabularnewline
45 & 1404398 & 1380058 & 24340 \tabularnewline
46 & 1344370 & 1356217.33333333 & -11847.3333333334 \tabularnewline
47 & 936865 & 953886.333333333 & -17021.3333333333 \tabularnewline
48 & 872705 & 860443.833333333 & 12261.1666666667 \tabularnewline
49 & 628151 & 663212.666666667 & -35061.6666666666 \tabularnewline
50 & 953712 & 886063.5 & 67648.4999999999 \tabularnewline
51 & 1160384 & 1116085 & 44299 \tabularnewline
52 & 1400618 & 1542592.66666667 & -141974.666666667 \tabularnewline
53 & 1661511 & 1581577.16666667 & 79933.8333333333 \tabularnewline
54 & 1495347 & 1524532.33333333 & -29185.3333333334 \tabularnewline
55 & 2918786 & 2969353.16666667 & -50567.1666666667 \tabularnewline
56 & 2775677 & 2667890.5 & 107786.5 \tabularnewline
57 & 1407026 & 1380058 & 26968 \tabularnewline
58 & 1370199 & 1356217.33333333 & 13981.6666666666 \tabularnewline
59 & 964526 & 953886.333333333 & 10639.6666666667 \tabularnewline
60 & 850851 & 860443.833333333 & -9592.83333333334 \tabularnewline
61 & 683118 & 663212.666666667 & 19905.3333333334 \tabularnewline
62 & 847224 & 886063.5 & -38839.4999999999 \tabularnewline
63 & 1073256 & 1116085 & -42829 \tabularnewline
64 & 1514326 & 1542592.66666667 & -28266.6666666666 \tabularnewline
65 & 1503734 & 1581577.16666667 & -77843.1666666666 \tabularnewline
66 & 1507712 & 1524532.33333333 & -16820.3333333334 \tabularnewline
67 & 2865698 & 2969353.16666667 & -103655.166666667 \tabularnewline
68 & 2788128 & 2667890.5 & 120237.5 \tabularnewline
69 & 1391596 & 1380058 & 11538 \tabularnewline
70 & 1366378 & 1356217.33333333 & 10160.6666666666 \tabularnewline
71 & 946295 & 953886.333333333 & -7591.33333333332 \tabularnewline
72 & 859626 & 860443.833333333 & -817.833333333343 \tabularnewline
\hline
\end{tabular}
%Source: https://freestatistics.org/blog/index.php?pk=155991&T=4

[TABLE]
[ROW][C]Multiple Linear Regression - Actuals, Interpolation, and Residuals[/C][/ROW]
[ROW][C]Time or Index[/C][C]Actuals[/C][C]InterpolationForecast[/C][C]ResidualsPrediction Error[/C][/ROW]
[ROW][C]1[/C][C]655362[/C][C]663212.666666667[/C][C]-7850.6666666669[/C][/ROW]
[ROW][C]2[/C][C]873127[/C][C]886063.5[/C][C]-12936.5[/C][/ROW]
[ROW][C]3[/C][C]1107897[/C][C]1116085[/C][C]-8188.00000000007[/C][/ROW]
[ROW][C]4[/C][C]1555964[/C][C]1542592.66666667[/C][C]13371.3333333331[/C][/ROW]
[ROW][C]5[/C][C]1671159[/C][C]1581577.16666667[/C][C]89581.8333333331[/C][/ROW]
[ROW][C]6[/C][C]1493308[/C][C]1524532.33333333[/C][C]-31224.3333333332[/C][/ROW]
[ROW][C]7[/C][C]2957796[/C][C]2969353.16666667[/C][C]-11557.1666666665[/C][/ROW]
[ROW][C]8[/C][C]2638691[/C][C]2667890.5[/C][C]-29199.4999999995[/C][/ROW]
[ROW][C]9[/C][C]1305669[/C][C]1380058[/C][C]-74388.9999999999[/C][/ROW]
[ROW][C]10[/C][C]1280496[/C][C]1356217.33333333[/C][C]-75721.3333333332[/C][/ROW]
[ROW][C]11[/C][C]921900[/C][C]953886.333333333[/C][C]-31986.3333333334[/C][/ROW]
[ROW][C]12[/C][C]867888[/C][C]860443.833333333[/C][C]7444.16666666663[/C][/ROW]
[ROW][C]13[/C][C]652586[/C][C]663212.666666667[/C][C]-10626.6666666666[/C][/ROW]
[ROW][C]14[/C][C]913831[/C][C]886063.5[/C][C]27767.5[/C][/ROW]
[ROW][C]15[/C][C]1108544[/C][C]1116085[/C][C]-7540.99999999998[/C][/ROW]
[ROW][C]16[/C][C]1555827[/C][C]1542592.66666667[/C][C]13234.3333333334[/C][/ROW]
[ROW][C]17[/C][C]1699283[/C][C]1581577.16666667[/C][C]117705.833333333[/C][/ROW]
[ROW][C]18[/C][C]1509458[/C][C]1524532.33333333[/C][C]-15074.3333333334[/C][/ROW]
[ROW][C]19[/C][C]3268975[/C][C]2969353.16666667[/C][C]299621.833333333[/C][/ROW]
[ROW][C]20[/C][C]2425016[/C][C]2667890.5[/C][C]-242874.5[/C][/ROW]
[ROW][C]21[/C][C]1312703[/C][C]1380058[/C][C]-67355.0000000001[/C][/ROW]
[ROW][C]22[/C][C]1365498[/C][C]1356217.33333333[/C][C]9280.66666666662[/C][/ROW]
[ROW][C]23[/C][C]934453[/C][C]953886.333333333[/C][C]-19433.3333333333[/C][/ROW]
[ROW][C]24[/C][C]775019[/C][C]860443.833333333[/C][C]-85424.8333333332[/C][/ROW]
[ROW][C]25[/C][C]651142[/C][C]663212.666666667[/C][C]-12070.6666666666[/C][/ROW]
[ROW][C]26[/C][C]843192[/C][C]886063.5[/C][C]-42871.4999999999[/C][/ROW]
[ROW][C]27[/C][C]1146766[/C][C]1116085[/C][C]30681[/C][/ROW]
[ROW][C]28[/C][C]1652601[/C][C]1542592.66666667[/C][C]110008.333333333[/C][/ROW]
[ROW][C]29[/C][C]1465906[/C][C]1581577.16666667[/C][C]-115671.166666667[/C][/ROW]
[ROW][C]30[/C][C]1652734[/C][C]1524532.33333333[/C][C]128201.666666667[/C][/ROW]
[ROW][C]31[/C][C]2922334[/C][C]2969353.16666667[/C][C]-47019.1666666667[/C][/ROW]
[ROW][C]32[/C][C]2702805[/C][C]2667890.5[/C][C]34914.4999999998[/C][/ROW]
[ROW][C]33[/C][C]1458956[/C][C]1380058[/C][C]78898[/C][/ROW]
[ROW][C]34[/C][C]1410363[/C][C]1356217.33333333[/C][C]54145.6666666667[/C][/ROW]
[ROW][C]35[/C][C]1019279[/C][C]953886.333333333[/C][C]65392.6666666666[/C][/ROW]
[ROW][C]36[/C][C]936574[/C][C]860443.833333333[/C][C]76130.1666666667[/C][/ROW]
[ROW][C]37[/C][C]708917[/C][C]663212.666666667[/C][C]45704.3333333334[/C][/ROW]
[ROW][C]38[/C][C]885295[/C][C]886063.5[/C][C]-768.500000000034[/C][/ROW]
[ROW][C]39[/C][C]1099663[/C][C]1116085[/C][C]-16422[/C][/ROW]
[ROW][C]40[/C][C]1576220[/C][C]1542592.66666667[/C][C]33627.3333333334[/C][/ROW]
[ROW][C]41[/C][C]1487870[/C][C]1581577.16666667[/C][C]-93707.1666666666[/C][/ROW]
[ROW][C]42[/C][C]1488635[/C][C]1524532.33333333[/C][C]-35897.3333333334[/C][/ROW]
[ROW][C]43[/C][C]2882530[/C][C]2969353.16666667[/C][C]-86823.1666666667[/C][/ROW]
[ROW][C]44[/C][C]2677026[/C][C]2667890.5[/C][C]9135.4999999998[/C][/ROW]
[ROW][C]45[/C][C]1404398[/C][C]1380058[/C][C]24340[/C][/ROW]
[ROW][C]46[/C][C]1344370[/C][C]1356217.33333333[/C][C]-11847.3333333334[/C][/ROW]
[ROW][C]47[/C][C]936865[/C][C]953886.333333333[/C][C]-17021.3333333333[/C][/ROW]
[ROW][C]48[/C][C]872705[/C][C]860443.833333333[/C][C]12261.1666666667[/C][/ROW]
[ROW][C]49[/C][C]628151[/C][C]663212.666666667[/C][C]-35061.6666666666[/C][/ROW]
[ROW][C]50[/C][C]953712[/C][C]886063.5[/C][C]67648.4999999999[/C][/ROW]
[ROW][C]51[/C][C]1160384[/C][C]1116085[/C][C]44299[/C][/ROW]
[ROW][C]52[/C][C]1400618[/C][C]1542592.66666667[/C][C]-141974.666666667[/C][/ROW]
[ROW][C]53[/C][C]1661511[/C][C]1581577.16666667[/C][C]79933.8333333333[/C][/ROW]
[ROW][C]54[/C][C]1495347[/C][C]1524532.33333333[/C][C]-29185.3333333334[/C][/ROW]
[ROW][C]55[/C][C]2918786[/C][C]2969353.16666667[/C][C]-50567.1666666667[/C][/ROW]
[ROW][C]56[/C][C]2775677[/C][C]2667890.5[/C][C]107786.5[/C][/ROW]
[ROW][C]57[/C][C]1407026[/C][C]1380058[/C][C]26968[/C][/ROW]
[ROW][C]58[/C][C]1370199[/C][C]1356217.33333333[/C][C]13981.6666666666[/C][/ROW]
[ROW][C]59[/C][C]964526[/C][C]953886.333333333[/C][C]10639.6666666667[/C][/ROW]
[ROW][C]60[/C][C]850851[/C][C]860443.833333333[/C][C]-9592.83333333334[/C][/ROW]
[ROW][C]61[/C][C]683118[/C][C]663212.666666667[/C][C]19905.3333333334[/C][/ROW]
[ROW][C]62[/C][C]847224[/C][C]886063.5[/C][C]-38839.4999999999[/C][/ROW]
[ROW][C]63[/C][C]1073256[/C][C]1116085[/C][C]-42829[/C][/ROW]
[ROW][C]64[/C][C]1514326[/C][C]1542592.66666667[/C][C]-28266.6666666666[/C][/ROW]
[ROW][C]65[/C][C]1503734[/C][C]1581577.16666667[/C][C]-77843.1666666666[/C][/ROW]
[ROW][C]66[/C][C]1507712[/C][C]1524532.33333333[/C][C]-16820.3333333334[/C][/ROW]
[ROW][C]67[/C][C]2865698[/C][C]2969353.16666667[/C][C]-103655.166666667[/C][/ROW]
[ROW][C]68[/C][C]2788128[/C][C]2667890.5[/C][C]120237.5[/C][/ROW]
[ROW][C]69[/C][C]1391596[/C][C]1380058[/C][C]11538[/C][/ROW]
[ROW][C]70[/C][C]1366378[/C][C]1356217.33333333[/C][C]10160.6666666666[/C][/ROW]
[ROW][C]71[/C][C]946295[/C][C]953886.333333333[/C][C]-7591.33333333332[/C][/ROW]
[ROW][C]72[/C][C]859626[/C][C]860443.833333333[/C][C]-817.833333333343[/C][/ROW]
[/TABLE]
Source: https://freestatistics.org/blog/index.php?pk=155991&T=4

Globally Unique Identifier (entire table): ba.freestatistics.org/blog/index.php?pk=155991&T=4

As an alternative you can also use a QR Code:  

The GUIDs for individual cells are displayed in the table below:

Multiple Linear Regression - Actuals, Interpolation, and Residuals
Time or IndexActualsInterpolationForecastResidualsPrediction Error
1655362663212.666666667-7850.6666666669
2873127886063.5-12936.5
311078971116085-8188.00000000007
415559641542592.6666666713371.3333333331
516711591581577.1666666789581.8333333331
614933081524532.33333333-31224.3333333332
729577962969353.16666667-11557.1666666665
826386912667890.5-29199.4999999995
913056691380058-74388.9999999999
1012804961356217.33333333-75721.3333333332
11921900953886.333333333-31986.3333333334
12867888860443.8333333337444.16666666663
13652586663212.666666667-10626.6666666666
14913831886063.527767.5
1511085441116085-7540.99999999998
1615558271542592.6666666713234.3333333334
1716992831581577.16666667117705.833333333
1815094581524532.33333333-15074.3333333334
1932689752969353.16666667299621.833333333
2024250162667890.5-242874.5
2113127031380058-67355.0000000001
2213654981356217.333333339280.66666666662
23934453953886.333333333-19433.3333333333
24775019860443.833333333-85424.8333333332
25651142663212.666666667-12070.6666666666
26843192886063.5-42871.4999999999
271146766111608530681
2816526011542592.66666667110008.333333333
2914659061581577.16666667-115671.166666667
3016527341524532.33333333128201.666666667
3129223342969353.16666667-47019.1666666667
3227028052667890.534914.4999999998
331458956138005878898
3414103631356217.3333333354145.6666666667
351019279953886.33333333365392.6666666666
36936574860443.83333333376130.1666666667
37708917663212.66666666745704.3333333334
38885295886063.5-768.500000000034
3910996631116085-16422
4015762201542592.6666666733627.3333333334
4114878701581577.16666667-93707.1666666666
4214886351524532.33333333-35897.3333333334
4328825302969353.16666667-86823.1666666667
4426770262667890.59135.4999999998
451404398138005824340
4613443701356217.33333333-11847.3333333334
47936865953886.333333333-17021.3333333333
48872705860443.83333333312261.1666666667
49628151663212.666666667-35061.6666666666
50953712886063.567648.4999999999
511160384111608544299
5214006181542592.66666667-141974.666666667
5316615111581577.1666666779933.8333333333
5414953471524532.33333333-29185.3333333334
5529187862969353.16666667-50567.1666666667
5627756772667890.5107786.5
571407026138005826968
5813701991356217.3333333313981.6666666666
59964526953886.33333333310639.6666666667
60850851860443.833333333-9592.83333333334
61683118663212.66666666719905.3333333334
62847224886063.5-38839.4999999999
6310732561116085-42829
6415143261542592.66666667-28266.6666666666
6515037341581577.16666667-77843.1666666666
6615077121524532.33333333-16820.3333333334
6728656982969353.16666667-103655.166666667
6827881282667890.5120237.5
691391596138005811538
7013663781356217.3333333310160.6666666666
71946295953886.333333333-7591.33333333332
72859626860443.833333333-817.833333333343


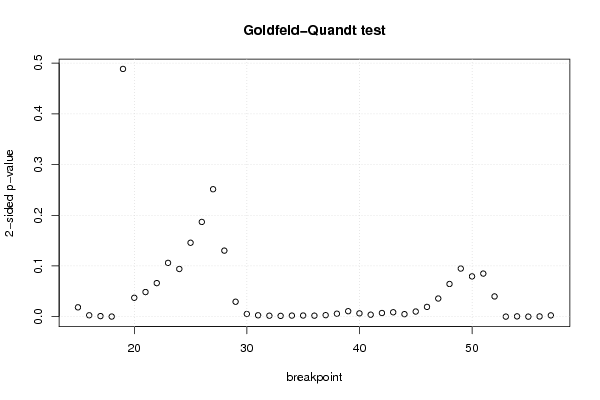
Goldfeld-Quandt test for Heteroskedasticity
p-valuesAlternative Hypothesis
breakpoint indexgreater2-sidedless
150.009253693492135290.01850738698427060.990746306507865
160.001401531247540710.002803062495081430.998598468752459
170.0005817791313738180.001163558262747640.999418220868626
180.0001216784969032080.0002433569938064170.999878321503097
190.755781346139860.488437307720280.24421865386014
200.9813527347586710.03729453048265820.0186472652413291
210.9757048509153870.04859029816922630.0242951490846132
220.9668858265999730.06622834680005480.0331141734000274
230.9469587848683710.1060824302632580.0530412151316288
240.9529754161811730.09404916763765480.0470245838188274
250.9271053858651360.1457892282697270.0728946141348636
260.9065956412150650.1868087175698690.0934043587849347
270.8743387373759160.2513225252481680.125661262624084
280.9348729173554730.1302541652890540.065127082644527
290.9852524498490140.02949510030197210.0147475501509861
300.9973371490900930.005325701819813410.00266285090990671
310.9986138843471580.002772231305683140.00138611565284157
320.9990231456067360.00195370878652770.00097685439326385
330.9991968389430820.001606322113836850.000803161056918425
340.9989171681379930.002165663724013030.00108283186200651
350.9988400621237520.002319875752496860.00115993787624843
360.9989792258630970.002041548273805230.00102077413690262
370.9984883315294830.003023336941033710.00151166847051686
380.997065358236930.005869283526139480.00293464176306974
390.9945775213058980.01084495738820310.00542247869410157
400.9967336988387780.006532602322443540.00326630116122177
410.9980273770052660.00394524598946770.00197262299473385
420.9963577403471380.007284519305724050.00364225965286202
430.9956171891142170.008765621771565360.00438281088578268
440.9974797224572890.005040555085422530.00252027754271126
450.9949108946022850.01017821079543040.00508910539771518
460.9903602310118660.01927953797626770.00963976898813383
470.9820837127406530.03583257451869320.0179162872593466
480.9677455210086830.06450895798263330.0322544789913166
490.9525442165743080.09491156685138460.0474557834256923
500.9602569965778960.07948600684420840.0397430034221042
510.9574945128245970.08501097435080670.0425054871754033
520.9800254466395780.03994910672084420.0199745533604221
530.9999277662514150.000144467497170317.22337485851552e-05
540.9996546465450880.0006907069098239330.000345353454911966
550.9999563055246638.73889506739549e-054.36944753369774e-05
560.999750217761680.0004995644766396210.00024978223831981
570.9986927057666340.002614588466732230.00130729423336612

\begin{tabular}{lllllllll}
\hline
Goldfeld-Quandt test for Heteroskedasticity \tabularnewline
p-values & Alternative Hypothesis \tabularnewline
breakpoint index & greater & 2-sided & less \tabularnewline
15 & 0.00925369349213529 & 0.0185073869842706 & 0.990746306507865 \tabularnewline
16 & 0.00140153124754071 & 0.00280306249508143 & 0.998598468752459 \tabularnewline
17 & 0.000581779131373818 & 0.00116355826274764 & 0.999418220868626 \tabularnewline
18 & 0.000121678496903208 & 0.000243356993806417 & 0.999878321503097 \tabularnewline
19 & 0.75578134613986 & 0.48843730772028 & 0.24421865386014 \tabularnewline
20 & 0.981352734758671 & 0.0372945304826582 & 0.0186472652413291 \tabularnewline
21 & 0.975704850915387 & 0.0485902981692263 & 0.0242951490846132 \tabularnewline
22 & 0.966885826599973 & 0.0662283468000548 & 0.0331141734000274 \tabularnewline
23 & 0.946958784868371 & 0.106082430263258 & 0.0530412151316288 \tabularnewline
24 & 0.952975416181173 & 0.0940491676376548 & 0.0470245838188274 \tabularnewline
25 & 0.927105385865136 & 0.145789228269727 & 0.0728946141348636 \tabularnewline
26 & 0.906595641215065 & 0.186808717569869 & 0.0934043587849347 \tabularnewline
27 & 0.874338737375916 & 0.251322525248168 & 0.125661262624084 \tabularnewline
28 & 0.934872917355473 & 0.130254165289054 & 0.065127082644527 \tabularnewline
29 & 0.985252449849014 & 0.0294951003019721 & 0.0147475501509861 \tabularnewline
30 & 0.997337149090093 & 0.00532570181981341 & 0.00266285090990671 \tabularnewline
31 & 0.998613884347158 & 0.00277223130568314 & 0.00138611565284157 \tabularnewline
32 & 0.999023145606736 & 0.0019537087865277 & 0.00097685439326385 \tabularnewline
33 & 0.999196838943082 & 0.00160632211383685 & 0.000803161056918425 \tabularnewline
34 & 0.998917168137993 & 0.00216566372401303 & 0.00108283186200651 \tabularnewline
35 & 0.998840062123752 & 0.00231987575249686 & 0.00115993787624843 \tabularnewline
36 & 0.998979225863097 & 0.00204154827380523 & 0.00102077413690262 \tabularnewline
37 & 0.998488331529483 & 0.00302333694103371 & 0.00151166847051686 \tabularnewline
38 & 0.99706535823693 & 0.00586928352613948 & 0.00293464176306974 \tabularnewline
39 & 0.994577521305898 & 0.0108449573882031 & 0.00542247869410157 \tabularnewline
40 & 0.996733698838778 & 0.00653260232244354 & 0.00326630116122177 \tabularnewline
41 & 0.998027377005266 & 0.0039452459894677 & 0.00197262299473385 \tabularnewline
42 & 0.996357740347138 & 0.00728451930572405 & 0.00364225965286202 \tabularnewline
43 & 0.995617189114217 & 0.00876562177156536 & 0.00438281088578268 \tabularnewline
44 & 0.997479722457289 & 0.00504055508542253 & 0.00252027754271126 \tabularnewline
45 & 0.994910894602285 & 0.0101782107954304 & 0.00508910539771518 \tabularnewline
46 & 0.990360231011866 & 0.0192795379762677 & 0.00963976898813383 \tabularnewline
47 & 0.982083712740653 & 0.0358325745186932 & 0.0179162872593466 \tabularnewline
48 & 0.967745521008683 & 0.0645089579826333 & 0.0322544789913166 \tabularnewline
49 & 0.952544216574308 & 0.0949115668513846 & 0.0474557834256923 \tabularnewline
50 & 0.960256996577896 & 0.0794860068442084 & 0.0397430034221042 \tabularnewline
51 & 0.957494512824597 & 0.0850109743508067 & 0.0425054871754033 \tabularnewline
52 & 0.980025446639578 & 0.0399491067208442 & 0.0199745533604221 \tabularnewline
53 & 0.999927766251415 & 0.00014446749717031 & 7.22337485851552e-05 \tabularnewline
54 & 0.999654646545088 & 0.000690706909823933 & 0.000345353454911966 \tabularnewline
55 & 0.999956305524663 & 8.73889506739549e-05 & 4.36944753369774e-05 \tabularnewline
56 & 0.99975021776168 & 0.000499564476639621 & 0.00024978223831981 \tabularnewline
57 & 0.998692705766634 & 0.00261458846673223 & 0.00130729423336612 \tabularnewline
\hline
\end{tabular}
%Source: https://freestatistics.org/blog/index.php?pk=155991&T=5

[TABLE]
[ROW][C]Goldfeld-Quandt test for Heteroskedasticity[/C][/ROW]
[ROW][C]p-values[/C][C]Alternative Hypothesis[/C][/ROW]
[ROW][C]breakpoint index[/C][C]greater[/C][C]2-sided[/C][C]less[/C][/ROW]
[ROW][C]15[/C][C]0.00925369349213529[/C][C]0.0185073869842706[/C][C]0.990746306507865[/C][/ROW]
[ROW][C]16[/C][C]0.00140153124754071[/C][C]0.00280306249508143[/C][C]0.998598468752459[/C][/ROW]
[ROW][C]17[/C][C]0.000581779131373818[/C][C]0.00116355826274764[/C][C]0.999418220868626[/C][/ROW]
[ROW][C]18[/C][C]0.000121678496903208[/C][C]0.000243356993806417[/C][C]0.999878321503097[/C][/ROW]
[ROW][C]19[/C][C]0.75578134613986[/C][C]0.48843730772028[/C][C]0.24421865386014[/C][/ROW]
[ROW][C]20[/C][C]0.981352734758671[/C][C]0.0372945304826582[/C][C]0.0186472652413291[/C][/ROW]
[ROW][C]21[/C][C]0.975704850915387[/C][C]0.0485902981692263[/C][C]0.0242951490846132[/C][/ROW]
[ROW][C]22[/C][C]0.966885826599973[/C][C]0.0662283468000548[/C][C]0.0331141734000274[/C][/ROW]
[ROW][C]23[/C][C]0.946958784868371[/C][C]0.106082430263258[/C][C]0.0530412151316288[/C][/ROW]
[ROW][C]24[/C][C]0.952975416181173[/C][C]0.0940491676376548[/C][C]0.0470245838188274[/C][/ROW]
[ROW][C]25[/C][C]0.927105385865136[/C][C]0.145789228269727[/C][C]0.0728946141348636[/C][/ROW]
[ROW][C]26[/C][C]0.906595641215065[/C][C]0.186808717569869[/C][C]0.0934043587849347[/C][/ROW]
[ROW][C]27[/C][C]0.874338737375916[/C][C]0.251322525248168[/C][C]0.125661262624084[/C][/ROW]
[ROW][C]28[/C][C]0.934872917355473[/C][C]0.130254165289054[/C][C]0.065127082644527[/C][/ROW]
[ROW][C]29[/C][C]0.985252449849014[/C][C]0.0294951003019721[/C][C]0.0147475501509861[/C][/ROW]
[ROW][C]30[/C][C]0.997337149090093[/C][C]0.00532570181981341[/C][C]0.00266285090990671[/C][/ROW]
[ROW][C]31[/C][C]0.998613884347158[/C][C]0.00277223130568314[/C][C]0.00138611565284157[/C][/ROW]
[ROW][C]32[/C][C]0.999023145606736[/C][C]0.0019537087865277[/C][C]0.00097685439326385[/C][/ROW]
[ROW][C]33[/C][C]0.999196838943082[/C][C]0.00160632211383685[/C][C]0.000803161056918425[/C][/ROW]
[ROW][C]34[/C][C]0.998917168137993[/C][C]0.00216566372401303[/C][C]0.00108283186200651[/C][/ROW]
[ROW][C]35[/C][C]0.998840062123752[/C][C]0.00231987575249686[/C][C]0.00115993787624843[/C][/ROW]
[ROW][C]36[/C][C]0.998979225863097[/C][C]0.00204154827380523[/C][C]0.00102077413690262[/C][/ROW]
[ROW][C]37[/C][C]0.998488331529483[/C][C]0.00302333694103371[/C][C]0.00151166847051686[/C][/ROW]
[ROW][C]38[/C][C]0.99706535823693[/C][C]0.00586928352613948[/C][C]0.00293464176306974[/C][/ROW]
[ROW][C]39[/C][C]0.994577521305898[/C][C]0.0108449573882031[/C][C]0.00542247869410157[/C][/ROW]
[ROW][C]40[/C][C]0.996733698838778[/C][C]0.00653260232244354[/C][C]0.00326630116122177[/C][/ROW]
[ROW][C]41[/C][C]0.998027377005266[/C][C]0.0039452459894677[/C][C]0.00197262299473385[/C][/ROW]
[ROW][C]42[/C][C]0.996357740347138[/C][C]0.00728451930572405[/C][C]0.00364225965286202[/C][/ROW]
[ROW][C]43[/C][C]0.995617189114217[/C][C]0.00876562177156536[/C][C]0.00438281088578268[/C][/ROW]
[ROW][C]44[/C][C]0.997479722457289[/C][C]0.00504055508542253[/C][C]0.00252027754271126[/C][/ROW]
[ROW][C]45[/C][C]0.994910894602285[/C][C]0.0101782107954304[/C][C]0.00508910539771518[/C][/ROW]
[ROW][C]46[/C][C]0.990360231011866[/C][C]0.0192795379762677[/C][C]0.00963976898813383[/C][/ROW]
[ROW][C]47[/C][C]0.982083712740653[/C][C]0.0358325745186932[/C][C]0.0179162872593466[/C][/ROW]
[ROW][C]48[/C][C]0.967745521008683[/C][C]0.0645089579826333[/C][C]0.0322544789913166[/C][/ROW]
[ROW][C]49[/C][C]0.952544216574308[/C][C]0.0949115668513846[/C][C]0.0474557834256923[/C][/ROW]
[ROW][C]50[/C][C]0.960256996577896[/C][C]0.0794860068442084[/C][C]0.0397430034221042[/C][/ROW]
[ROW][C]51[/C][C]0.957494512824597[/C][C]0.0850109743508067[/C][C]0.0425054871754033[/C][/ROW]
[ROW][C]52[/C][C]0.980025446639578[/C][C]0.0399491067208442[/C][C]0.0199745533604221[/C][/ROW]
[ROW][C]53[/C][C]0.999927766251415[/C][C]0.00014446749717031[/C][C]7.22337485851552e-05[/C][/ROW]
[ROW][C]54[/C][C]0.999654646545088[/C][C]0.000690706909823933[/C][C]0.000345353454911966[/C][/ROW]
[ROW][C]55[/C][C]0.999956305524663[/C][C]8.73889506739549e-05[/C][C]4.36944753369774e-05[/C][/ROW]
[ROW][C]56[/C][C]0.99975021776168[/C][C]0.000499564476639621[/C][C]0.00024978223831981[/C][/ROW]
[ROW][C]57[/C][C]0.998692705766634[/C][C]0.00261458846673223[/C][C]0.00130729423336612[/C][/ROW]
[/TABLE]
Source: https://freestatistics.org/blog/index.php?pk=155991&T=5

Globally Unique Identifier (entire table): ba.freestatistics.org/blog/index.php?pk=155991&T=5

As an alternative you can also use a QR Code:  

The GUIDs for individual cells are displayed in the table below:

Goldfeld-Quandt test for Heteroskedasticity
p-valuesAlternative Hypothesis
breakpoint indexgreater2-sidedless
150.009253693492135290.01850738698427060.990746306507865
160.001401531247540710.002803062495081430.998598468752459
170.0005817791313738180.001163558262747640.999418220868626
180.0001216784969032080.0002433569938064170.999878321503097
190.755781346139860.488437307720280.24421865386014
200.9813527347586710.03729453048265820.0186472652413291
210.9757048509153870.04859029816922630.0242951490846132
220.9668858265999730.06622834680005480.0331141734000274
230.9469587848683710.1060824302632580.0530412151316288
240.9529754161811730.09404916763765480.0470245838188274
250.9271053858651360.1457892282697270.0728946141348636
260.9065956412150650.1868087175698690.0934043587849347
270.8743387373759160.2513225252481680.125661262624084
280.9348729173554730.1302541652890540.065127082644527
290.9852524498490140.02949510030197210.0147475501509861
300.9973371490900930.005325701819813410.00266285090990671
310.9986138843471580.002772231305683140.00138611565284157
320.9990231456067360.00195370878652770.00097685439326385
330.9991968389430820.001606322113836850.000803161056918425
340.9989171681379930.002165663724013030.00108283186200651
350.9988400621237520.002319875752496860.00115993787624843
360.9989792258630970.002041548273805230.00102077413690262
370.9984883315294830.003023336941033710.00151166847051686
380.997065358236930.005869283526139480.00293464176306974
390.9945775213058980.01084495738820310.00542247869410157
400.9967336988387780.006532602322443540.00326630116122177
410.9980273770052660.00394524598946770.00197262299473385
420.9963577403471380.007284519305724050.00364225965286202
430.9956171891142170.008765621771565360.00438281088578268
440.9974797224572890.005040555085422530.00252027754271126
450.9949108946022850.01017821079543040.00508910539771518
460.9903602310118660.01927953797626770.00963976898813383
470.9820837127406530.03583257451869320.0179162872593466
480.9677455210086830.06450895798263330.0322544789913166
490.9525442165743080.09491156685138460.0474557834256923
500.9602569965778960.07948600684420840.0397430034221042
510.9574945128245970.08501097435080670.0425054871754033
520.9800254466395780.03994910672084420.0199745533604221
530.9999277662514150.000144467497170317.22337485851552e-05
540.9996546465450880.0006907069098239330.000345353454911966
550.9999563055246638.73889506739549e-054.36944753369774e-05
560.999750217761680.0004995644766396210.00024978223831981
570.9986927057666340.002614588466732230.00130729423336612


Meta Analysis of Goldfeld-Quandt test for Heteroskedasticity
Description# significant tests% significant testsOK/NOK
1% type I error level220.511627906976744NOK
5% type I error level310.720930232558139NOK
10% type I error level370.86046511627907NOK

\begin{tabular}{lllllllll}
\hline
Meta Analysis of Goldfeld-Quandt test for Heteroskedasticity \tabularnewline
Description & # significant tests & % significant tests & OK/NOK \tabularnewline
1% type I error level & 22 & 0.511627906976744 & NOK \tabularnewline
5% type I error level & 31 & 0.720930232558139 & NOK \tabularnewline
10% type I error level & 37 & 0.86046511627907 & NOK \tabularnewline
\hline
\end{tabular}
%Source: https://freestatistics.org/blog/index.php?pk=155991&T=6

[TABLE]
[ROW][C]Meta Analysis of Goldfeld-Quandt test for Heteroskedasticity[/C][/ROW]
[ROW][C]Description[/C][C]# significant tests[/C][C]% significant tests[/C][C]OK/NOK[/C][/ROW]
[ROW][C]1% type I error level[/C][C]22[/C][C]0.511627906976744[/C][C]NOK[/C][/ROW]
[ROW][C]5% type I error level[/C][C]31[/C][C]0.720930232558139[/C][C]NOK[/C][/ROW]
[ROW][C]10% type I error level[/C][C]37[/C][C]0.86046511627907[/C][C]NOK[/C][/ROW]
[/TABLE]
Source: https://freestatistics.org/blog/index.php?pk=155991&T=6

Globally Unique Identifier (entire table): ba.freestatistics.org/blog/index.php?pk=155991&T=6

As an alternative you can also use a QR Code:  

The GUIDs for individual cells are displayed in the table below:

Meta Analysis of Goldfeld-Quandt test for Heteroskedasticity
Description# significant tests% significant testsOK/NOK
1% type I error level220.511627906976744NOK
5% type I error level310.720930232558139NOK
10% type I error level370.86046511627907NOK


Parameters (Session):
par1 = 1 ; par2 = Include Monthly Dummies ; par3 = No Linear Trend ;
Parameters (R input):
par1 = 1 ; par2 = Include Monthly Dummies ; par3 = No Linear Trend ;
R code (references can be found in the software module):
library(lattice)
library(lmtest)
n25 <- 25 #minimum number of obs. for Goldfeld-Quandt test
par1 <- as.numeric(par1)
x <- t(y)
k <- length(x[1,])
n <- length(x[,1])
x1 <- cbind(x[,par1], x[,1:k!=par1])
mycolnames <- c(colnames(x)[par1], colnames(x)[1:k!=par1])
colnames(x1) <- mycolnames #colnames(x)[par1]
x <- x1
if (par3 == 'First Differences'){
x2 <- array(0, dim=c(n-1,k), dimnames=list(1:(n-1), paste('(1-B)',colnames(x),sep='')))
for (i in 1:n-1) {
for (j in 1:k) {
x2[i,j] <- x[i+1,j] - x[i,j]
}
}
x <- x2
}
if (par2 == 'Include Monthly Dummies'){
x2 <- array(0, dim=c(n,11), dimnames=list(1:n, paste('M', seq(1:11), sep ='')))
for (i in 1:11){
x2[seq(i,n,12),i] <- 1
}
x <- cbind(x, x2)
}
if (par2 == 'Include Quarterly Dummies'){
x2 <- array(0, dim=c(n,3), dimnames=list(1:n, paste('Q', seq(1:3), sep ='')))
for (i in 1:3){
x2[seq(i,n,4),i] <- 1
}
x <- cbind(x, x2)
}
k <- length(x[1,])
if (par3 == 'Linear Trend'){
x <- cbind(x, c(1:n))
colnames(x)[k+1] <- 't'
}
x
k <- length(x[1,])
df <- as.data.frame(x)
(mylm <- lm(df))
(mysum <- summary(mylm))
if (n > n25) {
kp3 <- k + 3
nmkm3 <- n - k - 3
gqarr <- array(NA, dim=c(nmkm3-kp3+1,3))
numgqtests <- 0
numsignificant1 <- 0
numsignificant5 <- 0
numsignificant10 <- 0
for (mypoint in kp3:nmkm3) {
j <- 0
numgqtests <- numgqtests + 1
for (myalt in c('greater', 'two.sided', 'less')) {
j <- j + 1
gqarr[mypoint-kp3+1,j] <- gqtest(mylm, point=mypoint, alternative=myalt)$p.value
}
if (gqarr[mypoint-kp3+1,2] < 0.01) numsignificant1 <- numsignificant1 + 1
if (gqarr[mypoint-kp3+1,2] < 0.05) numsignificant5 <- numsignificant5 + 1
if (gqarr[mypoint-kp3+1,2] < 0.10) numsignificant10 <- numsignificant10 + 1
}
gqarr
}
bitmap(file='test0.png')
plot(x[,1], type='l', main='Actuals and Interpolation', ylab='value of Actuals and Interpolation (dots)', xlab='time or index')
points(x[,1]-mysum$resid)
grid()
dev.off()
bitmap(file='test1.png')
plot(mysum$resid, type='b', pch=19, main='Residuals', ylab='value of Residuals', xlab='time or index')
grid()
dev.off()
bitmap(file='test2.png')
hist(mysum$resid, main='Residual Histogram', xlab='values of Residuals')
grid()
dev.off()
bitmap(file='test3.png')
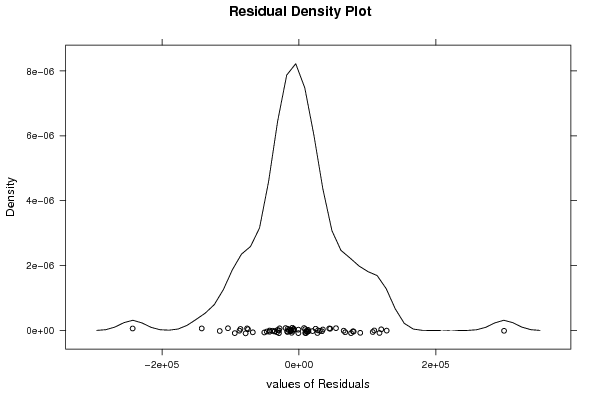
densityplot(~mysum$resid,col='black',main='Residual Density Plot', xlab='values of Residuals')
dev.off()
bitmap(file='test4.png')
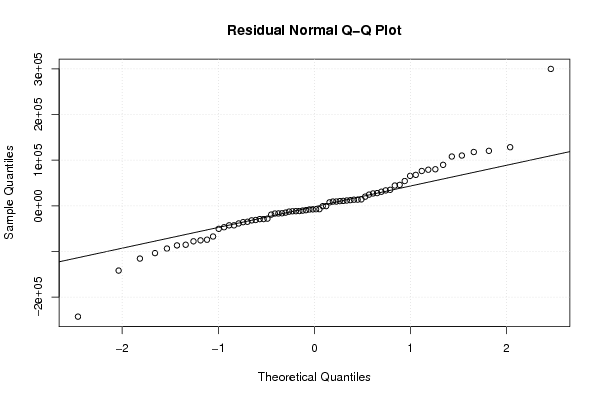
qqnorm(mysum$resid, main='Residual Normal Q-Q Plot')
qqline(mysum$resid)
grid()
dev.off()
(myerror <- as.ts(mysum$resid))
bitmap(file='test5.png')
dum <- cbind(lag(myerror,k=1),myerror)
dum
dum1 <- dum[2:length(myerror),]
dum1
z <- as.data.frame(dum1)
z
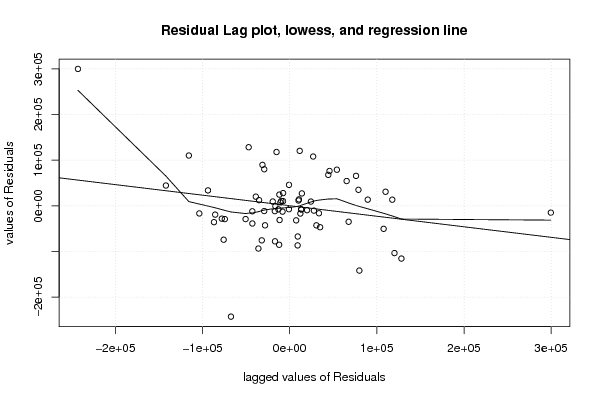
plot(z,main=paste('Residual Lag plot, lowess, and regression line'), ylab='values of Residuals', xlab='lagged values of Residuals')
lines(lowess(z))
abline(lm(z))
grid()
dev.off()
bitmap(file='test6.png')
acf(mysum$resid, lag.max=length(mysum$resid)/2, main='Residual Autocorrelation Function')
grid()
dev.off()
bitmap(file='test7.png')
pacf(mysum$resid, lag.max=length(mysum$resid)/2, main='Residual Partial Autocorrelation Function')
grid()
dev.off()
bitmap(file='test8.png')
opar <- par(mfrow = c(2,2), oma = c(0, 0, 1.1, 0))
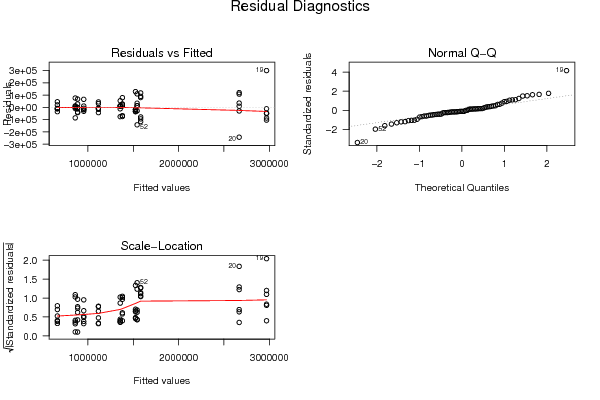
plot(mylm, las = 1, sub='Residual Diagnostics')
par(opar)
dev.off()
if (n > n25) {
bitmap(file='test9.png')
plot(kp3:nmkm3,gqarr[,2], main='Goldfeld-Quandt test',ylab='2-sided p-value',xlab='breakpoint')
grid()
dev.off()
}
load(file='createtable')
a<-table.start()
a<-table.row.start(a)
a<-table.element(a, 'Multiple Linear Regression - Estimated Regression Equation', 1, TRUE)
a<-table.row.end(a)
myeq <- colnames(x)[1]
myeq <- paste(myeq, '[t] = ', sep='')
for (i in 1:k){
if (mysum$coefficients[i,1] > 0) myeq <- paste(myeq, '+', '')
myeq <- paste(myeq, mysum$coefficients[i,1], sep=' ')
if (rownames(mysum$coefficients)[i] != '(Intercept)') {
myeq <- paste(myeq, rownames(mysum$coefficients)[i], sep='')
if (rownames(mysum$coefficients)[i] != 't') myeq <- paste(myeq, '[t]', sep='')
}
}
myeq <- paste(myeq, ' + e[t]')
a<-table.row.start(a)
a<-table.element(a, myeq)
a<-table.row.end(a)
a<-table.end(a)
table.save(a,file='mytable1.tab')
a<-table.start()
a<-table.row.start(a)
a<-table.element(a,hyperlink('ols1.htm','Multiple Linear Regression - Ordinary Least Squares',''), 6, TRUE)
a<-table.row.end(a)
a<-table.row.start(a)
a<-table.element(a,'Variable',header=TRUE)
a<-table.element(a,'Parameter',header=TRUE)
a<-table.element(a,'S.D.',header=TRUE)
a<-table.element(a,'T-STAT
H0: parameter = 0',header=TRUE)
a<-table.element(a,'2-tail p-value',header=TRUE)
a<-table.element(a,'1-tail p-value',header=TRUE)
a<-table.row.end(a)
for (i in 1:k){
a<-table.row.start(a)
a<-table.element(a,rownames(mysum$coefficients)[i],header=TRUE)
a<-table.element(a,mysum$coefficients[i,1])
a<-table.element(a, round(mysum$coefficients[i,2],6))
a<-table.element(a, round(mysum$coefficients[i,3],4))
a<-table.element(a, round(mysum$coefficients[i,4],6))
a<-table.element(a, round(mysum$coefficients[i,4]/2,6))
a<-table.row.end(a)
}
a<-table.end(a)
table.save(a,file='mytable2.tab')
a<-table.start()
a<-table.row.start(a)
a<-table.element(a, 'Multiple Linear Regression - Regression Statistics', 2, TRUE)
a<-table.row.end(a)
a<-table.row.start(a)
a<-table.element(a, 'Multiple R',1,TRUE)
a<-table.element(a, sqrt(mysum$r.squared))
a<-table.row.end(a)
a<-table.row.start(a)
a<-table.element(a, 'R-squared',1,TRUE)
a<-table.element(a, mysum$r.squared)
a<-table.row.end(a)
a<-table.row.start(a)
a<-table.element(a, 'Adjusted R-squared',1,TRUE)
a<-table.element(a, mysum$adj.r.squared)
a<-table.row.end(a)
a<-table.row.start(a)
a<-table.element(a, 'F-TEST (value)',1,TRUE)
a<-table.element(a, mysum$fstatistic[1])
a<-table.row.end(a)
a<-table.row.start(a)
a<-table.element(a, 'F-TEST (DF numerator)',1,TRUE)
a<-table.element(a, mysum$fstatistic[2])
a<-table.row.end(a)
a<-table.row.start(a)
a<-table.element(a, 'F-TEST (DF denominator)',1,TRUE)
a<-table.element(a, mysum$fstatistic[3])
a<-table.row.end(a)
a<-table.row.start(a)
a<-table.element(a, 'p-value',1,TRUE)
a<-table.element(a, 1-pf(mysum$fstatistic[1],mysum$fstatistic[2],mysum$fstatistic[3]))
a<-table.row.end(a)
a<-table.row.start(a)
a<-table.element(a, 'Multiple Linear Regression - Residual Statistics', 2, TRUE)
a<-table.row.end(a)
a<-table.row.start(a)
a<-table.element(a, 'Residual Standard Deviation',1,TRUE)
a<-table.element(a, mysum$sigma)
a<-table.row.end(a)
a<-table.row.start(a)
a<-table.element(a, 'Sum Squared Residuals',1,TRUE)
a<-table.element(a, sum(myerror*myerror))
a<-table.row.end(a)
a<-table.end(a)
table.save(a,file='mytable3.tab')
a<-table.start()
a<-table.row.start(a)
a<-table.element(a, 'Multiple Linear Regression - Actuals, Interpolation, and Residuals', 4, TRUE)
a<-table.row.end(a)
a<-table.row.start(a)
a<-table.element(a, 'Time or Index', 1, TRUE)
a<-table.element(a, 'Actuals', 1, TRUE)
a<-table.element(a, 'Interpolation
Forecast', 1, TRUE)
a<-table.element(a, 'Residuals
Prediction Error', 1, TRUE)
a<-table.row.end(a)
for (i in 1:n) {
a<-table.row.start(a)
a<-table.element(a,i, 1, TRUE)
a<-table.element(a,x[i])
a<-table.element(a,x[i]-mysum$resid[i])
a<-table.element(a,mysum$resid[i])
a<-table.row.end(a)
}
a<-table.end(a)
table.save(a,file='mytable4.tab')
if (n > n25) {
a<-table.start()
a<-table.row.start(a)
a<-table.element(a,'Goldfeld-Quandt test for Heteroskedasticity',4,TRUE)
a<-table.row.end(a)
a<-table.row.start(a)
a<-table.element(a,'p-values',header=TRUE)
a<-table.element(a,'Alternative Hypothesis',3,header=TRUE)
a<-table.row.end(a)
a<-table.row.start(a)
a<-table.element(a,'breakpoint index',header=TRUE)
a<-table.element(a,'greater',header=TRUE)
a<-table.element(a,'2-sided',header=TRUE)
a<-table.element(a,'less',header=TRUE)
a<-table.row.end(a)
for (mypoint in kp3:nmkm3) {
a<-table.row.start(a)
a<-table.element(a,mypoint,header=TRUE)
a<-table.element(a,gqarr[mypoint-kp3+1,1])
a<-table.element(a,gqarr[mypoint-kp3+1,2])
a<-table.element(a,gqarr[mypoint-kp3+1,3])
a<-table.row.end(a)
}
a<-table.end(a)
table.save(a,file='mytable5.tab')
a<-table.start()
a<-table.row.start(a)
a<-table.element(a,'Meta Analysis of Goldfeld-Quandt test for Heteroskedasticity',4,TRUE)
a<-table.row.end(a)
a<-table.row.start(a)
a<-table.element(a,'Description',header=TRUE)
a<-table.element(a,'# significant tests',header=TRUE)
a<-table.element(a,'% significant tests',header=TRUE)
a<-table.element(a,'OK/NOK',header=TRUE)
a<-table.row.end(a)
a<-table.row.start(a)
a<-table.element(a,'1% type I error level',header=TRUE)
a<-table.element(a,numsignificant1)
a<-table.element(a,numsignificant1/numgqtests)
if (numsignificant1/numgqtests < 0.01) dum <- 'OK' else dum <- 'NOK'
a<-table.element(a,dum)
a<-table.row.end(a)
a<-table.row.start(a)
a<-table.element(a,'5% type I error level',header=TRUE)
a<-table.element(a,numsignificant5)
a<-table.element(a,numsignificant5/numgqtests)
if (numsignificant5/numgqtests < 0.05) dum <- 'OK' else dum <- 'NOK'
a<-table.element(a,dum)
a<-table.row.end(a)
a<-table.row.start(a)
a<-table.element(a,'10% type I error level',header=TRUE)
a<-table.element(a,numsignificant10)
a<-table.element(a,numsignificant10/numgqtests)
if (numsignificant10/numgqtests < 0.1) dum <- 'OK' else dum <- 'NOK'
a<-table.element(a,dum)
a<-table.row.end(a)
a<-table.end(a)
table.save(a,file='mytable6.tab')
}