Free Statistics
of Irreproducible Research!
Description of Statistical Computation | |||||||||||||||||||||||||||||||||||||||||
|---|---|---|---|---|---|---|---|---|---|---|---|---|---|---|---|---|---|---|---|---|---|---|---|---|---|---|---|---|---|---|---|---|---|---|---|---|---|---|---|---|---|
| Author's title | |||||||||||||||||||||||||||||||||||||||||
| Author | *The author of this computation has been verified* | ||||||||||||||||||||||||||||||||||||||||
| R Software Module | rwasp_univariatedataseries.wasp | ||||||||||||||||||||||||||||||||||||||||
| Title produced by software | Univariate Data Series | ||||||||||||||||||||||||||||||||||||||||
| Date of computation | Wed, 07 Dec 2011 14:09:44 -0500 | ||||||||||||||||||||||||||||||||||||||||
| Cite this page as follows | Statistical Computations at FreeStatistics.org, Office for Research Development and Education, URL https://freestatistics.org/blog/index.php?v=date/2011/Dec/07/t13232850438cdnr3pla1ehvqo.htm/, Retrieved Wed, 01 May 2024 04:19:12 +0000 | ||||||||||||||||||||||||||||||||||||||||
| Statistical Computations at FreeStatistics.org, Office for Research Development and Education, URL https://freestatistics.org/blog/index.php?pk=152622, Retrieved Wed, 01 May 2024 04:19:12 +0000 | |||||||||||||||||||||||||||||||||||||||||
| QR Codes: | |||||||||||||||||||||||||||||||||||||||||
|
| |||||||||||||||||||||||||||||||||||||||||
| Original text written by user: | |||||||||||||||||||||||||||||||||||||||||
| IsPrivate? | No (this computation is public) | ||||||||||||||||||||||||||||||||||||||||
| User-defined keywords | |||||||||||||||||||||||||||||||||||||||||
| Estimated Impact | 118 | ||||||||||||||||||||||||||||||||||||||||
Tree of Dependent Computations | |||||||||||||||||||||||||||||||||||||||||
| Family? (F = Feedback message, R = changed R code, M = changed R Module, P = changed Parameters, D = changed Data) | |||||||||||||||||||||||||||||||||||||||||
| - [(Partial) Autocorrelation Function] [Autocorrelation f...] [2011-12-01 11:43:29] [bc54fcbdb4f9c071218969745a8ec94b] - RMP [Spectral Analysis] [Spectral Analysis] [2011-12-01 11:58:37] [bc54fcbdb4f9c071218969745a8ec94b] - R P [Spectral Analysis] [Spectral Analysis] [2011-12-01 12:01:59] [bc54fcbdb4f9c071218969745a8ec94b] - P [Spectral Analysis] [Spectral Analysis...] [2011-12-01 12:05:16] [bc54fcbdb4f9c071218969745a8ec94b] - RMP [ARIMA Backward Selection] [ARIMA backward se...] [2011-12-01 12:40:37] [bc54fcbdb4f9c071218969745a8ec94b] - RMPD [Univariate Data Series] [Plot & Describe D...] [2011-12-07 19:09:44] [f59ea4acf51788e47c4ec521df29536b] [Current] | |||||||||||||||||||||||||||||||||||||||||
| Feedback Forum | |||||||||||||||||||||||||||||||||||||||||
Post a new message | |||||||||||||||||||||||||||||||||||||||||
Dataset | |||||||||||||||||||||||||||||||||||||||||
| Dataseries X: | |||||||||||||||||||||||||||||||||||||||||
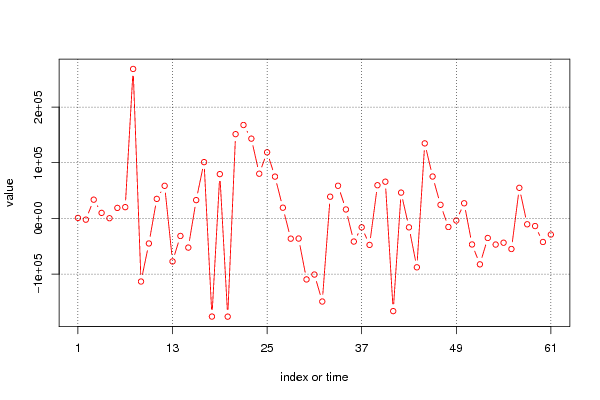
867,8875 -2250,2807 33618,3570 9954,3447 354,1917 18882,4064 20229,4311 268402,4162 -113346,9261 -45016,3942 35069,8614 58531,0957 -77256,3771 -31473,5946 -52391,0075 32854,9848 101107,7328 -176275,9604 79531,8844 -176414,2516 151290,5795 167731,5942 143237,1224 80251,9665 118735,7263 75035,8259 19198,3085 -36364,5639 -36170,5787 -109567,3951 -100783,3361 -149267,4039 38947,3511 58613,0601 16074,4602 -41563,0049 -15970,5965 -47563,9548 59595,3577 65897,8405 -166489,2832 46312,3270 -15952,8723 -87780,6524 134744,1727 75232,8122 24408,7558 -15406,1403 -3766,7535 27197,2240 -46777,2890 -82472,8213 -35154,7185 -46946,8700 -43641,5365 -54920,7085 54905,4038 -10509,5841 -13706,8047 -42347,6088 -28990,4688 | |||||||||||||||||||||||||||||||||||||||||
Tables (Output of Computation) | |||||||||||||||||||||||||||||||||||||||||
| |||||||||||||||||||||||||||||||||||||||||
Figures (Output of Computation) | |||||||||||||||||||||||||||||||||||||||||
Input Parameters & R Code | |||||||||||||||||||||||||||||||||||||||||
| Parameters (Session): | |||||||||||||||||||||||||||||||||||||||||
| par4 = 12 ; | |||||||||||||||||||||||||||||||||||||||||
| Parameters (R input): | |||||||||||||||||||||||||||||||||||||||||
| par1 = ; par2 = ; par3 = ; par4 = 12 ; | |||||||||||||||||||||||||||||||||||||||||
| R code (references can be found in the software module): | |||||||||||||||||||||||||||||||||||||||||
if (par4 != 'No season') { | |||||||||||||||||||||||||||||||||||||||||