Free Statistics

of Irreproducible Research!

Author's title

Author*The author of this computation has been verified*
R Software Modulerwasp_autocorrelation.wasp
Title produced by software(Partial) Autocorrelation Function
Date of computationMon, 05 Dec 2011 09:10:10 -0500
Cite this page as followsStatistical Computations at FreeStatistics.org, Office for Research Development and Education, URL https://freestatistics.org/blog/index.php?v=date/2011/Dec/05/t1323094226rdgbt03zs9x1h2y.htm/, Retrieved Wed, 24 Apr 2024 14:23:31 +0000
Statistical Computations at FreeStatistics.org, Office for Research Development and Education, URL https://freestatistics.org/blog/index.php?pk=150924, Retrieved Wed, 24 Apr 2024 14:23:31 +0000
QR Codes:

Original text written by user:
IsPrivate?No (this computation is public)
User-defined keywords
Estimated Impact111
Family? (F = Feedback message, R = changed R code, M = changed R Module, P = changed Parameters, D = changed Data)
F     [Univariate Data Series] [HPC Retail Sales] [2008-03-02 15:42:48] [74be16979710d4c4e7c6647856088456]
- RMPD  [Univariate Data Series] [] [2011-11-25 14:57:13] [493236dcc414c5f9e1823f06b33a5ad6]
- RMPD      [(Partial) Autocorrelation Function] [] [2011-12-05 14:10:10] [75a32e1bc492240bc1028714aca23077] [Current]
Feedback Forum

Post a new message
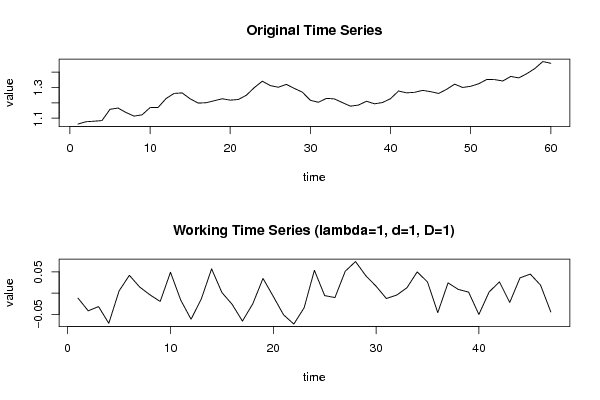
Dataseries X:
1.0622
1.0773
1.0807
1.0848
1.1582
1.1663
1.1372
1.1139
1.1222
1.1692
1.1702
1.2286
1.2613
1.2646
1.2262
1.1985
1.2007
1.2138
1.2266
1.2176
1.2218
1.249
1.2991
1.3408
1.3119
1.3014
1.3201
1.2938
1.2694
1.2165
1.2037
1.2292
1.2256
1.2015
1.1786
1.1856
1.2103
1.1938
1.202
1.2271
1.277
1.265
1.2684
1.2811
1.2727
1.2611
1.2881
1.3213
1.2999
1.3074
1.3242
1.3516
1.3511
1.3419
1.3716
1.3622
1.3896
1.4227
1.4684
1.457


Summary of computational transaction
Raw Inputview raw input (R code)
Raw Outputview raw output of R engine
Computing time2 seconds
R Server'Gertrude Mary Cox' @ cox.wessa.net

\begin{tabular}{lllllllll}
\hline
Summary of computational transaction \tabularnewline
Raw Input & view raw input (R code)  \tabularnewline
Raw Output & view raw output of R engine  \tabularnewline
Computing time & 2 seconds \tabularnewline
R Server & 'Gertrude Mary Cox' @ cox.wessa.net \tabularnewline
\hline
\end{tabular}
%Source: https://freestatistics.org/blog/index.php?pk=150924&T=0

[TABLE]
[ROW][C]Summary of computational transaction[/C][/ROW]
[ROW][C]Raw Input[/C][C]view raw input (R code) [/C][/ROW]
[ROW][C]Raw Output[/C][C]view raw output of R engine [/C][/ROW]
[ROW][C]Computing time[/C][C]2 seconds[/C][/ROW]
[ROW][C]R Server[/C][C]'Gertrude Mary Cox' @ cox.wessa.net[/C][/ROW]
[/TABLE]
Source: https://freestatistics.org/blog/index.php?pk=150924&T=0

Globally Unique Identifier (entire table): ba.freestatistics.org/blog/index.php?pk=150924&T=0

As an alternative you can also use a QR Code:  

The GUIDs for individual cells are displayed in the table below:

Summary of computational transaction
Raw Inputview raw input (R code)
Raw Outputview raw output of R engine
Computing time2 seconds
R Server'Gertrude Mary Cox' @ cox.wessa.net


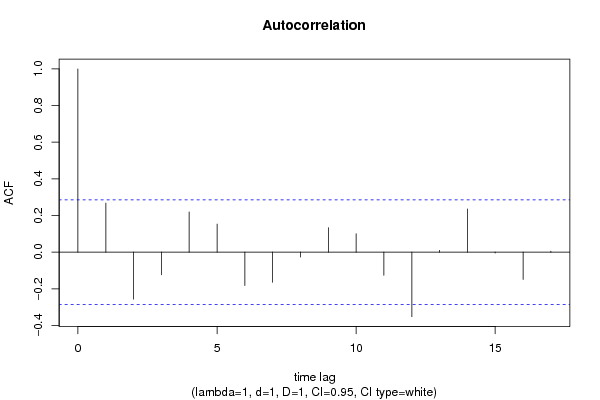
Autocorrelation Function
Time lag kACF(k)T-STATP-value
10.267371.8330.036571
2-0.256588-1.75910.042537
3-0.123197-0.84460.201308
40.2193511.50380.069662
50.1527441.04720.150191
6-0.18232-1.24990.108759
7-0.164122-1.12520.133117
8-0.026741-0.18330.427666
90.1332630.91360.182794
100.1007470.69070.246581
11-0.126103-0.86450.195846
12-0.352306-2.41530.009832
130.0095120.06520.474141
140.2351531.61210.056815
15-0.005037-0.03450.4863
16-0.148724-1.01960.156569
170.0044410.03040.48792

\begin{tabular}{lllllllll}
\hline
Autocorrelation Function \tabularnewline
Time lag k & ACF(k) & T-STAT & P-value \tabularnewline
1 & 0.26737 & 1.833 & 0.036571 \tabularnewline
2 & -0.256588 & -1.7591 & 0.042537 \tabularnewline
3 & -0.123197 & -0.8446 & 0.201308 \tabularnewline
4 & 0.219351 & 1.5038 & 0.069662 \tabularnewline
5 & 0.152744 & 1.0472 & 0.150191 \tabularnewline
6 & -0.18232 & -1.2499 & 0.108759 \tabularnewline
7 & -0.164122 & -1.1252 & 0.133117 \tabularnewline
8 & -0.026741 & -0.1833 & 0.427666 \tabularnewline
9 & 0.133263 & 0.9136 & 0.182794 \tabularnewline
10 & 0.100747 & 0.6907 & 0.246581 \tabularnewline
11 & -0.126103 & -0.8645 & 0.195846 \tabularnewline
12 & -0.352306 & -2.4153 & 0.009832 \tabularnewline
13 & 0.009512 & 0.0652 & 0.474141 \tabularnewline
14 & 0.235153 & 1.6121 & 0.056815 \tabularnewline
15 & -0.005037 & -0.0345 & 0.4863 \tabularnewline
16 & -0.148724 & -1.0196 & 0.156569 \tabularnewline
17 & 0.004441 & 0.0304 & 0.48792 \tabularnewline
\hline
\end{tabular}
%Source: https://freestatistics.org/blog/index.php?pk=150924&T=1

[TABLE]
[ROW][C]Autocorrelation Function[/C][/ROW]
[ROW][C]Time lag k[/C][C]ACF(k)[/C][C]T-STAT[/C][C]P-value[/C][/ROW]
[ROW][C]1[/C][C]0.26737[/C][C]1.833[/C][C]0.036571[/C][/ROW]
[ROW][C]2[/C][C]-0.256588[/C][C]-1.7591[/C][C]0.042537[/C][/ROW]
[ROW][C]3[/C][C]-0.123197[/C][C]-0.8446[/C][C]0.201308[/C][/ROW]
[ROW][C]4[/C][C]0.219351[/C][C]1.5038[/C][C]0.069662[/C][/ROW]
[ROW][C]5[/C][C]0.152744[/C][C]1.0472[/C][C]0.150191[/C][/ROW]
[ROW][C]6[/C][C]-0.18232[/C][C]-1.2499[/C][C]0.108759[/C][/ROW]
[ROW][C]7[/C][C]-0.164122[/C][C]-1.1252[/C][C]0.133117[/C][/ROW]
[ROW][C]8[/C][C]-0.026741[/C][C]-0.1833[/C][C]0.427666[/C][/ROW]
[ROW][C]9[/C][C]0.133263[/C][C]0.9136[/C][C]0.182794[/C][/ROW]
[ROW][C]10[/C][C]0.100747[/C][C]0.6907[/C][C]0.246581[/C][/ROW]
[ROW][C]11[/C][C]-0.126103[/C][C]-0.8645[/C][C]0.195846[/C][/ROW]
[ROW][C]12[/C][C]-0.352306[/C][C]-2.4153[/C][C]0.009832[/C][/ROW]
[ROW][C]13[/C][C]0.009512[/C][C]0.0652[/C][C]0.474141[/C][/ROW]
[ROW][C]14[/C][C]0.235153[/C][C]1.6121[/C][C]0.056815[/C][/ROW]
[ROW][C]15[/C][C]-0.005037[/C][C]-0.0345[/C][C]0.4863[/C][/ROW]
[ROW][C]16[/C][C]-0.148724[/C][C]-1.0196[/C][C]0.156569[/C][/ROW]
[ROW][C]17[/C][C]0.004441[/C][C]0.0304[/C][C]0.48792[/C][/ROW]
[/TABLE]
Source: https://freestatistics.org/blog/index.php?pk=150924&T=1

Globally Unique Identifier (entire table): ba.freestatistics.org/blog/index.php?pk=150924&T=1

As an alternative you can also use a QR Code:  

The GUIDs for individual cells are displayed in the table below:

Autocorrelation Function
Time lag kACF(k)T-STATP-value
10.267371.8330.036571
2-0.256588-1.75910.042537
3-0.123197-0.84460.201308
40.2193511.50380.069662
50.1527441.04720.150191
6-0.18232-1.24990.108759
7-0.164122-1.12520.133117
8-0.026741-0.18330.427666
90.1332630.91360.182794
100.1007470.69070.246581
11-0.126103-0.86450.195846
12-0.352306-2.41530.009832
130.0095120.06520.474141
140.2351531.61210.056815
15-0.005037-0.03450.4863
16-0.148724-1.01960.156569
170.0044410.03040.48792


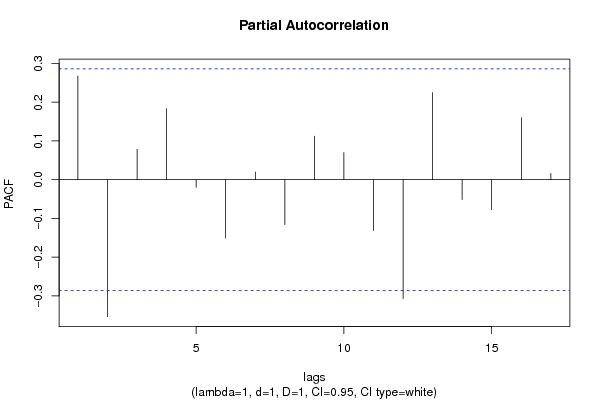
Partial Autocorrelation Function
Time lag kPACF(k)T-STATP-value
10.267371.8330.036571
2-0.353333-2.42230.009665
30.0789050.54090.29555
40.1836211.25880.107153
5-0.019457-0.13340.447228
6-0.15061-1.03250.153554
70.0196040.13440.446831
8-0.115621-0.79270.21598
90.1121170.76860.222978
100.070010.480.316739
11-0.131007-0.89810.186845
12-0.306421-2.10070.020529
130.224821.54130.064977
14-0.050979-0.34950.36414
15-0.077179-0.52910.299608
160.1597161.0950.139557
170.0160330.10990.456473

\begin{tabular}{lllllllll}
\hline
Partial Autocorrelation Function \tabularnewline
Time lag k & PACF(k) & T-STAT & P-value \tabularnewline
1 & 0.26737 & 1.833 & 0.036571 \tabularnewline
2 & -0.353333 & -2.4223 & 0.009665 \tabularnewline
3 & 0.078905 & 0.5409 & 0.29555 \tabularnewline
4 & 0.183621 & 1.2588 & 0.107153 \tabularnewline
5 & -0.019457 & -0.1334 & 0.447228 \tabularnewline
6 & -0.15061 & -1.0325 & 0.153554 \tabularnewline
7 & 0.019604 & 0.1344 & 0.446831 \tabularnewline
8 & -0.115621 & -0.7927 & 0.21598 \tabularnewline
9 & 0.112117 & 0.7686 & 0.222978 \tabularnewline
10 & 0.07001 & 0.48 & 0.316739 \tabularnewline
11 & -0.131007 & -0.8981 & 0.186845 \tabularnewline
12 & -0.306421 & -2.1007 & 0.020529 \tabularnewline
13 & 0.22482 & 1.5413 & 0.064977 \tabularnewline
14 & -0.050979 & -0.3495 & 0.36414 \tabularnewline
15 & -0.077179 & -0.5291 & 0.299608 \tabularnewline
16 & 0.159716 & 1.095 & 0.139557 \tabularnewline
17 & 0.016033 & 0.1099 & 0.456473 \tabularnewline
\hline
\end{tabular}
%Source: https://freestatistics.org/blog/index.php?pk=150924&T=2

[TABLE]
[ROW][C]Partial Autocorrelation Function[/C][/ROW]
[ROW][C]Time lag k[/C][C]PACF(k)[/C][C]T-STAT[/C][C]P-value[/C][/ROW]
[ROW][C]1[/C][C]0.26737[/C][C]1.833[/C][C]0.036571[/C][/ROW]
[ROW][C]2[/C][C]-0.353333[/C][C]-2.4223[/C][C]0.009665[/C][/ROW]
[ROW][C]3[/C][C]0.078905[/C][C]0.5409[/C][C]0.29555[/C][/ROW]
[ROW][C]4[/C][C]0.183621[/C][C]1.2588[/C][C]0.107153[/C][/ROW]
[ROW][C]5[/C][C]-0.019457[/C][C]-0.1334[/C][C]0.447228[/C][/ROW]
[ROW][C]6[/C][C]-0.15061[/C][C]-1.0325[/C][C]0.153554[/C][/ROW]
[ROW][C]7[/C][C]0.019604[/C][C]0.1344[/C][C]0.446831[/C][/ROW]
[ROW][C]8[/C][C]-0.115621[/C][C]-0.7927[/C][C]0.21598[/C][/ROW]
[ROW][C]9[/C][C]0.112117[/C][C]0.7686[/C][C]0.222978[/C][/ROW]
[ROW][C]10[/C][C]0.07001[/C][C]0.48[/C][C]0.316739[/C][/ROW]
[ROW][C]11[/C][C]-0.131007[/C][C]-0.8981[/C][C]0.186845[/C][/ROW]
[ROW][C]12[/C][C]-0.306421[/C][C]-2.1007[/C][C]0.020529[/C][/ROW]
[ROW][C]13[/C][C]0.22482[/C][C]1.5413[/C][C]0.064977[/C][/ROW]
[ROW][C]14[/C][C]-0.050979[/C][C]-0.3495[/C][C]0.36414[/C][/ROW]
[ROW][C]15[/C][C]-0.077179[/C][C]-0.5291[/C][C]0.299608[/C][/ROW]
[ROW][C]16[/C][C]0.159716[/C][C]1.095[/C][C]0.139557[/C][/ROW]
[ROW][C]17[/C][C]0.016033[/C][C]0.1099[/C][C]0.456473[/C][/ROW]
[/TABLE]
Source: https://freestatistics.org/blog/index.php?pk=150924&T=2

Globally Unique Identifier (entire table): ba.freestatistics.org/blog/index.php?pk=150924&T=2

As an alternative you can also use a QR Code:  

The GUIDs for individual cells are displayed in the table below:

Partial Autocorrelation Function
Time lag kPACF(k)T-STATP-value
10.267371.8330.036571
2-0.353333-2.42230.009665
30.0789050.54090.29555
40.1836211.25880.107153
5-0.019457-0.13340.447228
6-0.15061-1.03250.153554
70.0196040.13440.446831
8-0.115621-0.79270.21598
90.1121170.76860.222978
100.070010.480.316739
11-0.131007-0.89810.186845
12-0.306421-2.10070.020529
130.224821.54130.064977
14-0.050979-0.34950.36414
15-0.077179-0.52910.299608
160.1597161.0950.139557
170.0160330.10990.456473


Parameters (Session):
par1 = additive ; par2 = 12 ;
Parameters (R input):
par1 = Default ; par2 = 1 ; par3 = 1 ; par4 = 1 ; par5 = 12 ; par6 = White Noise ; par7 = 0.95 ; par8 = ;
R code (references can be found in the software module):
if (par1 == 'Default') {
par1 = 10*log10(length(x))
} else {
par1 <- as.numeric(par1)
}
par2 <- as.numeric(par2)
par3 <- as.numeric(par3)
par4 <- as.numeric(par4)
par5 <- as.numeric(par5)
if (par6 == 'White Noise') par6 <- 'white' else par6 <- 'ma'
par7 <- as.numeric(par7)
if (par8 != '') par8 <- as.numeric(par8)
ox <- x
if (par8 == '') {
if (par2 == 0) {
x <- log(x)
} else {
x <- (x ^ par2 - 1) / par2
}
} else {
x <- log(x,base=par8)
}
if (par3 > 0) x <- diff(x,lag=1,difference=par3)
if (par4 > 0) x <- diff(x,lag=par5,difference=par4)
bitmap(file='picts.png')
op <- par(mfrow=c(2,1))
plot(ox,type='l',main='Original Time Series',xlab='time',ylab='value')
if (par8=='') {
mytitle <- paste('Working Time Series (lambda=',par2,', d=',par3,', D=',par4,')',sep='')
mysub <- paste('(lambda=',par2,', d=',par3,', D=',par4,', CI=', par7, ', CI type=',par6,')',sep='')
} else {
mytitle <- paste('Working Time Series (base=',par8,', d=',par3,', D=',par4,')',sep='')
mysub <- paste('(base=',par8,', d=',par3,', D=',par4,', CI=', par7, ', CI type=',par6,')',sep='')
}
plot(x,type='l', main=mytitle,xlab='time',ylab='value')
par(op)
dev.off()
bitmap(file='pic1.png')
racf <- acf(x, par1, main='Autocorrelation', xlab='time lag', ylab='ACF', ci.type=par6, ci=par7, sub=mysub)
dev.off()
bitmap(file='pic2.png')
rpacf <- pacf(x,par1,main='Partial Autocorrelation',xlab='lags',ylab='PACF',sub=mysub)
dev.off()
(myacf <- c(racf$acf))
(mypacf <- c(rpacf$acf))
lengthx <- length(x)
sqrtn <- sqrt(lengthx)
load(file='createtable')
a<-table.start()
a<-table.row.start(a)
a<-table.element(a,'Autocorrelation Function',4,TRUE)
a<-table.row.end(a)
a<-table.row.start(a)
a<-table.element(a,'Time lag k',header=TRUE)
a<-table.element(a,hyperlink('basics.htm','ACF(k)','click here for more information about the Autocorrelation Function'),header=TRUE)
a<-table.element(a,'T-STAT',header=TRUE)
a<-table.element(a,'P-value',header=TRUE)
a<-table.row.end(a)
for (i in 2:(par1+1)) {
a<-table.row.start(a)
a<-table.element(a,i-1,header=TRUE)
a<-table.element(a,round(myacf[i],6))
mytstat <- myacf[i]*sqrtn
a<-table.element(a,round(mytstat,4))
a<-table.element(a,round(1-pt(abs(mytstat),lengthx),6))
a<-table.row.end(a)
}
a<-table.end(a)
table.save(a,file='mytable.tab')
a<-table.start()
a<-table.row.start(a)
a<-table.element(a,'Partial Autocorrelation Function',4,TRUE)
a<-table.row.end(a)
a<-table.row.start(a)
a<-table.element(a,'Time lag k',header=TRUE)
a<-table.element(a,hyperlink('basics.htm','PACF(k)','click here for more information about the Partial Autocorrelation Function'),header=TRUE)
a<-table.element(a,'T-STAT',header=TRUE)
a<-table.element(a,'P-value',header=TRUE)
a<-table.row.end(a)
for (i in 1:par1) {
a<-table.row.start(a)
a<-table.element(a,i,header=TRUE)
a<-table.element(a,round(mypacf[i],6))
mytstat <- mypacf[i]*sqrtn
a<-table.element(a,round(mytstat,4))
a<-table.element(a,round(1-pt(abs(mytstat),lengthx),6))
a<-table.row.end(a)
}
a<-table.end(a)
table.save(a,file='mytable1.tab')