Frequentietabel aantal motorfietsen 2009 | ||||||||||||||||||||||||||||||||||||||||||||||||||||||||||||||||||||||||||||||||||
| *Unverified author* | ||||||||||||||||||||||||||||||||||||||||||||||||||||||||||||||||||||||||||||||||||
| R Software Module: /rwasp_histogram.wasp (opens new window with default values) | ||||||||||||||||||||||||||||||||||||||||||||||||||||||||||||||||||||||||||||||||||
| Title produced by software: Histogram | ||||||||||||||||||||||||||||||||||||||||||||||||||||||||||||||||||||||||||||||||||
| Date of computation: Tue, 28 Sep 2010 14:40:23 +0000 | ||||||||||||||||||||||||||||||||||||||||||||||||||||||||||||||||||||||||||||||||||
| Cite this page as follows: | ||||||||||||||||||||||||||||||||||||||||||||||||||||||||||||||||||||||||||||||||||
| Statistical Computations at FreeStatistics.org, Office for Research Development and Education, URL http://www.freestatistics.org/blog/date/2010/Sep/28/t1285685009w3ix95zj1pjcc6u.htm/, Retrieved Tue, 28 Sep 2010 16:43:29 +0200 | ||||||||||||||||||||||||||||||||||||||||||||||||||||||||||||||||||||||||||||||||||
| BibTeX entries for LaTeX users: | ||||||||||||||||||||||||||||||||||||||||||||||||||||||||||||||||||||||||||||||||||
@Manual{KEY,
    author = {{YOUR NAME}},
    publisher = {Office for Research Development and Education},
    title = {Statistical Computations at FreeStatistics.org, URL http://www.freestatistics.org/blog/date/2010/Sep/28/t1285685009w3ix95zj1pjcc6u.htm/},
    year = {2010},
}
@Manual{R,
    title = {R: A Language and Environment for Statistical Computing},
    author = {{R Development Core Team}},
    organization = {R Foundation for Statistical Computing},
    address = {Vienna, Austria},
    year = {2010},
    note = {{ISBN} 3-900051-07-0},
    url = {http://www.R-project.org},
}
| ||||||||||||||||||||||||||||||||||||||||||||||||||||||||||||||||||||||||||||||||||
| Original text written by user: | ||||||||||||||||||||||||||||||||||||||||||||||||||||||||||||||||||||||||||||||||||
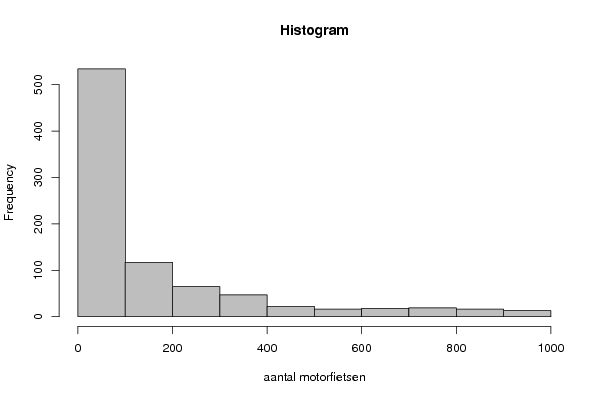
| Deze cijfers geven het aantal motorfietsen per merk en model aan op de Nederlandse wegen op 31 oktober 2009 | ||||||||||||||||||||||||||||||||||||||||||||||||||||||||||||||||||||||||||||||||||
| IsPrivate? | ||||||||||||||||||||||||||||||||||||||||||||||||||||||||||||||||||||||||||||||||||
| No (this computation is public) | ||||||||||||||||||||||||||||||||||||||||||||||||||||||||||||||||||||||||||||||||||
| User-defined keywords: | ||||||||||||||||||||||||||||||||||||||||||||||||||||||||||||||||||||||||||||||||||
| KDGP1W1 | ||||||||||||||||||||||||||||||||||||||||||||||||||||||||||||||||||||||||||||||||||
| Dataseries X: | ||||||||||||||||||||||||||||||||||||||||||||||||||||||||||||||||||||||||||||||||||
| » Textbox « » Textfile « » CSV « | ||||||||||||||||||||||||||||||||||||||||||||||||||||||||||||||||||||||||||||||||||
| 86 944 155 88 306 8 2 152 43 32 236 1 782 4 732 132 2.028 24 33 100 237 278 127 36 1 24 45 6 682 2 15 1 15 54 73 12 8 2 47 10 102 13 49 110 7 2 28 2 1 18 2 4 1 2 2 31 1 1 19 2 14 6.841 352 947 464 265 177 1.565 204 295 91 187 332 25 71 9 100 1 358 695 893 1.756 1.250 2.185 797 690 738 262 1.357 452 135 34 98 1.642 304 2.245 729 447 51 482 444 1.206 1.120 290 103 1.339 843 1.432 2.680 1.082 2.443 1.040 240 2.691 679 94 3.998 366 2.083 162 193 210 235 319 910 15 4 1.872 1 632 65 88 126 20 168 2.082 1.449 386 52 3 1.116 113 91 68 796 341 275 514 48 28 135 192 249 975 2 52 154 20 76 90 39 60 73 110 172 98 2 142 30 207 62 188 24 2 4 39 2 42 5 71 368 11 68 2 49 1 7 81 121 17 17 60 319 21 84 866 358 1.604 33 256 203 103 260 1.776 106 102 463 452 239 352 11 2.244 38 157 664 129 656 15 18 1.077 99 279 etc... | ||||||||||||||||||||||||||||||||||||||||||||||||||||||||||||||||||||||||||||||||||
| Output produced by software: | ||||||||||||||||||||||||||||||||||||||||||||||||||||||||||||||||||||||||||||||||||
| ||||||||||||||||||||||||||||||||||||||||||||||||||||||||||||||||||||||||||||||||||
| Charts produced by software: | ||||||||||||||||||||||||||||||||||||||||||||||||||||||||||||||||||||||||||||||||||
| ||||||||||||||||||||||||||||||||||||||||||||||||||||||||||||||||||||||||||||||||||
| Parameters (Session): | ||||||||||||||||||||||||||||||||||||||||||||||||||||||||||||||||||||||||||||||||||
| par2 = grey ; par3 = FALSE ; par4 = Unknown ; | ||||||||||||||||||||||||||||||||||||||||||||||||||||||||||||||||||||||||||||||||||
| Parameters (R input): | ||||||||||||||||||||||||||||||||||||||||||||||||||||||||||||||||||||||||||||||||||
| par2 = grey ; par3 = FALSE ; par4 = Unknown ; | ||||||||||||||||||||||||||||||||||||||||||||||||||||||||||||||||||||||||||||||||||
| R code (references can be found in the software module): | ||||||||||||||||||||||||||||||||||||||||||||||||||||||||||||||||||||||||||||||||||
| par1 <- as.numeric(par1)
if (par3 == 'TRUE') par3 <- TRUE if (par3 == 'FALSE') par3 <- FALSE if (par4 == 'Unknown') par1 <- as.numeric(par1) if (par4 == 'Interval/Ratio') par1 <- as.numeric(par1) if (par4 == '3-point Likert') par1 <- c(1:3 - 0.5, 3.5) if (par4 == '4-point Likert') par1 <- c(1:4 - 0.5, 4.5) if (par4 == '5-point Likert') par1 <- c(1:5 - 0.5, 5.5) if (par4 == '6-point Likert') par1 <- c(1:6 - 0.5, 6.5) if (par4 == '7-point Likert') par1 <- c(1:7 - 0.5, 7.5) if (par4 == '8-point Likert') par1 <- c(1:8 - 0.5, 8.5) if (par4 == '9-point Likert') par1 <- c(1:9 - 0.5, 9.5) if (par4 == '10-point Likert') par1 <- c(1:10 - 0.5, 10.5) bitmap(file='test1.png') if(is.numeric(x[1])) { if (is.na(par1)) { myhist<-hist(x,col=par2,main=main,xlab=xlab,right=par3) } else { if (par1 < 0) par1 <- 3 if (par1 > 50) par1 <- 50 myhist<-hist(x,breaks=par1,col=par2,main=main,xlab=xlab,right=par3) } } else { plot(mytab <- table(x),col=par2,main='Frequency Plot',xlab=xlab,ylab='Absolute Frequency') } dev.off() if(is.numeric(x[1])) { myhist n <- length(x) load(file='createtable') a<-table.start() a<-table.row.start(a) a<-table.element(a,hyperlink('http://www.xycoon.com/histogram.htm','Frequency Table (Histogram)',''),6,TRUE) a<-table.row.end(a) a<-table.row.start(a) a<-table.element(a,'Bins',header=TRUE) a<-table.element(a,'Midpoint',header=TRUE) a<-table.element(a,'Abs. Frequency',header=TRUE) a<-table.element(a,'Rel. Frequency',header=TRUE) a<-table.element(a,'Cumul. Rel. Freq.',header=TRUE) a<-table.element(a,'Density',header=TRUE) a<-table.row.end(a) crf <- 0 if (par3 == FALSE) mybracket <- '[' else mybracket <- ']' mynumrows <- (length(myhist$breaks)-1) for (i in 1:mynumrows) { a<-table.row.start(a) if (i == 1) dum <- paste('[',myhist$breaks[i],sep='') else dum <- paste(mybracket,myhist$breaks[i],sep='') dum <- paste(dum,myhist$breaks[i+1],sep=',') if (i==mynumrows) dum <- paste(dum,']',sep='') else dum <- paste(dum,mybracket,sep='') a<-table.element(a,dum,header=TRUE) a<-table.element(a,myhist$mids[i]) a<-table.element(a,myhist$counts[i]) rf <- myhist$counts[i]/n crf <- crf + rf a<-table.element(a,round(rf,6)) a<-table.element(a,round(crf,6)) a<-table.element(a,round(myhist$density[i],6)) a<-table.row.end(a) } a<-table.end(a) table.save(a,file='mytable.tab') } else { mytab reltab <- mytab / sum(mytab) n <- length(mytab) load(file='createtable') a<-table.start() a<-table.row.start(a) a<-table.element(a,'Frequency Table (Categorical Data)',3,TRUE) a<-table.row.end(a) a<-table.row.start(a) a<-table.element(a,'Category',header=TRUE) a<-table.element(a,'Abs. Frequency',header=TRUE) a<-table.element(a,'Rel. Frequency',header=TRUE) a<-table.row.end(a) for (i in 1:n) { a<-table.row.start(a) a<-table.element(a,labels(mytab)$x[i],header=TRUE) a<-table.element(a,mytab[i]) a<-table.element(a,round(reltab[i],4)) a<-table.row.end(a) } a<-table.end(a) table.save(a,file='mytable1.tab') } | ||||||||||||||||||||||||||||||||||||||||||||||||||||||||||||||||||||||||||||||||||
Copyright

This work is licensed under a
Creative Commons Attribution-Noncommercial-Share Alike 3.0 License.
Software written by Ed van Stee & Patrick Wessa
Disclaimer
Information provided on this web site is provided "AS IS" without warranty of any kind, either express or implied, including, without limitation, warranties of merchantability, fitness for a particular purpose, and noninfringement. We use reasonable efforts to include accurate and timely information and periodically update the information, and software without notice. However, we make no warranties or representations as to the accuracy or completeness of such information (or software), and we assume no liability or responsibility for errors or omissions in the content of this web site, or any software bugs in online applications. Your use of this web site is AT YOUR OWN RISK. Under no circumstances and under no legal theory shall we be liable to you or any other person for any direct, indirect, special, incidental, exemplary, or consequential damages arising from your access to, or use of, this web site.
Privacy Policy
We may request personal information to be submitted to our servers in order to be able to:
- personalize online software applications according to your needs
- enforce strict security rules with respect to the data that you upload (e.g. statistical data)
- manage user sessions of online applications
- alert you about important changes or upgrades in resources or applications
We NEVER allow other companies to directly offer registered users information about their products and services. Banner references and hyperlinks of third parties NEVER contain any personal data of the visitor.
We do NOT sell, nor transmit by any means, personal information, nor statistical data series uploaded by you to third parties.
We carefully protect your data from loss, misuse, alteration,
and destruction. However, at any time, and under any circumstance you
are solely responsible for managing your passwords, and keeping them
secret.
We store a unique ANONYMOUS USER ID in the form of a small 'Cookie' on your computer. This allows us to track your progress when using this website which is necessary to create state-dependent features. The cookie is used for NO OTHER PURPOSE. At any time you may opt to disallow cookies from this website - this will not affect other features of this website.
We examine cookies that are used by third-parties (banner and online ads) very closely: abuse from third-parties automatically results in termination of the advertising contract without refund. We have very good reason to believe that the cookies that are produced by third parties (banner ads) do NOT cause any privacy or security risk.
FreeStatistics.org is safe. There is no need to download any software to use the applications and services contained in this website. Hence, your system's security is not compromised by their use, and your personal data - other than data you submit in the account application form, and the user-agent information that is transmitted by your browser - is never transmitted to our servers.
As a general rule, we do not log on-line behavior of individuals (other than normal logging of webserver 'hits'). However, in cases of abuse, hacking, unauthorized access, Denial of Service attacks, illegal copying, hotlinking, non-compliance with international webstandards (such as robots.txt), or any other harmful behavior, our system engineers are empowered to log, track, identify, publish, and ban misbehaving individuals - even if this leads to ban entire blocks of IP addresses, or disclosing user's identity.