Free Statistics
of Irreproducible Research!
Description of Statistical Computation | |||||||||||||||||||||||||||||||||||||||||||||||||||||||||||||||
|---|---|---|---|---|---|---|---|---|---|---|---|---|---|---|---|---|---|---|---|---|---|---|---|---|---|---|---|---|---|---|---|---|---|---|---|---|---|---|---|---|---|---|---|---|---|---|---|---|---|---|---|---|---|---|---|---|---|---|---|---|---|---|---|
| Author's title | |||||||||||||||||||||||||||||||||||||||||||||||||||||||||||||||
| Author | *The author of this computation has been verified* | ||||||||||||||||||||||||||||||||||||||||||||||||||||||||||||||
| R Software Module | rwasp_histogram.wasp | ||||||||||||||||||||||||||||||||||||||||||||||||||||||||||||||
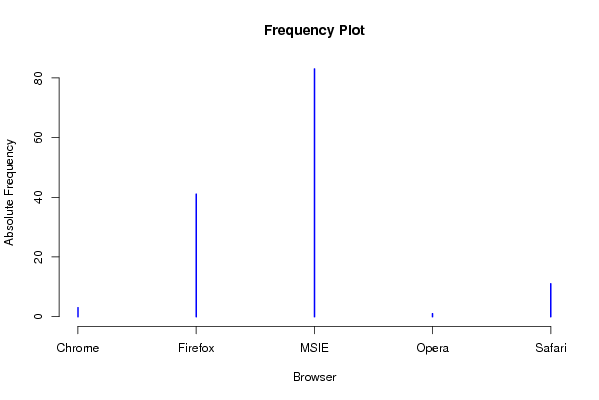
| Title produced by software | Histogram | ||||||||||||||||||||||||||||||||||||||||||||||||||||||||||||||
| Date of computation | Sat, 25 Sep 2010 09:09:15 +0000 | ||||||||||||||||||||||||||||||||||||||||||||||||||||||||||||||
| Cite this page as follows | Statistical Computations at FreeStatistics.org, Office for Research Development and Education, URL https://freestatistics.org/blog/index.php?v=date/2010/Sep/25/t1285405702bgdewsvmq7od3e6.htm/, Retrieved Tue, 30 Dec 2025 13:33:38 +0000 | ||||||||||||||||||||||||||||||||||||||||||||||||||||||||||||||
| Statistical Computations at FreeStatistics.org, Office for Research Development and Education, URL https://freestatistics.org/blog/index.php?pk=79531, Retrieved Tue, 30 Dec 2025 13:33:38 +0000 | |||||||||||||||||||||||||||||||||||||||||||||||||||||||||||||||
| QR Codes: | |||||||||||||||||||||||||||||||||||||||||||||||||||||||||||||||
|
| |||||||||||||||||||||||||||||||||||||||||||||||||||||||||||||||
| Original text written by user: | |||||||||||||||||||||||||||||||||||||||||||||||||||||||||||||||
| IsPrivate? | No (this computation is public) | ||||||||||||||||||||||||||||||||||||||||||||||||||||||||||||||
| User-defined keywords | |||||||||||||||||||||||||||||||||||||||||||||||||||||||||||||||
| Estimated Impact | 1483 | ||||||||||||||||||||||||||||||||||||||||||||||||||||||||||||||
Tree of Dependent Computations | |||||||||||||||||||||||||||||||||||||||||||||||||||||||||||||||
| Family? (F = Feedback message, R = changed R code, M = changed R Module, P = changed Parameters, D = changed Data) | |||||||||||||||||||||||||||||||||||||||||||||||||||||||||||||||
| F [Histogram] [Frequency Plot (C...] [2010-09-25 09:09:15] [d76b387543b13b5e3afd8ff9e5fdc89f] [Current] - D [Histogram] [] [2010-09-28 18:13:17] [5bde1d72e0f93bf2556649a8170282e1] - [Histogram] [frequency plot] [2010-09-28 18:38:33] [5bde1d72e0f93bf2556649a8170282e1] - D [Histogram] [Task 1 - Frequenc...] [2010-09-28 19:05:02] [97ad38b1c3b35a5feca8b85f7bc7b3ff] - D [Histogram] [Frequency Plot] [2010-09-28 20:23:26] [c2a9e95daa10045f9fd6252038bcb219] - [Histogram] [task 1] [2010-09-29 12:53:56] [c4580079d5d2b3f0ba412f27cdc441be] - D [Histogram] [Frequency Plot] [2010-09-29 17:35:30] [2960375a246cc0628590c95c4038a43c] - RMPD [Mean versus Median] [] [2010-09-30 08:10:25] [049b50ae610f671f7417ed8e2d1295c1] - [Histogram] [] [2010-09-30 08:44:14] [049b50ae610f671f7417ed8e2d1295c1] - D [Histogram] [workshop 1 - task 1] [2010-09-30 11:53:14] [ec7b4b7cc1a30b20be5ec01cdf2adbbd] - D [Histogram] [] [2010-09-30 12:00:50] [ec7b4b7cc1a30b20be5ec01cdf2adbbd] F [Histogram] [frequency plot] [2010-10-04 17:45:18] [ec7b4b7cc1a30b20be5ec01cdf2adbbd] - D [Histogram] [] [2010-09-30 12:43:11] [049b50ae610f671f7417ed8e2d1295c1] - D [Histogram] [Workshop 1 - Task 1] [2010-09-30 13:31:46] [26379b86c25fbf0febe6a7a428e65173] F D [Histogram] [Frequency Plot - ...] [2010-10-01 08:23:40] [4a7069087cf9e0eda253aeed7d8c30d6] - D [Histogram] [opdracht 1] [2010-10-01 08:38:29] [814f53995537cd15c528d8efbf1cf544] - R D [Histogram] [] [2014-10-02 13:54:22] [74be16979710d4c4e7c6647856088456] - RM [Histogram] [] [2014-10-02 13:55:24] [74be16979710d4c4e7c6647856088456] - RM [Histogram] [] [2014-10-02 14:05:31] [74be16979710d4c4e7c6647856088456] F D [Histogram] [Frequency Plot OS] [2010-10-01 08:33:14] [c7506ced21a6c0dca45d37c8a93c80e0] - R [Histogram] [Task 1: Frequency...] [2010-10-01 08:42:21] [48146708a479232c43a8f6e52fbf83b4] - D [Histogram] [Frequency plot oe...] [2010-10-01 08:41:21] [033eb2749a430605d9b2be7c4aac4a0c] F D [Histogram] [Oefening 1:Freque...] [2010-10-02 17:06:08] [033eb2749a430605d9b2be7c4aac4a0c] F D [Histogram] [Task 1: Frequency...] [2010-10-01 09:07:55] [48146708a479232c43a8f6e52fbf83b4] F [Histogram] [Frequency plot] [2010-10-01 09:07:55] [13c73ac943380855a1c72833078e44d2] - [Histogram] [Frequency Plot Op...] [2010-10-01 09:30:07] [aeb27d5c05332f2e597ad139ee63fbe4] F D [Histogram] [Frequency Plot Op...] [2010-10-01 09:45:19] [8d9f18e662152c17fca28c551e1f193f] - [Histogram] [Frequency Plot] [2010-10-01 10:01:21] [74be16979710d4c4e7c6647856088456] F D [Histogram] [Task 1 - Frequenc...] [2010-10-01 10:37:37] [97ad38b1c3b35a5feca8b85f7bc7b3ff] - RMPD [Stem-and-leaf Plot] [Stem-and Leaf Plot] [2011-12-09 13:29:51] [3deae35ae8526e36953f595ad65f3a1f] - R PD [Histogram] [Histogram] [2011-12-09 13:33:00] [3deae35ae8526e36953f595ad65f3a1f] - RMPD [Central Tendency] [Central Tendency] [2011-12-09 13:33:45] [3deae35ae8526e36953f595ad65f3a1f] - RMPD [Variability] [Variability] [2011-12-09 13:34:36] [3deae35ae8526e36953f595ad65f3a1f] - RMPD [Percentiles] [Percentiles] [2011-12-09 13:35:24] [3deae35ae8526e36953f595ad65f3a1f] - RMPD [Notched Boxplots] [Notched Boxplots] [2011-12-09 13:37:40] [3deae35ae8526e36953f595ad65f3a1f] - RMPD [Mean versus Median] [Mean vs Median] [2011-12-09 13:42:21] [3deae35ae8526e36953f595ad65f3a1f] - D [Histogram] [Frequency Plot (B...] [2010-10-01 10:56:58] [62f7c80c4d96454bbd2b2b026ea9aad9] - D [Histogram] [Frequency Plot Op...] [2010-10-01 11:48:32] [aeb27d5c05332f2e597ad139ee63fbe4] - [Histogram] [Frequency plot fo...] [2010-10-01 11:55:13] [9894f466352df31a128e82ec8d720241] - D [Histogram] [] [2010-10-01 12:06:16] [9894f466352df31a128e82ec8d720241] - R PD [Histogram] [frequency plot] [2010-10-01 12:07:36] [0175b38674e1402e67841c9c82e4a5a3] F [Histogram] [Task 1] [2010-10-01 12:05:58] [c289bfbb56808c5d93a0f55b5d39f5bd] - [Histogram] [Task 1] [2010-10-01 12:07:00] [9f32078fdcdc094ca748857d5ebdb3de] - D [Histogram] [Frequency plot fo...] [2010-10-01 12:14:09] [9894f466352df31a128e82ec8d720241] F D [Histogram] [Frequency plot fo...] [2010-10-01 12:14:09] [9894f466352df31a128e82ec8d720241] F [Histogram] [Task 1] [2010-10-01 12:07:44] [39c51da0be01189e8a44eb69e891b7a1] - RMPD [Stem-and-leaf Plot] [Stem and leaf plot] [2010-12-10 09:40:59] [39c51da0be01189e8a44eb69e891b7a1] - R PD [Histogram] [Histogram] [2010-12-10 10:18:40] [39c51da0be01189e8a44eb69e891b7a1] - R D [Histogram] [Histogram] [2010-12-10 10:31:17] [39c51da0be01189e8a44eb69e891b7a1] [Truncated] | |||||||||||||||||||||||||||||||||||||||||||||||||||||||||||||||
| Feedback Forum | |||||||||||||||||||||||||||||||||||||||||||||||||||||||||||||||
Post a new message | |||||||||||||||||||||||||||||||||||||||||||||||||||||||||||||||
Dataset | |||||||||||||||||||||||||||||||||||||||||||||||||||||||||||||||
| Dataseries X: | |||||||||||||||||||||||||||||||||||||||||||||||||||||||||||||||
'Firefox' 'MSIE' 'MSIE' 'MSIE' 'MSIE' 'Firefox' 'Firefox' 'MSIE' 'Chrome' 'Firefox' 'Firefox' 'MSIE' 'MSIE' 'MSIE' 'MSIE' 'MSIE' 'Firefox' 'MSIE' 'Firefox' 'Firefox' 'MSIE' 'Firefox' 'Firefox' 'MSIE' 'MSIE' 'Firefox' 'Firefox' 'Safari' 'MSIE' 'Firefox' 'MSIE' 'MSIE' 'MSIE' 'Firefox' 'MSIE' 'MSIE' 'Firefox' 'MSIE' 'MSIE' 'MSIE' 'Firefox' 'MSIE' 'MSIE' 'Firefox' 'Opera' 'Firefox' 'MSIE' 'MSIE' 'MSIE' 'Firefox' 'Firefox' 'Safari' 'Firefox' 'Firefox' 'MSIE' 'MSIE' 'MSIE' 'Firefox' 'Safari' 'MSIE' 'MSIE' 'MSIE' 'MSIE' 'Firefox' 'MSIE' 'Chrome' 'MSIE' 'Firefox' 'Safari' 'Safari' 'Firefox' 'MSIE' 'MSIE' 'Firefox' 'MSIE' 'MSIE' 'MSIE' 'MSIE' 'Firefox' 'MSIE' 'MSIE' 'MSIE' 'MSIE' 'Firefox' 'MSIE' 'Firefox' 'Safari' 'Firefox' 'MSIE' 'MSIE' 'MSIE' 'MSIE' 'MSIE' 'MSIE' 'MSIE' 'Safari' 'Firefox' 'MSIE' 'Firefox' 'MSIE' 'MSIE' 'MSIE' 'MSIE' 'MSIE' 'Firefox' 'MSIE' 'Firefox' 'MSIE' 'MSIE' 'MSIE' 'Firefox' 'MSIE' 'MSIE' 'MSIE' 'Safari' 'MSIE' 'Firefox' 'Firefox' 'MSIE' 'Safari' 'Safari' 'Firefox' 'MSIE' 'MSIE' 'MSIE' 'MSIE' 'Chrome' 'MSIE' 'Firefox' 'MSIE' 'MSIE' 'MSIE' 'MSIE' 'Firefox' 'Safari' 'MSIE' 'MSIE' 'MSIE' 'MSIE' | |||||||||||||||||||||||||||||||||||||||||||||||||||||||||||||||
Tables (Output of Computation) | |||||||||||||||||||||||||||||||||||||||||||||||||||||||||||||||
| |||||||||||||||||||||||||||||||||||||||||||||||||||||||||||||||
Figures (Output of Computation) | |||||||||||||||||||||||||||||||||||||||||||||||||||||||||||||||
Input Parameters & R Code | |||||||||||||||||||||||||||||||||||||||||||||||||||||||||||||||
| Parameters (Session): | |||||||||||||||||||||||||||||||||||||||||||||||||||||||||||||||
| par2 = blue ; par3 = FALSE ; par4 = Unknown ; | |||||||||||||||||||||||||||||||||||||||||||||||||||||||||||||||
| Parameters (R input): | |||||||||||||||||||||||||||||||||||||||||||||||||||||||||||||||
| par1 = ; par2 = blue ; par3 = FALSE ; par4 = Unknown ; | |||||||||||||||||||||||||||||||||||||||||||||||||||||||||||||||
| R code (references can be found in the software module): | |||||||||||||||||||||||||||||||||||||||||||||||||||||||||||||||
par1 <- as.numeric(par1) | |||||||||||||||||||||||||||||||||||||||||||||||||||||||||||||||