Free Statistics
of Irreproducible Research!
Description of Statistical Computation | |||||||||||||||||||||||||||||||||||||||||||||||||||||||||||||||||||||||||||||||||||||||||||||||||||||||||||||||||||||||||||||||||||||||||||||||||||||||||||||||||||||||||||||||
|---|---|---|---|---|---|---|---|---|---|---|---|---|---|---|---|---|---|---|---|---|---|---|---|---|---|---|---|---|---|---|---|---|---|---|---|---|---|---|---|---|---|---|---|---|---|---|---|---|---|---|---|---|---|---|---|---|---|---|---|---|---|---|---|---|---|---|---|---|---|---|---|---|---|---|---|---|---|---|---|---|---|---|---|---|---|---|---|---|---|---|---|---|---|---|---|---|---|---|---|---|---|---|---|---|---|---|---|---|---|---|---|---|---|---|---|---|---|---|---|---|---|---|---|---|---|---|---|---|---|---|---|---|---|---|---|---|---|---|---|---|---|---|---|---|---|---|---|---|---|---|---|---|---|---|---|---|---|---|---|---|---|---|---|---|---|---|---|---|---|---|---|---|---|---|---|
| Author's title | |||||||||||||||||||||||||||||||||||||||||||||||||||||||||||||||||||||||||||||||||||||||||||||||||||||||||||||||||||||||||||||||||||||||||||||||||||||||||||||||||||||||||||||||
| Author | *The author of this computation has been verified* | ||||||||||||||||||||||||||||||||||||||||||||||||||||||||||||||||||||||||||||||||||||||||||||||||||||||||||||||||||||||||||||||||||||||||||||||||||||||||||||||||||||||||||||||
| R Software Module | rwasp_One Factor ANOVA.wasp | ||||||||||||||||||||||||||||||||||||||||||||||||||||||||||||||||||||||||||||||||||||||||||||||||||||||||||||||||||||||||||||||||||||||||||||||||||||||||||||||||||||||||||||||
| Title produced by software | One-Way-Between-Groups ANOVA- Free Statistics Software (Calculator) | ||||||||||||||||||||||||||||||||||||||||||||||||||||||||||||||||||||||||||||||||||||||||||||||||||||||||||||||||||||||||||||||||||||||||||||||||||||||||||||||||||||||||||||||
| Date of computation | Fri, 29 Oct 2010 13:36:42 +0000 | ||||||||||||||||||||||||||||||||||||||||||||||||||||||||||||||||||||||||||||||||||||||||||||||||||||||||||||||||||||||||||||||||||||||||||||||||||||||||||||||||||||||||||||||
| Cite this page as follows | Statistical Computations at FreeStatistics.org, Office for Research Development and Education, URL https://freestatistics.org/blog/index.php?v=date/2010/Oct/29/t1288359306shjdebwaiu5vvm0.htm/, Retrieved Sun, 28 Apr 2024 10:29:19 +0000 | ||||||||||||||||||||||||||||||||||||||||||||||||||||||||||||||||||||||||||||||||||||||||||||||||||||||||||||||||||||||||||||||||||||||||||||||||||||||||||||||||||||||||||||||
| Statistical Computations at FreeStatistics.org, Office for Research Development and Education, URL https://freestatistics.org/blog/index.php?pk=90100, Retrieved Sun, 28 Apr 2024 10:29:19 +0000 | |||||||||||||||||||||||||||||||||||||||||||||||||||||||||||||||||||||||||||||||||||||||||||||||||||||||||||||||||||||||||||||||||||||||||||||||||||||||||||||||||||||||||||||||
| QR Codes: | |||||||||||||||||||||||||||||||||||||||||||||||||||||||||||||||||||||||||||||||||||||||||||||||||||||||||||||||||||||||||||||||||||||||||||||||||||||||||||||||||||||||||||||||
|
| |||||||||||||||||||||||||||||||||||||||||||||||||||||||||||||||||||||||||||||||||||||||||||||||||||||||||||||||||||||||||||||||||||||||||||||||||||||||||||||||||||||||||||||||
| Original text written by user: | |||||||||||||||||||||||||||||||||||||||||||||||||||||||||||||||||||||||||||||||||||||||||||||||||||||||||||||||||||||||||||||||||||||||||||||||||||||||||||||||||||||||||||||||
| IsPrivate? | No (this computation is public) | ||||||||||||||||||||||||||||||||||||||||||||||||||||||||||||||||||||||||||||||||||||||||||||||||||||||||||||||||||||||||||||||||||||||||||||||||||||||||||||||||||||||||||||||
| User-defined keywords | |||||||||||||||||||||||||||||||||||||||||||||||||||||||||||||||||||||||||||||||||||||||||||||||||||||||||||||||||||||||||||||||||||||||||||||||||||||||||||||||||||||||||||||||
| Estimated Impact | 219 | ||||||||||||||||||||||||||||||||||||||||||||||||||||||||||||||||||||||||||||||||||||||||||||||||||||||||||||||||||||||||||||||||||||||||||||||||||||||||||||||||||||||||||||||
Tree of Dependent Computations | |||||||||||||||||||||||||||||||||||||||||||||||||||||||||||||||||||||||||||||||||||||||||||||||||||||||||||||||||||||||||||||||||||||||||||||||||||||||||||||||||||||||||||||||
| Family? (F = Feedback message, R = changed R code, M = changed R Module, P = changed Parameters, D = changed Data) | |||||||||||||||||||||||||||||||||||||||||||||||||||||||||||||||||||||||||||||||||||||||||||||||||||||||||||||||||||||||||||||||||||||||||||||||||||||||||||||||||||||||||||||||
| - [One-Way-Between-Groups ANOVA- Free Statistics Software (Calculator)] [Workshop 5 - Ques...] [2010-10-29 13:26:30] [1429a1a14191a86916b95357f6de790b] - P [One-Way-Between-Groups ANOVA- Free Statistics Software (Calculator)] [Workshop 5 - Ques...] [2010-10-29 13:36:42] [e192c8164fa91adb027f71579ac0a49a] [Current] - PD [One-Way-Between-Groups ANOVA- Free Statistics Software (Calculator)] [vraag 6 korte ter...] [2010-10-30 15:30:16] [65eb19f81eab2b6e672eafaed2a27190] - PD [One-Way-Between-Groups ANOVA- Free Statistics Software (Calculator)] [WS5 vraag 7 korte...] [2010-10-30 15:36:22] [65eb19f81eab2b6e672eafaed2a27190] - PD [One-Way-Between-Groups ANOVA- Free Statistics Software (Calculator)] [WS5 vraag 7 lange...] [2010-10-30 15:57:31] [65eb19f81eab2b6e672eafaed2a27190] - RMPD [Two-Way ANOVA] [WS5 vraag 8] [2010-10-30 16:00:47] [65eb19f81eab2b6e672eafaed2a27190] - PD [One-Way-Between-Groups ANOVA- Free Statistics Software (Calculator)] [vraag 6 lange ter...] [2010-10-30 15:32:47] [65eb19f81eab2b6e672eafaed2a27190] - P [One-Way-Between-Groups ANOVA- Free Statistics Software (Calculator)] [workshop 5.1 ques...] [2010-11-01 13:58:40] [6ff9fb24bdca608d2f4f1f9db3f6445e] F PD [One-Way-Between-Groups ANOVA- Free Statistics Software (Calculator)] [Short Term (1-way...] [2010-11-02 14:59:48] [abf4ff90b26c6b37be4a30063b404639] F PD [One-Way-Between-Groups ANOVA- Free Statistics Software (Calculator)] [Long Term] [2010-11-02 15:04:54] [abf4ff90b26c6b37be4a30063b404639] - R [One-Way-Between-Groups ANOVA- Free Statistics Software (Calculator)] [Question 6 (korte...] [2010-11-02 22:33:22] [b20a509e36241371274681d9edf773da] - [One-Way-Between-Groups ANOVA- Free Statistics Software (Calculator)] [WS5 question 6] [2011-10-26 17:30:44] [3dd791303389e75e672968b227170a72] - [One-Way-Between-Groups ANOVA- Free Statistics Software (Calculator)] [WS 5 Question 6] [2011-11-08 16:32:24] [ae1339cb5a7cf28362d01e7220b4a16c] - D [One-Way-Between-Groups ANOVA- Free Statistics Software (Calculator)] [WS5 Question 6 Long] [2011-11-08 16:36:46] [ae1339cb5a7cf28362d01e7220b4a16c] - D [One-Way-Between-Groups ANOVA- Free Statistics Software (Calculator)] [WS5 Question 7 Short] [2011-11-08 16:42:37] [ae1339cb5a7cf28362d01e7220b4a16c] - D [One-Way-Between-Groups ANOVA- Free Statistics Software (Calculator)] [WS5 Question 7 Long] [2011-11-08 16:44:49] [ae1339cb5a7cf28362d01e7220b4a16c] - PD [One-Way-Between-Groups ANOVA- Free Statistics Software (Calculator)] [WS5 Question 7 Sh...] [2011-11-08 16:47:06] [ae1339cb5a7cf28362d01e7220b4a16c] - P [One-Way-Between-Groups ANOVA- Free Statistics Software (Calculator)] [] [2011-11-08 17:03:14] [e21b9c93af4eb9605ecfaf58a559e5ab] - P [One-Way-Between-Groups ANOVA- Free Statistics Software (Calculator)] [Workshop 5 - Q6 KT] [2011-11-08 22:27:19] [805a2cd4f7b6665cd8870eed4006f53c] | |||||||||||||||||||||||||||||||||||||||||||||||||||||||||||||||||||||||||||||||||||||||||||||||||||||||||||||||||||||||||||||||||||||||||||||||||||||||||||||||||||||||||||||||
| Feedback Forum | |||||||||||||||||||||||||||||||||||||||||||||||||||||||||||||||||||||||||||||||||||||||||||||||||||||||||||||||||||||||||||||||||||||||||||||||||||||||||||||||||||||||||||||||
Post a new message | |||||||||||||||||||||||||||||||||||||||||||||||||||||||||||||||||||||||||||||||||||||||||||||||||||||||||||||||||||||||||||||||||||||||||||||||||||||||||||||||||||||||||||||||
Dataset | |||||||||||||||||||||||||||||||||||||||||||||||||||||||||||||||||||||||||||||||||||||||||||||||||||||||||||||||||||||||||||||||||||||||||||||||||||||||||||||||||||||||||||||||
| Dataseries X: | |||||||||||||||||||||||||||||||||||||||||||||||||||||||||||||||||||||||||||||||||||||||||||||||||||||||||||||||||||||||||||||||||||||||||||||||||||||||||||||||||||||||||||||||
0 'T' 0 'T' 1 'T' 0 'T' 0 'T' 0 'T' 0 'T' 1 'T' 1 'T' 0 'T' 0 'T' 1 'T' 1 'T' 1 'T' 0 'T' 0 'T' 0 'T' 0 'T' 1 'T' 0 'T' 0 'T' 0 'T' 0 'T' -1 'T' 0 'T' -1 'T' 0 'T' 0 'T' 0 'T' 0 'T' -1 'T' 0 'T' 0 'T' 0 'T' 0 'T' 0 'T' 0 'T' 1 'E' 1 'E' 0 'E' 0 'E' 0 'E' 0 'E' 0 'E' 0 'E' 1 'E' 1 'E' 0 'E' 0 'E' 0 'E' 1 'E' 0 'E' 1 'E' 0 'E' 1 'E' 1 'E' 1 'E' 1 'E' 0 'E' 0 'E' 1 'E' 0 'E' 0 'E' -1 'E' 0 'E' 1 'E' 1 'E' 0 'E' 0 'E' 0 'E' 1 'S' 1 'S' 1 'S' 1 'S' 0 'S' -1 'S' 0 'S' 0 'S' -1 'S' 0 'S' 0 'S' 0 'S' 0 'S' -1 'S' 0 'S' 0 'S' -1 'S' 0 'S' 0 'S' 0 'S' 0 'S' 0 'S' 0 'S' 1 'S' 0 'S' 0 'S' 0 'S' 0 'S' 0 'S' 0 'S' 0 'S' 0 'S' 0 'S' 0 'S' 1 'S' | |||||||||||||||||||||||||||||||||||||||||||||||||||||||||||||||||||||||||||||||||||||||||||||||||||||||||||||||||||||||||||||||||||||||||||||||||||||||||||||||||||||||||||||||
Tables (Output of Computation) | |||||||||||||||||||||||||||||||||||||||||||||||||||||||||||||||||||||||||||||||||||||||||||||||||||||||||||||||||||||||||||||||||||||||||||||||||||||||||||||||||||||||||||||||
| |||||||||||||||||||||||||||||||||||||||||||||||||||||||||||||||||||||||||||||||||||||||||||||||||||||||||||||||||||||||||||||||||||||||||||||||||||||||||||||||||||||||||||||||
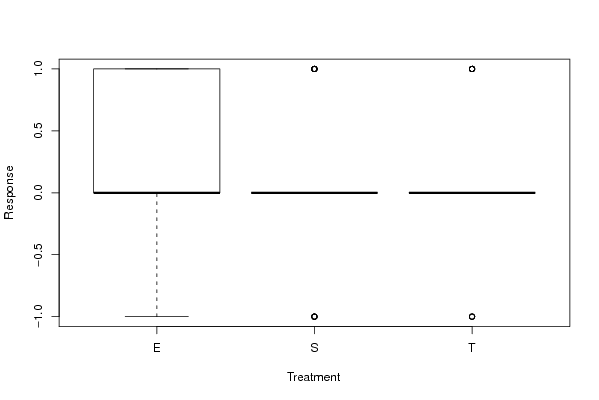
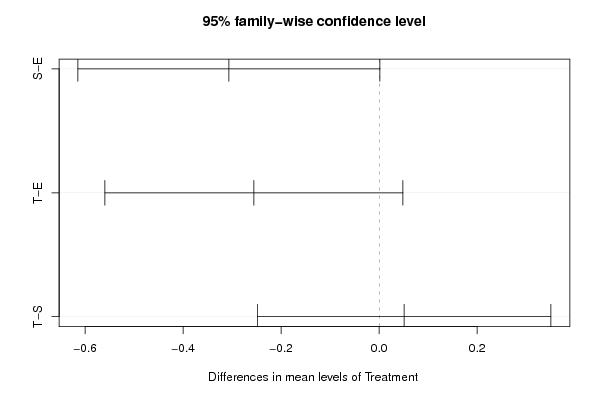
Figures (Output of Computation) | |||||||||||||||||||||||||||||||||||||||||||||||||||||||||||||||||||||||||||||||||||||||||||||||||||||||||||||||||||||||||||||||||||||||||||||||||||||||||||||||||||||||||||||||
Input Parameters & R Code | |||||||||||||||||||||||||||||||||||||||||||||||||||||||||||||||||||||||||||||||||||||||||||||||||||||||||||||||||||||||||||||||||||||||||||||||||||||||||||||||||||||||||||||||
| Parameters (Session): | |||||||||||||||||||||||||||||||||||||||||||||||||||||||||||||||||||||||||||||||||||||||||||||||||||||||||||||||||||||||||||||||||||||||||||||||||||||||||||||||||||||||||||||||
| par1 = 1 ; par2 = 2 ; par3 = TRUE ; | |||||||||||||||||||||||||||||||||||||||||||||||||||||||||||||||||||||||||||||||||||||||||||||||||||||||||||||||||||||||||||||||||||||||||||||||||||||||||||||||||||||||||||||||
| Parameters (R input): | |||||||||||||||||||||||||||||||||||||||||||||||||||||||||||||||||||||||||||||||||||||||||||||||||||||||||||||||||||||||||||||||||||||||||||||||||||||||||||||||||||||||||||||||
| par1 = 1 ; par2 = 2 ; par3 = TRUE ; | |||||||||||||||||||||||||||||||||||||||||||||||||||||||||||||||||||||||||||||||||||||||||||||||||||||||||||||||||||||||||||||||||||||||||||||||||||||||||||||||||||||||||||||||
| R code (references can be found in the software module): | |||||||||||||||||||||||||||||||||||||||||||||||||||||||||||||||||||||||||||||||||||||||||||||||||||||||||||||||||||||||||||||||||||||||||||||||||||||||||||||||||||||||||||||||
cat1 <- as.numeric(par1) # | |||||||||||||||||||||||||||||||||||||||||||||||||||||||||||||||||||||||||||||||||||||||||||||||||||||||||||||||||||||||||||||||||||||||||||||||||||||||||||||||||||||||||||||||